For the past couple of days, my timeline has been full of headlines about how medical students are avoiding states with more restrictive abortion laws.
The headlines are tantalizing… but are they true?
I’m skeptical.
(🧵)
The headlines are tantalizing… but are they true?
I’m skeptical.
(🧵)
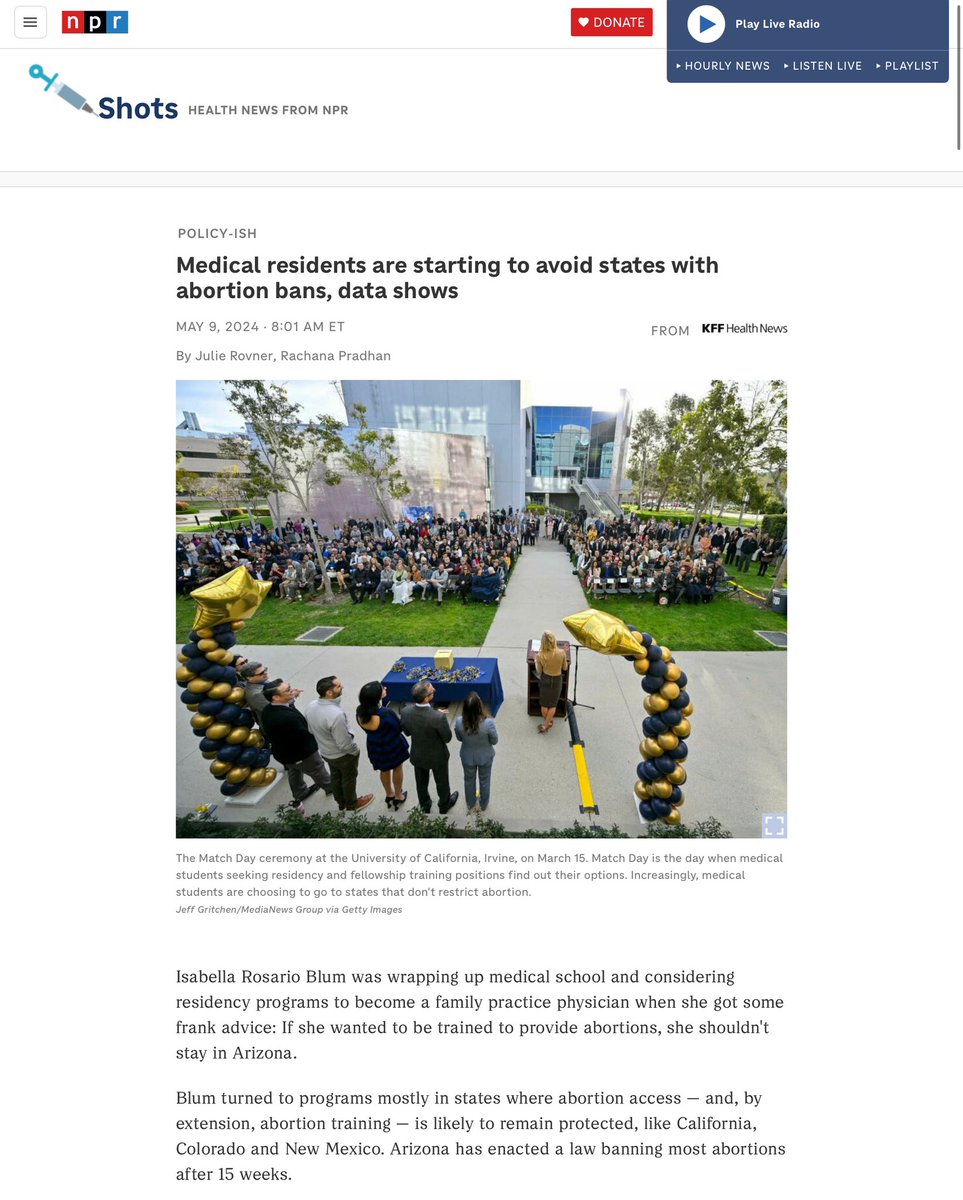
If you’ve somehow missed all of this, here’s a typical article (which happens to be the one I screenshotted above).
npr.org/sections/healt…
npr.org/sections/healt…
…and here’s the analysis by the @AAMCtoday, which used Electronic Residency Application Service data to find a decrease in U.S. MD graduates applying to residency programs in states with more restrictions on reproductive health.
aamcresearchinstitute.org/our-work/data-…
aamcresearchinstitute.org/our-work/data-…
Their analysis was straightforward.
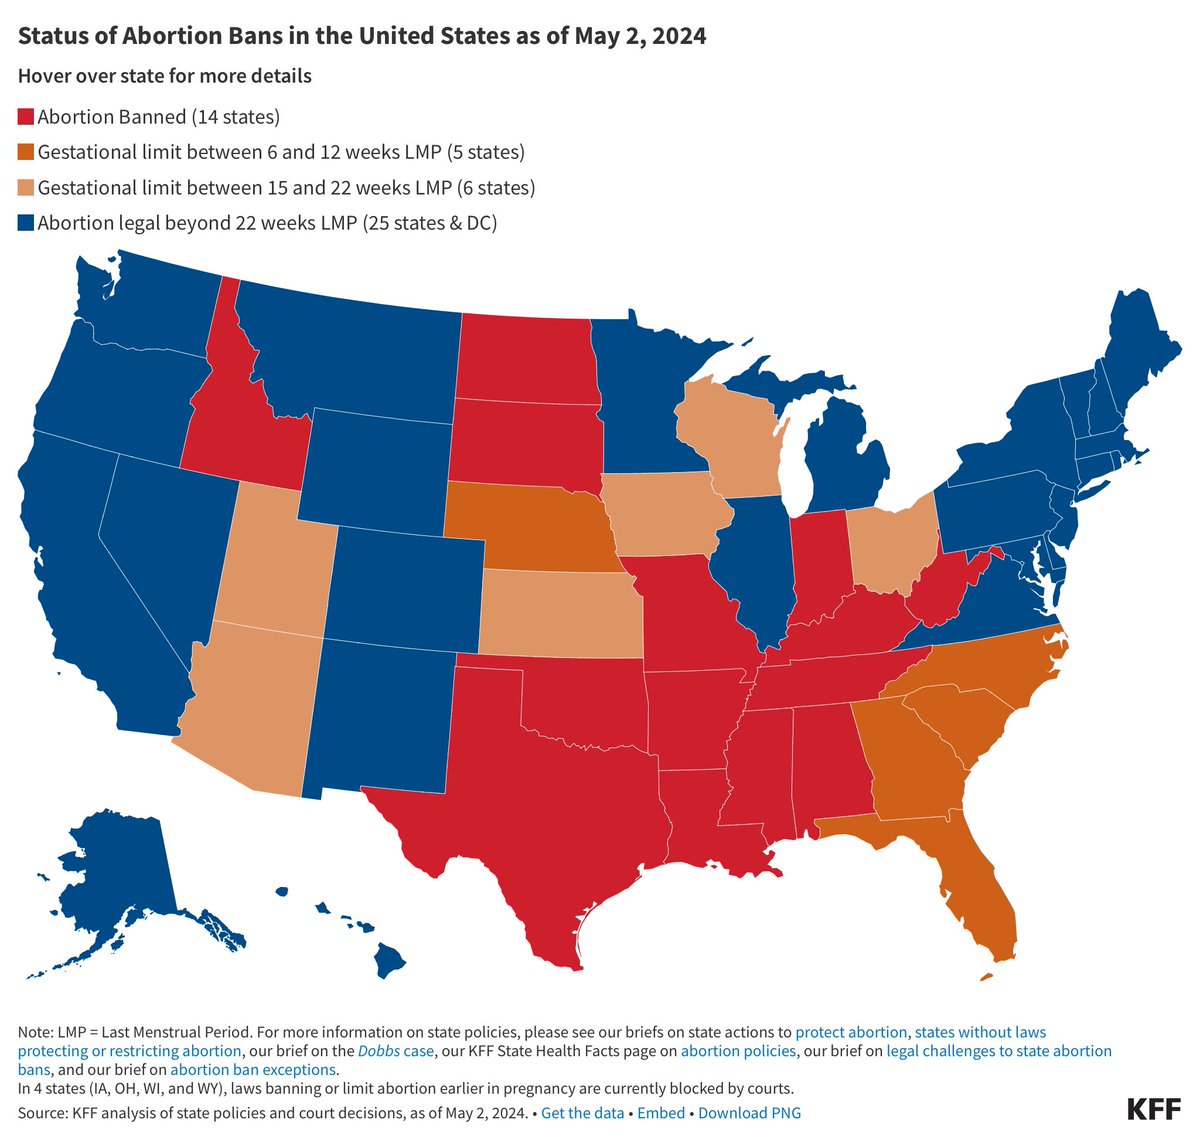
First, they broke states into 3 groups:
1. abortion remains legal (blue)
2. gestational age restrictions (orange)
3. abortion banned (red)
Then, they looked at how many ERAS applications were sent to residency programs in those state groups.
First, they broke states into 3 groups:
1. abortion remains legal (blue)
2. gestational age restrictions (orange)
3. abortion banned (red)
Then, they looked at how many ERAS applications were sent to residency programs in those state groups.

Last year, applications from U.S. MD applicants were down across the board.
But applications ⬇️ most in states with abortion bans; a little less in states with gestational age restrictions; and the least in states where abortion remained legal.
The effect was largest in OBGYN.
But applications ⬇️ most in states with abortion bans; a little less in states with gestational age restrictions; and the least in states where abortion remained legal.
The effect was largest in OBGYN.


There are several things about the AAMC’s numbers that don’t make sense to me, but for now, I’m gonna set all that aside and take their figures as fact - because even then, there are some strange things.
Only *two* states saw an increase in applicants: Montana (30.3%) and Delaware (3.7%). Both of these are states where abortion remains legal.
But then again, so is the state that saw the biggest drop in applicants: New Mexico (-19.3%).
But then again, so is the state that saw the biggest drop in applicants: New Mexico (-19.3%).

Some red states saw big decreases - e.g., Texas dropped by 11.7%.
But Washington (blue) had an even bigger drop - in both relative (13.7%) and absolute terms (-1521 vs. -1499).
But Washington (blue) had an even bigger drop - in both relative (13.7%) and absolute terms (-1521 vs. -1499).
Similarly, abortion-banned Indiana (-9.1%) saw a smaller drop in applicants than abortion-legal California (-9.2%).
Oregon (-13.7%) had a bigger drop than Tennessee (-12.7%).
Colorado (-10.6%) had a bigger decrease than North Dakota (-9.8%).
Wait, what?
Oregon (-13.7%) had a bigger drop than Tennessee (-12.7%).
Colorado (-10.6%) had a bigger decrease than North Dakota (-9.8%).
Wait, what?
If the decline in applicants is driven by a desire to avoid abortion restrictions - or even with other political/social factors that are collinear with abortion restrictions - shouldn’t applicants be flocking to the bluest states?
Or is something else going on?
Or is something else going on?
Beyond any state-by-state breakdown, the big story in the AAMC analysis is the decline in applications OVERALL.
So IMHO, we should also look at the state breakdown through the lens of what is driving this unprecedented decrease in applications:
And that’s preference signaling.
So IMHO, we should also look at the state breakdown through the lens of what is driving this unprecedented decrease in applications:
And that’s preference signaling.
Dobbs wasn’t the only big thing that changed in residency application over the past couple of years.
Among other things, the AAMC also introduced geographic preference signaling, in which applicants can signal up to three regions of interest.
Among other things, the AAMC also introduced geographic preference signaling, in which applicants can signal up to three regions of interest.
And when I look at the state-by-state results, they seem to conform better to the ERAS geographic signaling map than the KFF map.

If you’re unfamiliar with preference signaling, or the strategy behind effective preference signaling, I’d invite you to watch the guide for applicants I made last year:
The Applicant’s Guide to Strategic Preference Signaling
The Applicant’s Guide to Strategic Preference Signaling
Briefly - because applications are expensive (and geographic preference signaling is free), it makes sense for many applicants to target most of their residency applications within regions for which they’ve indicated a geographic preference.
Thing is, you can only signal three geographic regions… and these regions aren’t created equally.
And yes, yes, yes - many applicants have strong desires to be in one geographic region or another. But ALL applicants have a strong desire to successfully match.
And yes, yes, yes - many applicants have strong desires to be in one geographic region or another. But ALL applicants have a strong desire to successfully match.
The ERAS regions that attract the *fewest* geographic preference signals from applicants are the “West North Central” (yellow), “East South Central” (pink), Mountain West (blue), and “West South Central” (dark red).
And these are the states with the greatest ⬇️ in applicants.
And these are the states with the greatest ⬇️ in applicants.

In contrast, the New England (purple), Middle Atlantic (orange), South Atlantic (light blue) and “East North Central” (green) have greater program density and attract more geographic signals - and applicants.
And these states were most protected against a decline in applicants.
And these states were most protected against a decline in applicants.
I think this best explains why a state like Kentucky (-15.4%) did worse than West Virginia (-12.0). Both states are abortion-banned - but one is in a more favorable ERAS region.
Similarly, Minnesota (-12.5%) did much worse than neighboring Wisconsin (-6.3%) - but it’s stuck in the yellow region. Meanwhile, Indiana’s decrease (-9.1%) was similar to that in abortion legal states like Maine (-8.8%) and Connecticut (-9.3%).
None of this is to say that applicants aren’t motivated by the political climates in states where they apply. But that was true pre-Dobbs, too.
I’m certain some applicants are strongly motivated by this issue. I’m just skeptical it’s of the magnitude the AAMC suggests.
I’m certain some applicants are strongly motivated by this issue. I’m just skeptical it’s of the magnitude the AAMC suggests.
Totally forgot to say:
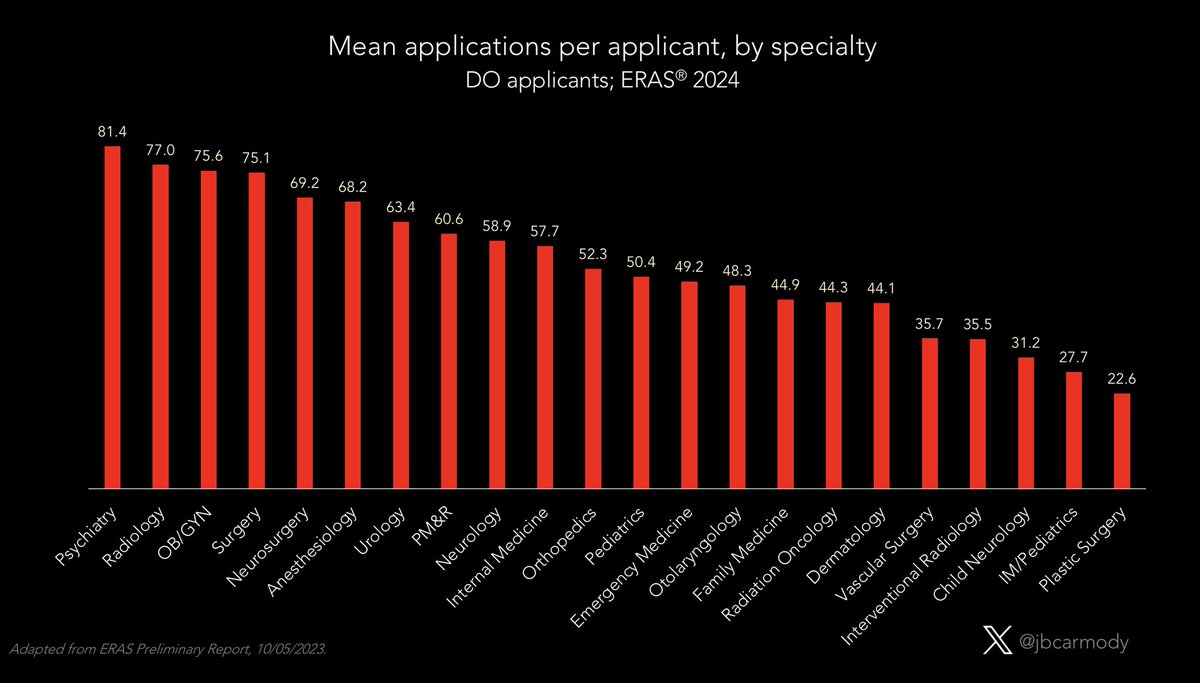
This probably also explains the AAMC’s otherwise-puzzling finding that the avoidance of abortion-limited states only applies to MD applicants, not DOs or IMGs.
This probably also explains the AAMC’s otherwise-puzzling finding that the avoidance of abortion-limited states only applies to MD applicants, not DOs or IMGs.

Although the greatest density of prestigious programs within ERAS regions is in the East Coast/Great Lakes, the regions with the greatest density of DO- and IMG-friendly programs are in other regions (where states tend to have more abortion restrictions).

• • •
Missing some Tweet in this thread? You can try to
force a refresh