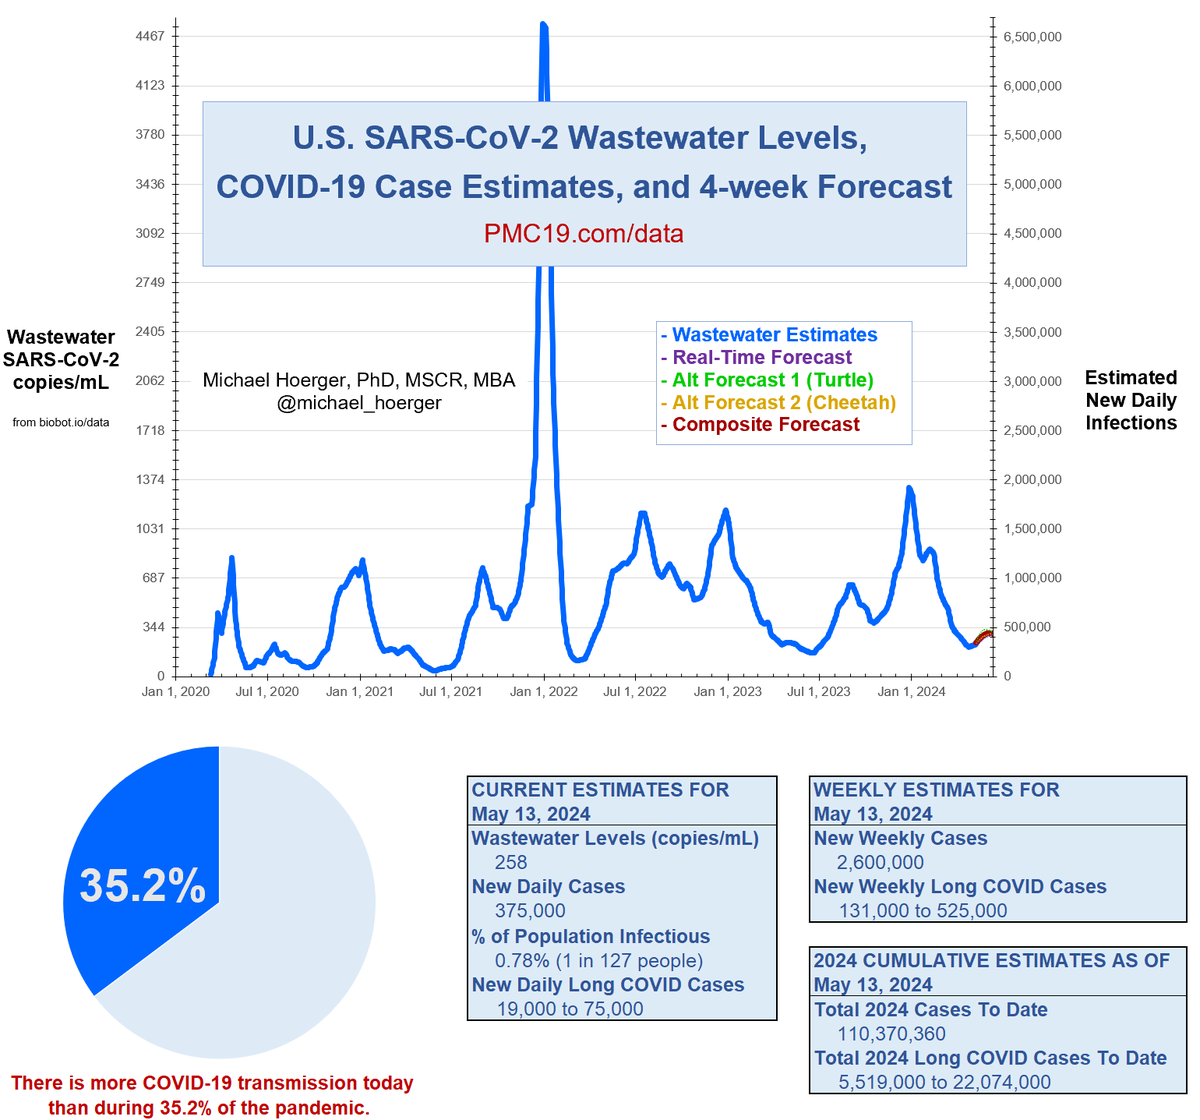
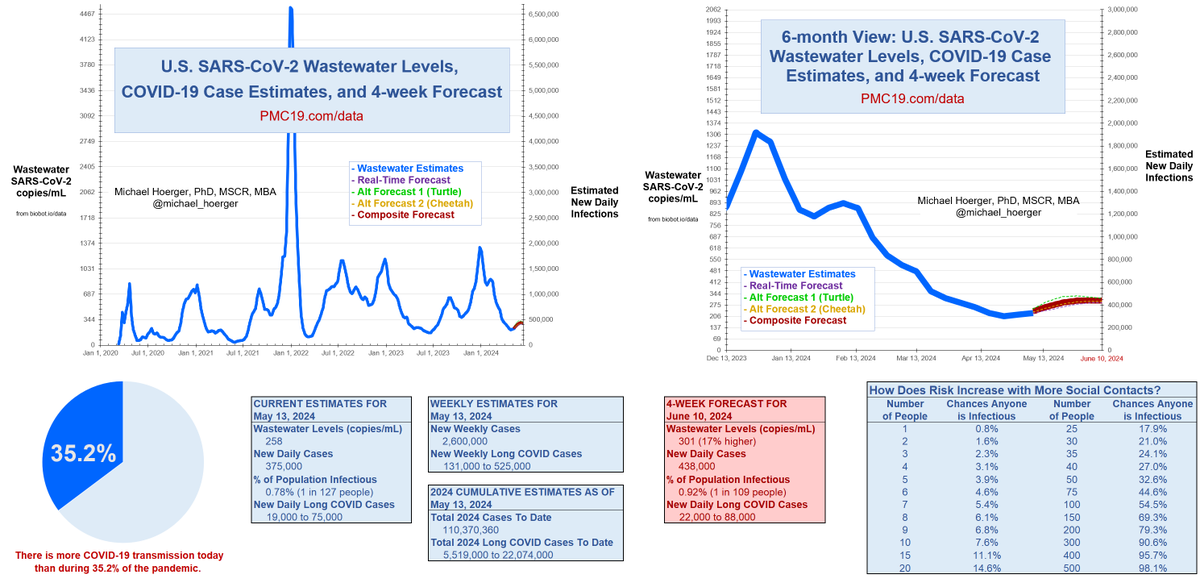
Expect transmission to hover around 350,000-500,000 infections/day through mid-July.
Transmission has increased the past 2 weeks. Now we have some clarity on the forecast (red line). It looks like we should fall short of the 500K mark through May (more like 425-485K for the May "high"). This isn't quite high enough to rebound us into a new valley in June. Instead, I expect a plateau from late May to mid-July, before transmission takes off in August.
This is good and bad for scheduling dental/medical visits. It's "good" in that it's relatively arbitrary to schedule any time between now and mid-July, at least based on the current data we have. It's "bad" in that it looks like we have already bottomed out on transmission for 2024. Before today, I would have said there was about a 50-50 chance we would rebound to a low in June. That now looks unlikely.
In the near term, expect the "gist" of this to stay the same, but the specifics could still fluctuate over the next couple weeks. For example, if Biobot corrects their real-time data 10% upward or downward, that changes the forecast. They have been a little inconsistent the past 2.5 months, correcting real-time data in the 3-12% range. Before that, the typical error in real-time reports was often 0-1%, except with bigger corrections near wave peaks.
I remain very concerned about August/September when I peek ahead on my graph.
Full dashboard for the PMC COVID-19 Forecasting Dashboard for May 13, 2024: pmc19.com/data/index.php
• • •
Missing some Tweet in this thread? You can try to
force a refresh
Transmission continues to decline. About 1 in 161 people in the U.S. are infectious, the lowest levels since July 1. Transmission levels are higher than during 27% of the pandemic, but a good time to catch up on delayed care. 1/4
I have some concerns about Biobot's real-time data quality at the moment. Their real-time data have over-reported levels the past 8 weeks (11% last week, previously 6%, 10%, 7%, 5%, 9%, 4%, 5%) relative to later corrections. Huge bias!
2/4
Qualitatively, the over-reporting in real-time data lead me to believe there's a 50-50 chance we see a May "wavelet" versus continued decline for a couple months. Some of the county-level Biobot data seem implausible (e.g., levels of "3" in Mason County, WA, but others too). 3/4
31 Reasons Why the New 1-Day COVID Isolation Policy is Wrong
#1
Experts in modeling and testing know that people are infectious with COVID for an average of 7 days, with substantial variability around that average.
#2
People use defense mechanisms to temporarily avoid the death anxiety evoked by thinking of COVID. The too-short 5-day iso was an example of this (see final example).
Such defenses provide temporary relief and are almost always harmful long-term.
PMC COVID-19 Forecast, Week of Feb 26, 2024
1 of 5 🧵
Forecast for the next month
Over the next month, we should see transmission fall from 790,000 infections/day toward more like a range of 200,000-450,000 infections per day, depending on better or worse scenarios.
That's "good" news in the relative sense for those putting off medical appointments the past 6 months, though still extremely high transmission in any objective sense.
See the online report for details on the models.
Surge in Context
At this point in the surge, it is clear that the peak transmission day was around December 27 (1.92 million/day), and the midpoint of “surging” infections (>1 million/day) was around January 9.
We are estimated to have had 85 total days with >1 million infections per day (November 28 through February 20) during the surge, though these numbers may still fluctuate with corrections the next few weeks.
The low-point leading into the surge was October 18 at 547,000 infections/day. Infections have been at “wave” levels (>500,000 infections/day or higher) since the onset of the late summer wave surpassed that milestone on July 27. We are estimated to dip below 500,000 infections/day around March 6.
This is very unfortunate timing because the medical facilities that enacted universal masking may end policies on March 1. Many were hoping for a period of lower transmission before such policies ended. As of today, the estimated low point for transmission is March 27 (348,000 infections/day), but the level and date are subject to much uncertainty.
PMC COVID-19 Forecast, Week of Feb 26, 2024
2 of 5 🧵
Current State of the Pandemic
🔹73 million infections in the U.S. in 2024 (so far)
🔹790,000 daily infections
🔹1.66% (1 in 60) actively infectious
🔹40,000+ resulting #LongCOVID cases/day
Deeper Dive
Transmission is finally starting to decline again, and expect major declines the next four week.
U.S. wastewater levels indicate that COVID transmission is higher than during 58.4% of the days of the pandemic (down from 85.9% a week ago). Transmission is lower than 41.6% of the pandemic.
As we noted the past two weeks, we believed the post-peak hill was itself peaking on around February 7th and that last week’s slightly higher values might get retroactively corrected downward. That was, in fact, the case (the peak was the 7th), and transmission has fallen further since.
We are still at very high “wave” levels, but no longer “surging” at over a million infections/day. The big picture remains very bad, but this is good news for people putting off medical appointments for months.
PMC COVID-19 Forecast, Week of Feb 26, 2024
3 of 5 🧵
Risks in Group Settings
Although transmission is falling, it's easy to get distracted by the relative changes and ignore that the absolute risk remains high, especially in large groups with limited or no mitigation.
In a group of 10, there's a 15% at least one person is actively infectious. In a group of 30, it's a 40% chance, and so forth. Almost nobody would take those chances of a serious illness if informed and capable of grappling with the seriousness of that risk without becoming defensive. Unfortunately, a lot of institutions are pushing minimizer narratives if not directly forcing students and workers into more dangerous settings.
Dr. Moriarty & other modelers know people are infectious for an average of about 7 days, per high-quality studies. Many for much longer.
Dr. Mina's pinned Tweet lays out a sample timeline.
Sending kids to school on Day 2 positive will essentially maximize infections. 2/4
The consequence of the California 1-day isolation policy is that many parents and grandparents will develop serious health conditions and too often die prematurely.
Bad for families. Good for inspiring the next generation of bereavement workers.
1 / 6 🧵
PMC COVID-19 Forecast, Week of Feb 5, 2024
We are seeing escalating transmission in a post-peak hill.
🔹2.8% (1 in 36) actively infectious
🔹1.3 million infections/day
🔹Hill peaks in 2 days 🤞
🔹>65,000 resulting #LongCOVID cases/day
2 / 6 🧵
PMC COVID-19 Forecast, Week of Feb 5, 2024
We began to see evidence of a post-peak hill 3 weeks ago. I was skeptical. The real-time data now bear this out. Hopefully we are not in a Terminator-style scenario where the technology outsmarts the maker. 🤣
3 / 6 🧵
PMC COVID-19 Forecast, Week of Feb 5, 2024
Zooming out to the full pandemic, we see transmission higher than a week ago, and higher than 87.8% of the pandemic.
Nearly 10 million infections/week. >50 million estimated infections so far in 2024 in the U.S. alone.