Jeff Bezos, Mark Zuckerberg, and Peter Thiel all sold their stocks
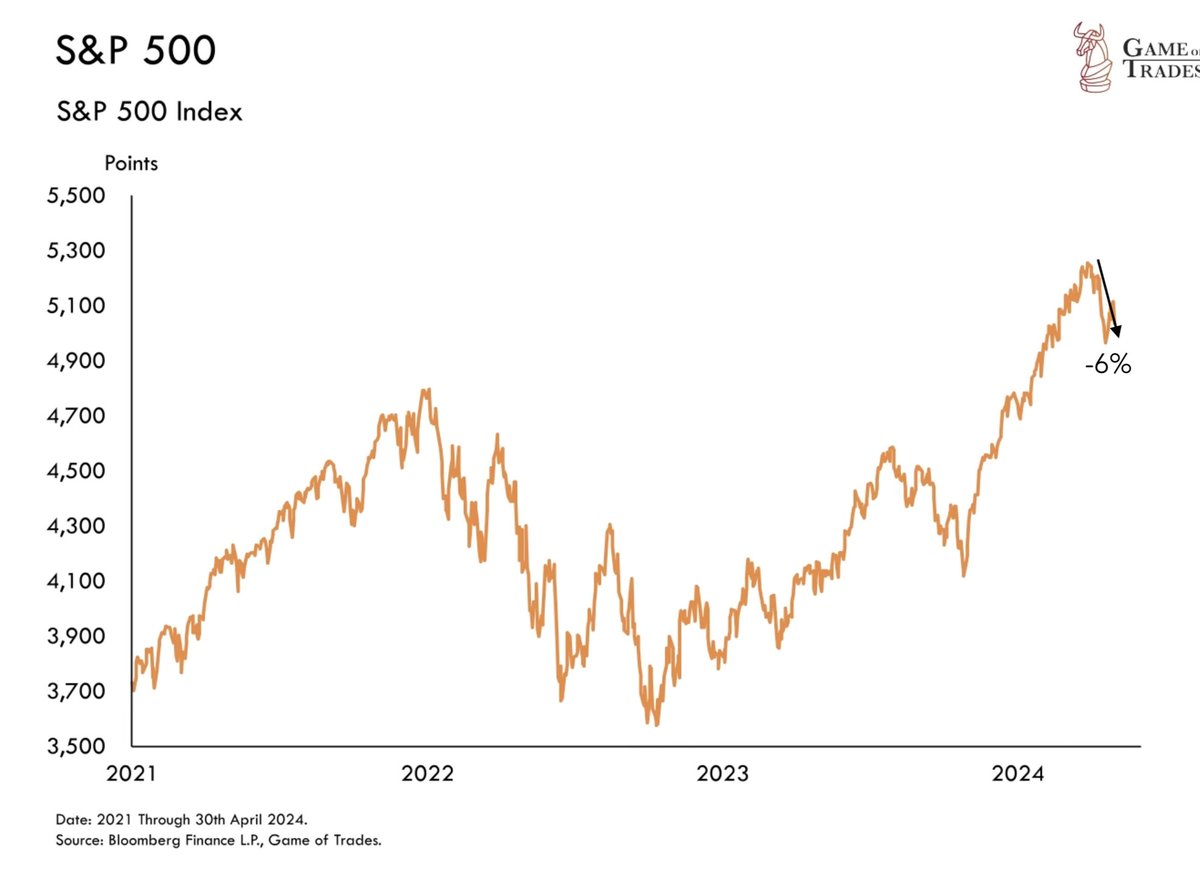
Just before the market erased $2 trillion
Is this the start of something bigger?
A thread 🧵
Just before the market erased $2 trillion
Is this the start of something bigger?
A thread 🧵
2/ We highlighted this in early 2024 showing a big rise in insider selling
Following insider transaction proved helpful once again
Following insider transaction proved helpful once again
https://x.com/GameofTrades_/status/1760001437814436092
3/ This raises the question:
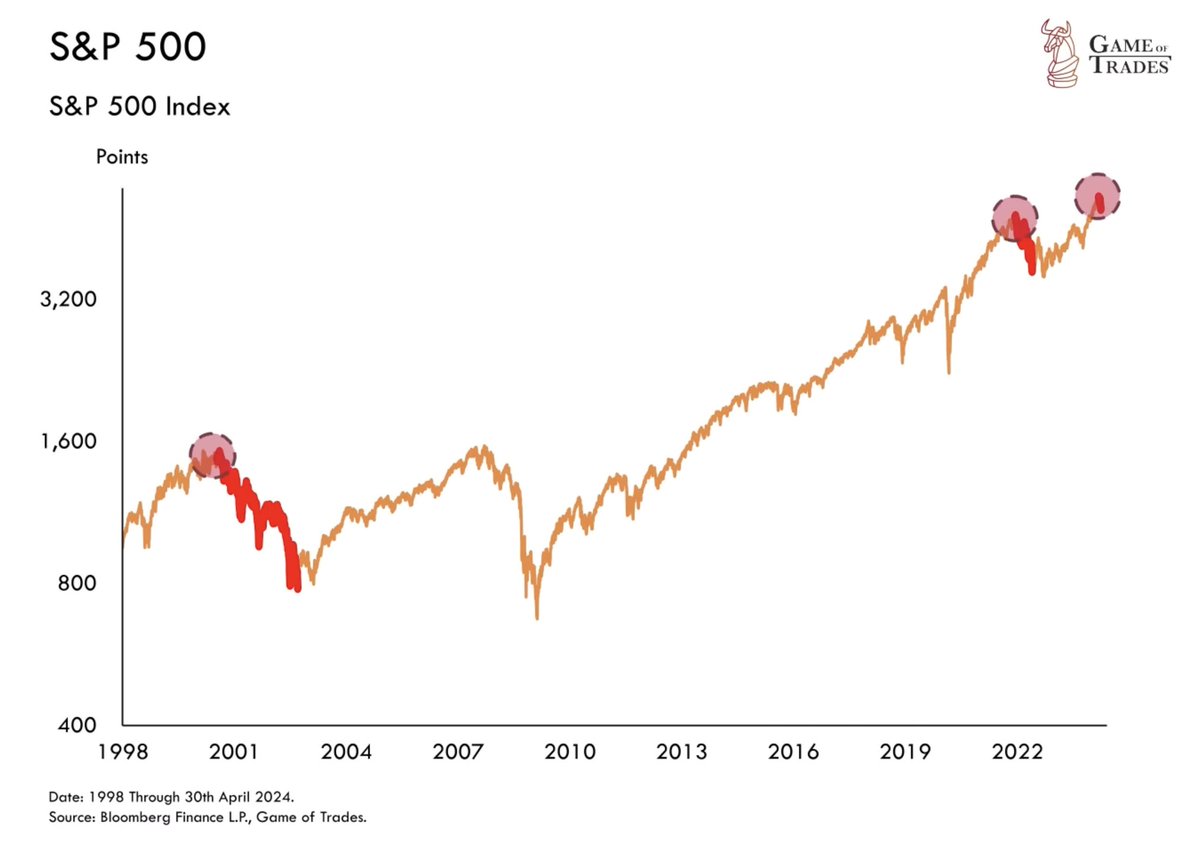
Did they time the top of a small 6% correction or much a larger sell off like in 2021 or 1999?
Did they time the top of a small 6% correction or much a larger sell off like in 2021 or 1999?
4/ Before we address this question, it’s important to note that this correction was predictable
The S&P 500 hadn't touched its 50-day moving average in 154 days
Which is a rare and extended streak, historically signaling an upcoming pullback
The S&P 500 hadn't touched its 50-day moving average in 154 days
Which is a rare and extended streak, historically signaling an upcoming pullback

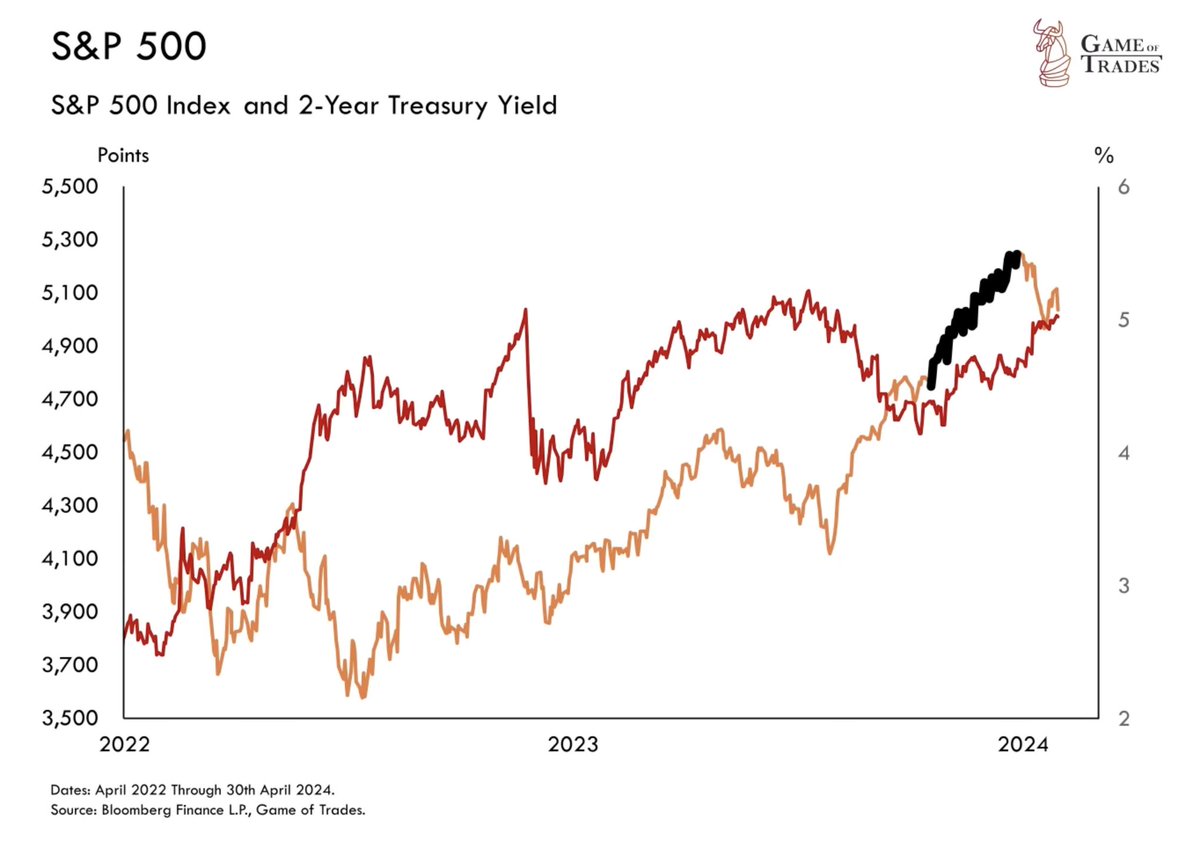
5/ During this period, interest rates were climbing, with the 2-year yield rising from 4% in Jan to 4.7% by March
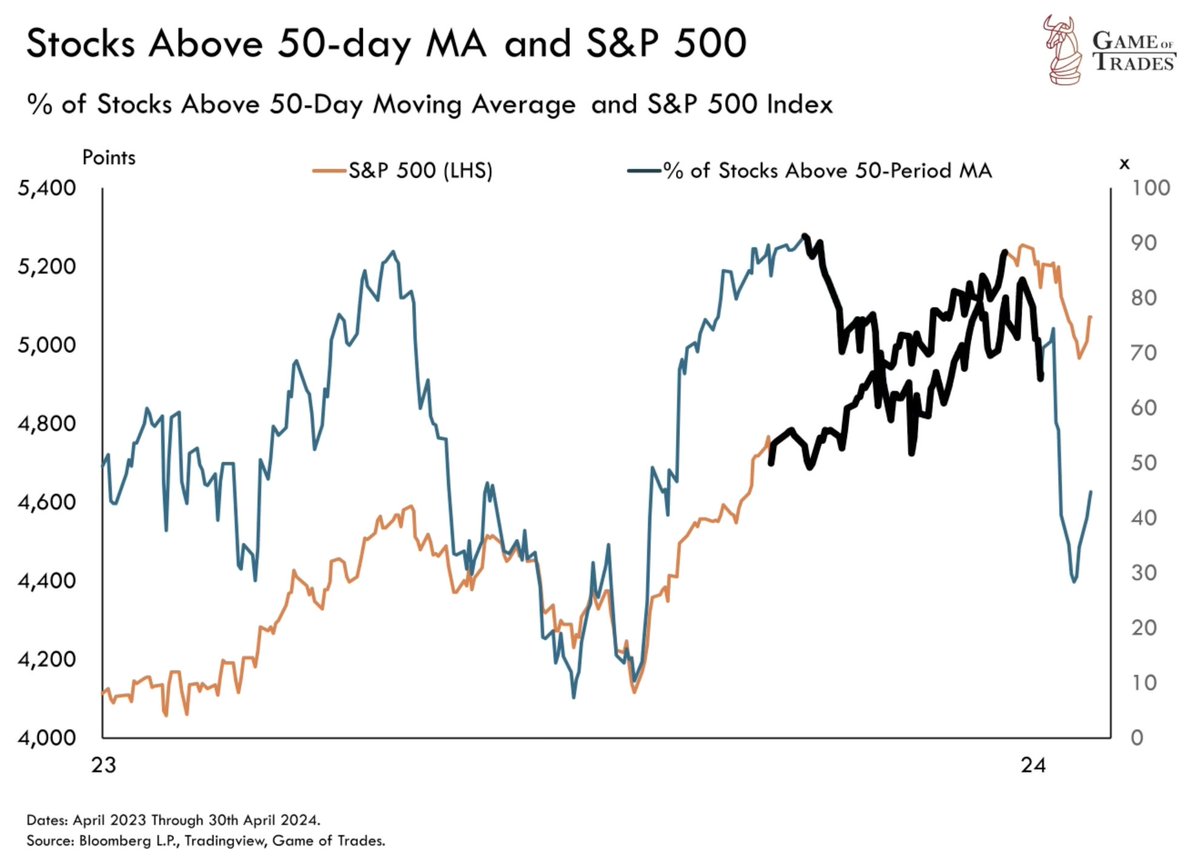
6/ Moreover, market breadth was also sending a warning signal
Late 2023 saw 90% of stocks above their 50-day average
By March 2024, this dropped to 75%
Even as the market rose, fewer stocks participated in the rally
Indicating weakening momentum
Late 2023 saw 90% of stocks above their 50-day average
By March 2024, this dropped to 75%
Even as the market rose, fewer stocks participated in the rally
Indicating weakening momentum
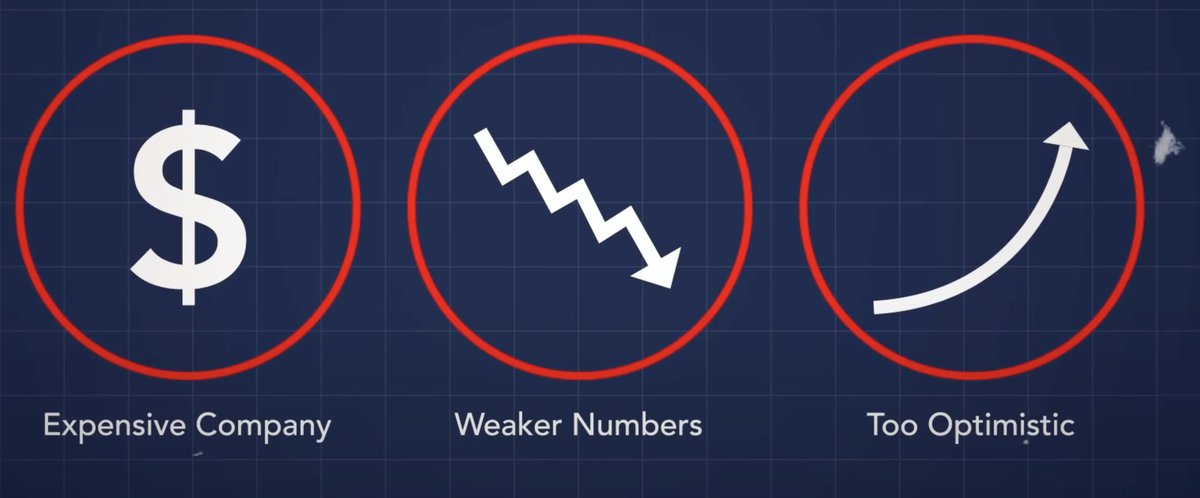
7/ Now, circling back to insider selling, why do insiders sell?
1. Overvaluation
2. Anticipation of weak performance
3. Overly optimistic market expectations
1. Overvaluation
2. Anticipation of weak performance
3. Overly optimistic market expectations
8/ In March 2024, insiders likely saw the 30% surge in the S&P 500 did not match the real world revenue
Many of those stocks are now down 10-15%, with insiders buying back at lower prices
Many of those stocks are now down 10-15%, with insiders buying back at lower prices

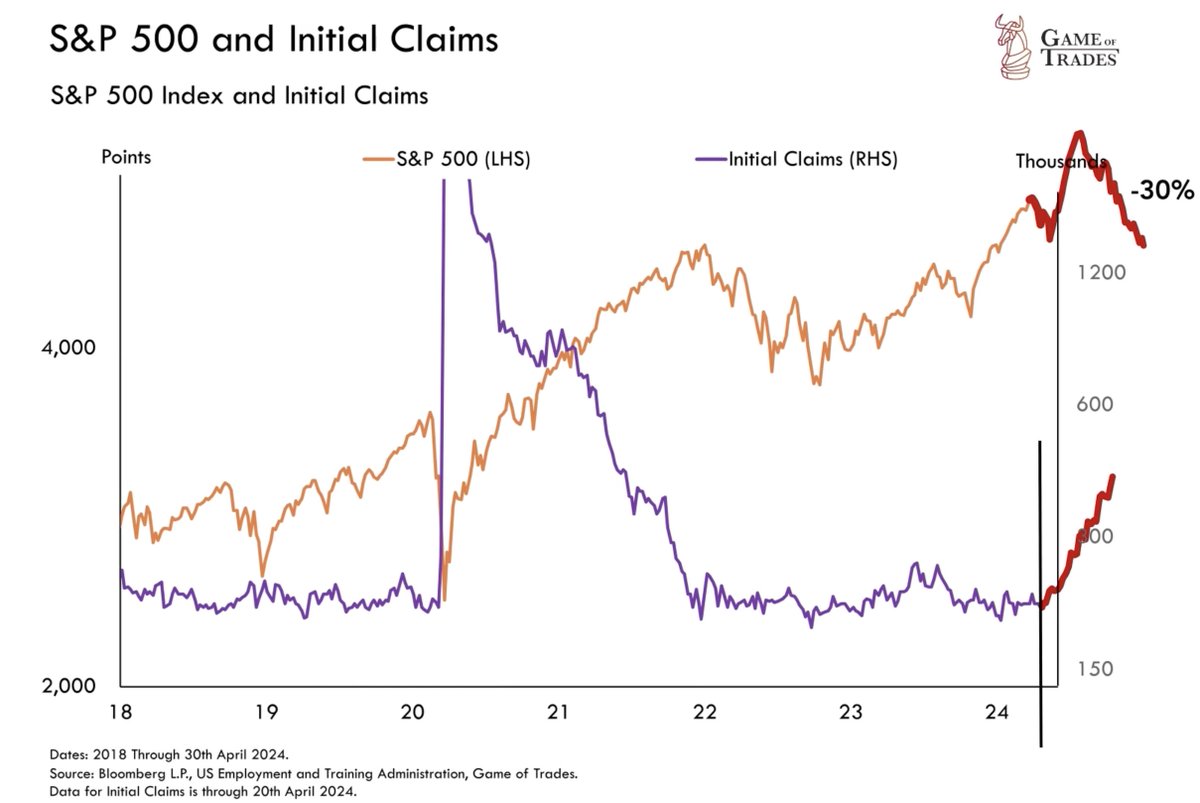
9/ After this pullback, we’ve closed our short on the S&P 500
Part of the reasoning is based on jobless claims
Which continue trending lower
Low unemployment levels typically fuel market growth
Suggesting this correction might be brief with more upside incoming
Part of the reasoning is based on jobless claims
Which continue trending lower
Low unemployment levels typically fuel market growth
Suggesting this correction might be brief with more upside incoming
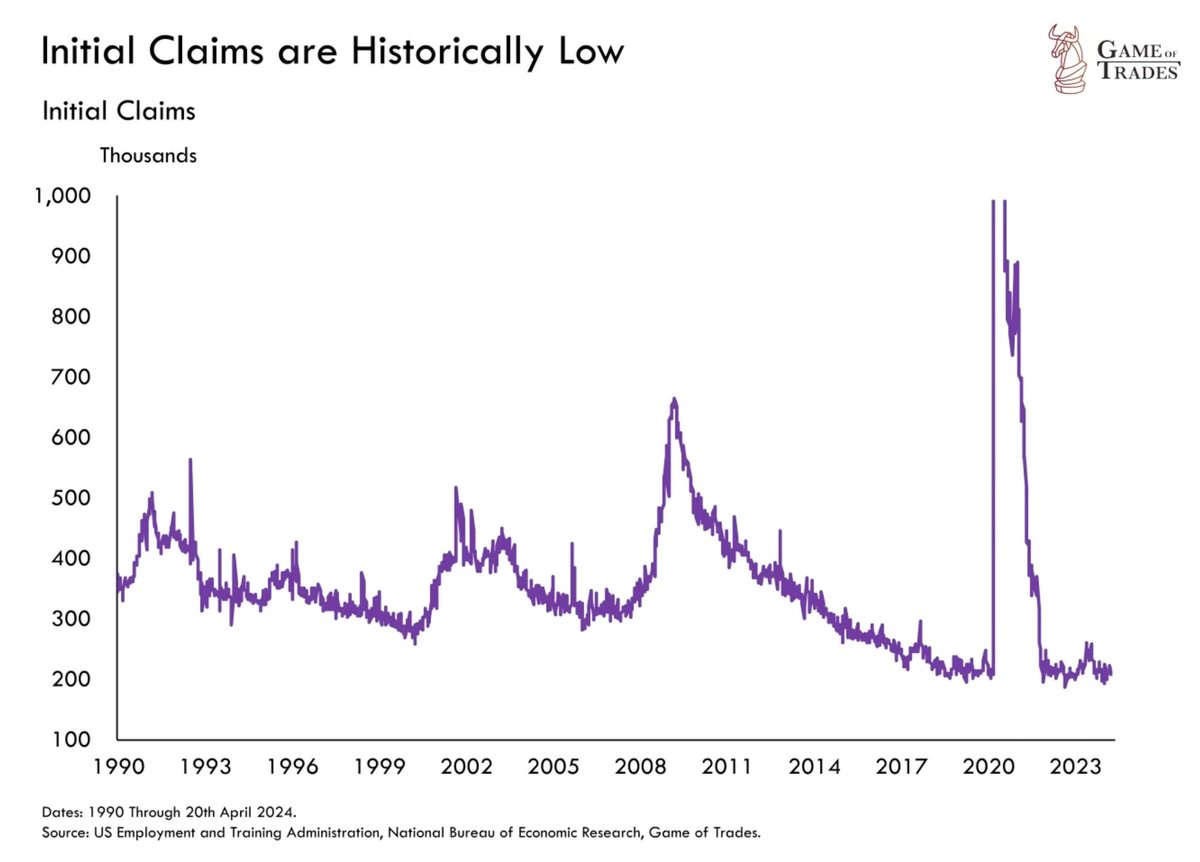
10/ Historical trends show that bear markets often start with rising jobless claims
As seen in 2008, 2000, and 1990
As seen in 2008, 2000, and 1990
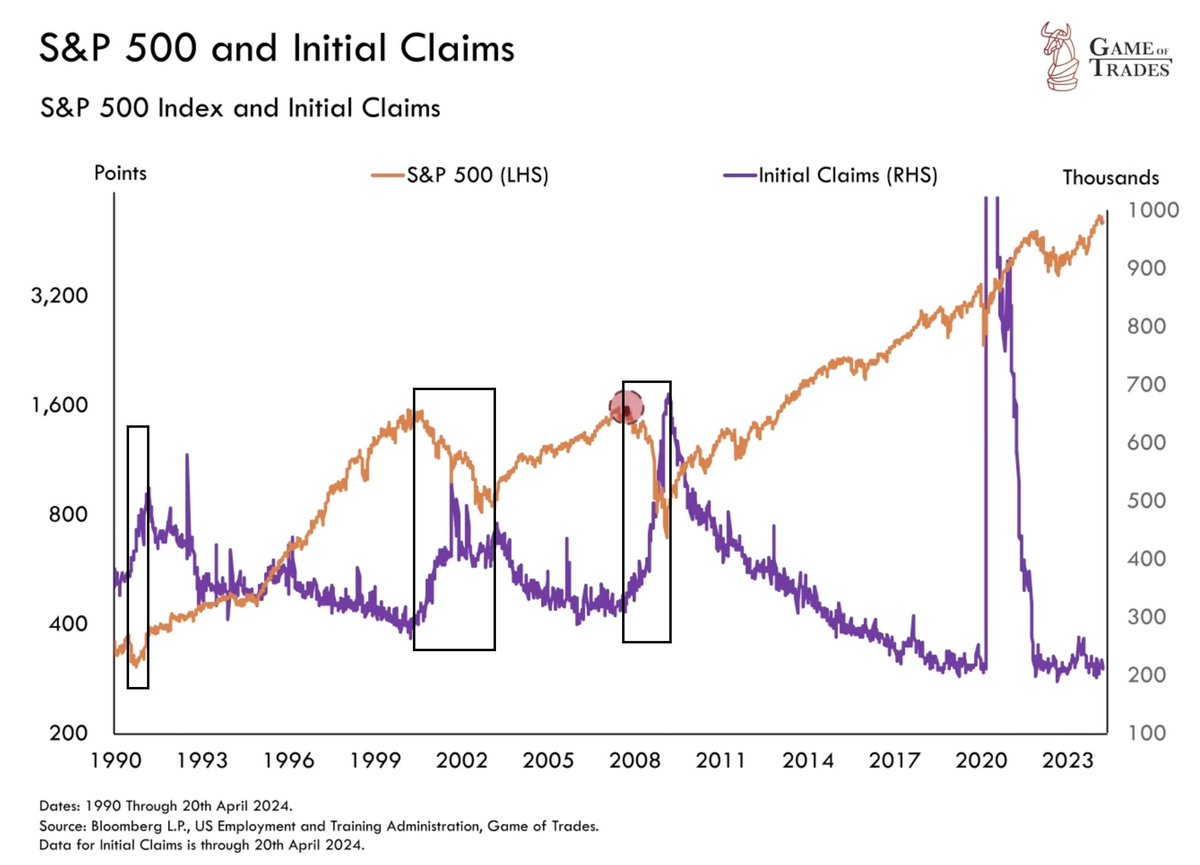
11/ One exception was the 2022 bear market
Which occurred even though initial claims were still low
Which occurred even though initial claims were still low
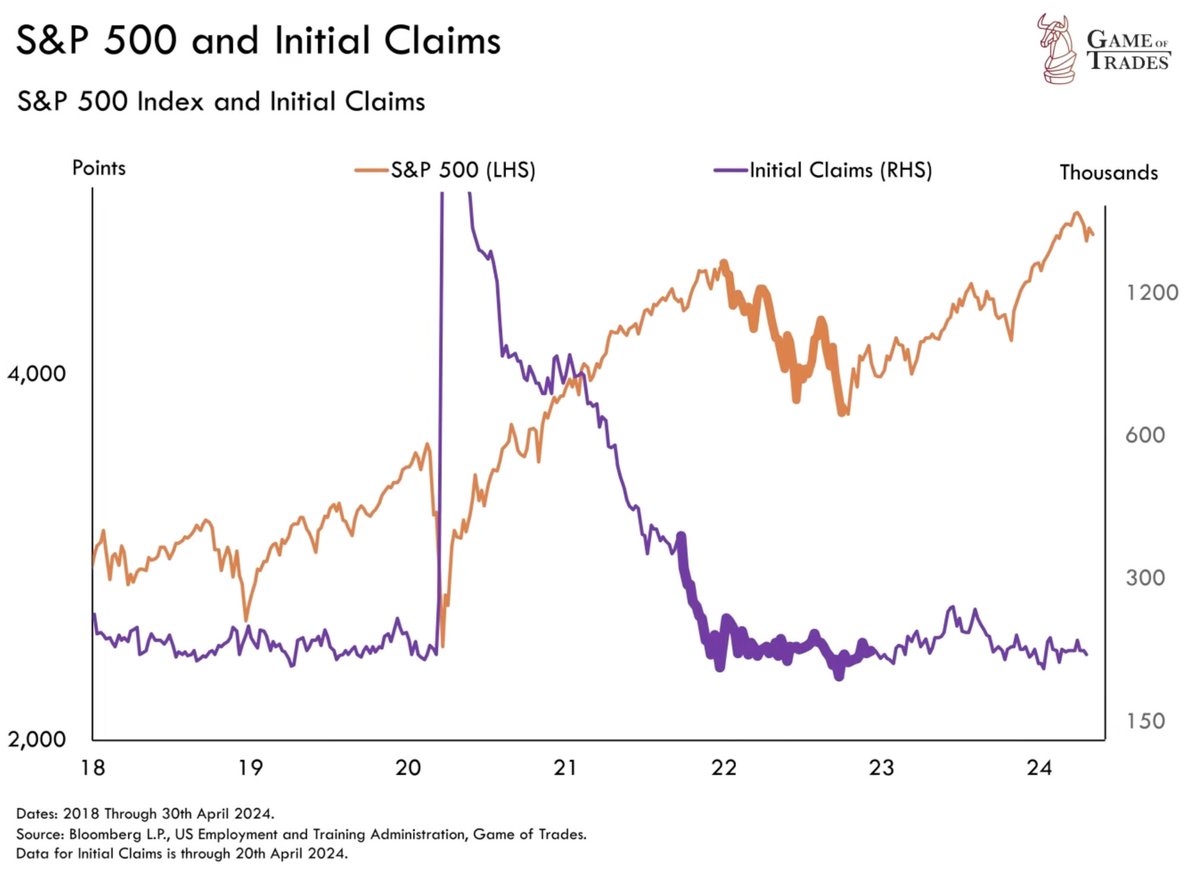
12/ With jobless claims still low today, we anticipate the current S&P 500 correction to be shallow
Likely leading to new highs until a significant rise in jobless claims triggers a deeper correction
At which point, we think the markets are likely to decline by at least 30%
Likely leading to new highs until a significant rise in jobless claims triggers a deeper correction
At which point, we think the markets are likely to decline by at least 30%
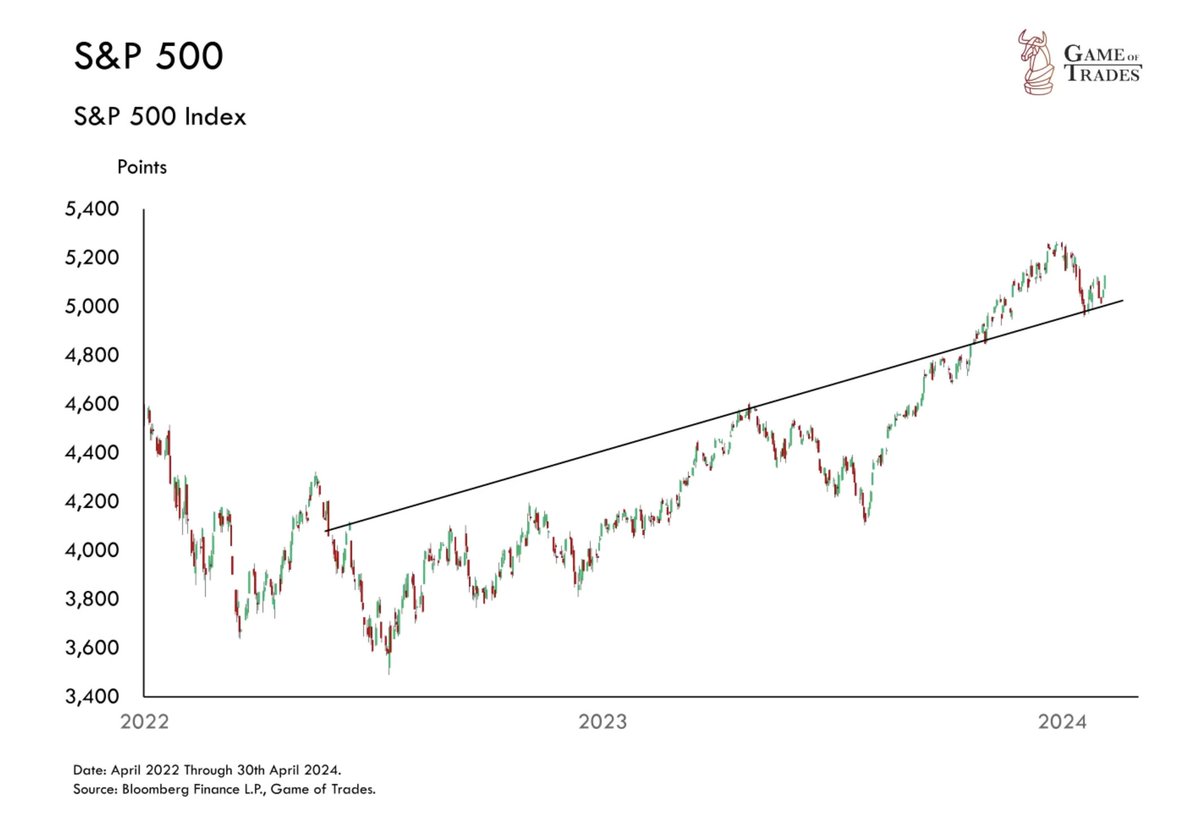
13/ Today, the S&P 500 shows a very bullish technical structure
It recently retested a key support level after breaking out its rising channel
We're gradually increasing equity exposure, betting that the market holds this support
IF this support gets broken, then all bets are off in the near-term
It recently retested a key support level after breaking out its rising channel
We're gradually increasing equity exposure, betting that the market holds this support
IF this support gets broken, then all bets are off in the near-term
14/ We're watching these technicals very closely at Game of Trades
Get access to our latest Watchlist, Premium Video, and Quant Models with a 7-day free trial at:
gameoftrades.net/?rfsn=7910058.…
Get access to our latest Watchlist, Premium Video, and Quant Models with a 7-day free trial at:
gameoftrades.net/?rfsn=7910058.…
15/ Thanks for reading!
If you enjoyed this thread, please ❤️ and 🔁 the first tweet below
And follow @gameoftrades_ for more market insights, finance and investment strategies
If you enjoyed this thread, please ❤️ and 🔁 the first tweet below
And follow @gameoftrades_ for more market insights, finance and investment strategies
https://twitter.com/GameofTrades_/status/1790411626409239014
• • •
Missing some Tweet in this thread? You can try to
force a refresh