Jeff Gilchrist Profile picture
May 22, 2024 34 tweets 8 min read Read on X
Novavax JN.1 Vaccine Neutralization

Novavax revealed they had selected the original JN.1 variant as their fall booster and recently released neutralization results on non-human primates (Macaques) including a more recent KP.2 FLiRT variant. 🧵1/
Graph of JN.1 vaccine neutralizing response against JN.1 and JN.1 subvariants in non-human primates (macaques)
Graph of Novavax JN.1 Vaccine Neutralization Dose Schedule
Recall that the JN.1 variant became dominant in many parts of the world in December 2023 so by the time the fall 2024 vaccine program rolls out it will be almost a year old. 2/
Lets look more closely at the neutralization results that Novavax did provide in slide 14 of their investor presentation on May 10th ( ). 3/novavax.widen.net/s/gvwfqkhbhm/2…
The graph shows pseudovirus neutralization pre-boost on day 357 for JN.1 around 128 pVN50 and KP.2 at 181 pVN50. Then post-boost on Day 371 for JN.1 of around 5,132 pVN50 and KP.2 around 2,660 pVN50. 4/ Graph of JN.1 vaccine neutralizing response against JN.1 and JN.1 subvariants in non-human primates (macaques)
There are several things that people need to understand about this graph and results. First, these are not results for humans but non-human primate Macaques so may be different in humans. 5/
Second, you need to look at the fine print at the bottom of the slide highlighted in yellow. There is a typo in the fine print and JB.1 should actually be JN.1. 6/ Graph of JN.1 vaccine neutralizing response against JN.1 and JN.1 subvariants in non-human primates (macaques)
Also it is important to understand the vaccine history of these macaques and you can see they already had three (3) XBB.1.5 vaccine doses on day 1, 21, and 211 while most humans have only received one XBB.1.5 vaccine dose or possibly just getting their 2nd now. 7/
Also note the macaques had a JN.1 dose on day 246 so the "Pre Boost" results are actually what you get 3.7 months after just one (1) JN.1 dose and the "Post Boost" results are the neutralization levels after the second JN.1 vaccine dose. 8/ Graph of JN.1 vaccine neutralizing response against JN.1 and JN.1 subvariants in non-human primates (macaques)
The wording they used in the slide titles are a little confusing. More accurately it should say, "Pre 2nd JN.1 Boost (D357)" and "Post 2nd JN.1 Boost (D371)". 9/
There was a 111 day (almost 4 month) time between the macaques getting their first JN.1 dose and them measuring neutralization levels for the first graph, and then 14 days (2 weeks) later measuring neutralization levels again after the second JN.1 dose. 10/
I have created my own graph to make it easier to see and understand the timeline of which vaccine doses and when. The third XBB.1.5 dose was after 6.3 months and the first JN.1 dose was only a month later, and the second JN.1 dose almost 4 months after the first JN.1. 11/ Graph of Novavax JN.1 Vaccine Neutralization Dose Schedule
How do the neutralization levels in macaques compare to last year's XBB.1.5 booster and to the original COVID variant ( )? 12/nature.com/articles/s4159…
pVN50 Neutralization Levels

16,384 = Original Variant [2x original + 1x XBB.1.5]
5,132 = JN.1 [3x XBB.1.5 + 2x JN.1]
2,660 = KP.2 [3x XBB.1.5 + 2x JN.1]
1,448 = BA.5 [2x original + 1x XBB.1.5]

13/ Humoral Responses Following XBB.1.5 Booster in Rhesus Macaques. Pseudovirus neutralization titers in rhesus macaques boosted with XBB.1.5 approximately 8 months after Prototype rS (top graph). Image from: https://www.nature.com/articles/s41598-023-46025-y
1,448 = XBB.1.5 [2x original + 1x XBB.1.5]
182 = KP.2 [3x XBB.1.5 + 1x JN.1]
128 = JN.1 [3x XBB.1.5 + 1x JN.1]

14/
Neutralization levels are much lower with newer variants than the original variant and these macaques needed two JN.1 doses to get significantly higher neutralization than with just 1 dose. 15/
It would be much more helpful to see what the neutralization levels were using a combination of vaccines that the general population actually had access to like if they took last year's results of 2x original and 1x XBB.1.5 and then added 1x JN.1 vaccine dose. 16/
Even 3x original and 1x XBB.1.5 and 1x JN.1 vaccine are all reasonable combinations for people to have received. 17/
Our immune systems when exposed to newer variants seems to continue using the original (or first exposure) as a baseline and will create antibodies that cross-react with the original and the new variant (parts that are still common between the two). 18/
That means the new antibodies are not as good of a match as they would have been if they were designed solely for the new variant and neutralization levels are thus lower. 19/
You can read more about immune imprinting here ( ) and ( ) and ( ). 20/cell.com/immunity/fullt…
cell.com/immunity/abstr…
nature.com/articles/s4158…
It is also important to note that antibody neutralization is just one aspect of the immune system and does not provide the entire picture of how well someone will do when exposed to a virus. 21/
The WHO announced their recommendation for the fall 2024 COVID variant to be something in the JN.1 lineage with a special note about taking into account certain mutations like FLiRT which were rapidly increasing globally. 22/
Shortly after, the US VRBPAC meeting to choose a COVID variant for their fall booster program was postponed until June, many thinking this was to provide more time better understand the impact of these new mutations. 23/
It will be interesting to see if VRBPAC recommends something newer and more specific than JN.1 and if Novavax will be required to change the content of their fall 2024 vaccine. 24/
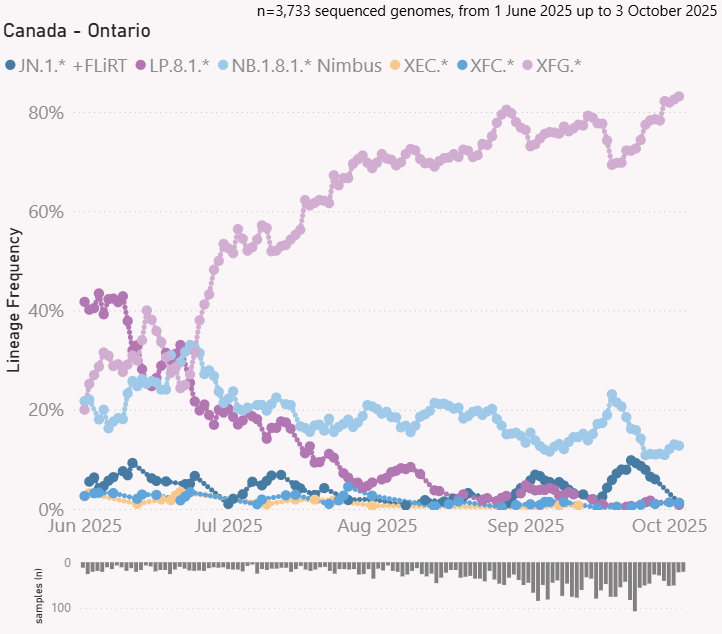
One of the variants that was not tested by Novavax is the even more immune evasive KP.3 variant which has an important Q493E mutation ( ). 25/
KP.3 is currently the most prevalent variant here in Canada and growing quickly in many other countries like Australia, Japan, New Zealand, Spain, and the UK. Visualization by @Mike_Honey_ 26/ Graph of countries where KP.3 variant is growing quickly. Visualization tool was created by @Mike_Honey_ ( https://app.powerbi.com/view?r=eyJrIjoiNzE5YzczODItMDQzMS00M2EzLWFjNWYtMjg3OTY3NTNhZDM3IiwidCI6ImRjMWYwNGY1LWMxZTUtNDQyOS1hODEyLTU3OTNiZTQ1YmY5ZCIsImMiOjEwfQ%3D%3D
There are also LP.1.* and JN.1.50 variants that are growing quickly that we should keep our eyes on. COVID has not stopped mutating and has been continually evolving to evade immunity generated by previous variants. 27/
It may be better to look at where the virus is going and not what it did almost a year ago. 28/
@threadreaderapp please unroll
Some people do not realize the original graph is in log scale so I created a linear one easier to see. The neutralization increase was actually 2.7x lower for KP.2 than JN.1 after the second JN.1 dose and the absolute neutralization of KP.2 was almost half that of JN.1. 29/
Redesigned Graph of Novavax JN.1 Vaccine relative Neutralization results in linear scale so you can more easily see how well the different variants compare. Data from ( https://novavax.widen.net/s/gvwfqkhbhm/2024-q1-earnings-presentation ).
Graph of JN.1 vaccine neutralizing response against JN.1 and JN.1 subvariants in non-human primates (macaques)
Correction that should be LB.1.* we should be keeping an eye on and not LP.1. 30/
Things are getting a bit more complicated. Novavax presented at the FDA VRBPAC meeting and still using ambiguous wording for their dose schedule but someone asked them directly what the dose schedule was ( ). 31/youtube.com/live/weaKQiFk_…
Dr. Walker stated it was 2 doses of XBB.1.5 a month apart, then 1 dose of XBB.1.5 at month 6 and 1 dose of JN.1 at month 11. So it may be that you don't need two doses of JN.1 to get those post-boost neutralization levels. 32/
That means there were two typos in the investor slides which said JB.1 (which I confirmed they meant JN.1) but also day 246 would have to be wrong as well if the JN.1 boost was actually at 11 months. It would be much easier if there as a pre-print showing all the details. 33/ Graph of JN.1 vaccine neutralizing response against JN.1 and JN.1 subvariants in non-human primates (macaques)

• • •

Missing some Tweet in this thread? You can try to force a refresh
 

Keep Current with Jeff Gilchrist

Jeff Gilchrist Profile picture

Stay in touch and get notified when new unrolls are available from this author!

Read all threads

This Thread may be Removed Anytime!

PDF

Twitter may remove this content at anytime! Save it as PDF for later use!

Try unrolling a thread yourself!

how to unroll video
  1. Follow @ThreadReaderApp to mention us!

  2. From a Twitter thread mention us with a keyword "unroll"
@threadreaderapp unroll

Practice here first or read more on our help page!

More from @jeffgilchrist

Feb 10
#Ottawa, #Ontario, #Canada Virus Update:

You can see in the graph, COVID makes up the majority of new hospitalizations due to #Flu, #RSV or #COVID throughout the year, and even stays ahead during winter respiratory virus season. 🧵1/ A line graph displaying the percentage of patients hospitalized due to COVID-19, Influenza, or RSV over time, from September 1, 2023, to January 26, 2025. The x-axis represents weeks within this period, and the y-axis shows percentages from 0% to 100%. The graph has three colored lines: blue for COVID-19, purple for Influenza, and teal for RSV. The graph shows fluctuations in the percentage of hospitalizations due to each cause over time, with COVID-19 consistently having the highest percentage, followed by Influenza and RSV.
New hospitalizations are increasing again. This last update was the first time Flu hospitalizations (42) were significantly higher than COVID (34) in the same week with RSV at 14 people. 2/ The bar chart shows the number of new hospitalizations per week in Ottawa from August 27, 2023, to January 26, 2025. The y-axis represents the number of patients, ranging from 0 to 100. The x-axis represents the weeks. The bars are color-coded: blue for COVID-19, purple for Influenza, and teal for RSV. The chart shows fluctuations in hospitalizations over time, with notable peaks around December 2023 and January 2025.
In Ottawa, test positivity for Flu A (bright green) has really increased, COVID is still in second place, but seasonal human coronavirus is almost the same level, followed by Entero/Rhinovirus, and then RSV for the top 5. 3/ A stacked area chart displaying the percentage of positive tests for various viruses over time, from October 1, 2022, to January 26, 2025. The x-axis represents weeks within this period, while the y-axis represents the percentage, cumulatively stacked to 100%. The chart features the following viruses, each depicted in a distinct color: COVID-19 (red), Entero/Rhinovirus (yellow), Seasonal human coronavirus (purple), RSV (green), Parainfluenza (all types) (blue), Influenza B (dark purple), Influenza A (light green), Human metapneumovirus (pink), and Adenovirus (dark blue). The data shows fluc...
Read 6 tweets
Jan 20
Similar to #Canada, babies in the #UK are at higher risk for #hospitalization and #ICU admission from #COVID. Their data looks deeper at infants < 6 months old which have higher ER attendance, hospital admission and severe hospitalisation rates than the oldest adults 90+! 🧵1/
That data from the UK was taken from this pre-print study ( ). 2/medrxiv.org/content/10.110…
In Canada, babies < 1 years old had the highest ICU admission rates of all age groups from Aug. 27, 2023 to Aug. 24, 2024. Read on to see more details including Flu and RSV too ( ). 3/
Read 7 tweets
Jan 19
The @elastomaskpro () is a NIOSH approved reusable N95 elastomeric respirator. It is made of silicone so a higher chance it will fit and seal well and is super breathable at the same time. Read on to find out more about my experience with it. 🧵1/ elastomaskpro.comA blue respirator mask, called ElastoMaskPro, rests on top of a blue and white box. The mask has a smooth, curved design with two circular filters on each side. The mask's straps are neatly arranged.
A light blue ElastoMaskPro N95 reusable respirator mask with a soft, flexible facepiece rests on top of its packaging box. The mask features a large opening in the center, showcasing white pleated filters. Two elastic straps are attached to the mask for securing it to the face.
Full disclosure: ElastoMaskPro sent me a unit to evaluate. There were no strings attached, they just asked that I provided feedback after I tried it. This thread is the first time they are seeing my feedback, they did not review anything before it being posted here. 2/
The ElastoMaskPro is very cost effective at the current sale price of $29.99 which includes two N95 filtering pucks. You can continue using the filters until they either get too dirty or there is increased breathing resistance. 3/ ElastoMaskPro Filter Puck. Filter Pucks are constructed using an adhesive-free process that incorporates a large volume of long-lasting, highly durable mechanical filtration media.
Read 43 tweets
Jan 6
#Ottawa, #Ontario, #Canada Virus Update:

Ottawa updated its #respiratory #virus data again after a break for the holidays, respiratory related ED visits are up especially in kids 0-3, then 4-11 and age 80+. 🧵1/ A line graph showing the number of respiratory-related emergency department (ED) visits per 100,000 population by week, from September 1, 2023, to November 1, 2024, across different age groups. Six lines represent the age groups: Age 0-3 (purple), Age 4-11 (blue), Age 12-17 (green), Age 18-54 (yellow), Age 55-79 (red), and Age 80+ (orange). The Age 0-3 group shows the highest number of visits, peaking around 1000 visits per 100,000 population, while other age groups generally have rates below 250 visits per 100,000 population. The graph exhibits seasonal fluctuations, with peaks in the wint...
Quite a mixture of different viruses testing positive in the lab right now so people can pick up a variety of bugs in the air. 2/ A stacked area chart displaying the percentage of positive tests for various viruses over time, from October 1, 2022, to December 22, 2024. The x-axis represents weeks within this period, while the y-axis represents the percentage, cumulatively stacked to 100%. The chart features the following viruses, each depicted in a distinct color: COVID-19 (red), Entero/Rhinovirus (yellow), Seasonal human coronavirus (blue), RSV (green), Parainfluenza (purple), Influenza B (light blue), Influenza A (light green), Human metapneumovirus (pink), and Adenovirus (dark blue). COVID-19 maintains a high posit...
New hospitalizations also jumped a lot in the last two reporting weeks, not just due to #RSV but a big spike in #COVID as well.

Follow the latest updates here ( ). 3/ covid.gilchrist.ca/Ottawa.htmlThe bar chart shows the number of new hospitalizations per week in Ottawa from August 27, 2023, to December 22, 2024. The y-axis represents the number of patients, ranging from 0 to 100. The x-axis represents the weeks. The bars are color-coded: blue for COVID-19, purple for Influenza, and teal for RSV. The chart shows fluctuations in hospitalizations, with peaks around late 2023 and early 2024, and another peak towards the end of 2024.
A line graph displaying the percentage of patients hospitalized due to COVID-19, Influenza, or RSV over time, from September 1, 2023, to December 22, 2024. The x-axis represents weeks within this period, and the y-axis shows percentages from 0% to 100%. The graph has three colored lines: blue for COVID-19, purple for Influenza, and teal for RSV. COVID-19 consistently shows the highest percentage of hospitalizations, with fluctuations throughout the period.
Read 4 tweets
Dec 24, 2024
#Variant update for #Ontario, #Canada (to Dec 10, 2024)

The KP.3.1.1 #DeFLuQE variant has finally been surpassed with XEC now in top place above 20% while the other 5 (MC.* and XEC.* descendants) remain < 7%. Graph tools by @Mike_Honey_ 🧵1/ A line graph showing the lineage frequency of the top 7 COVID-19 genomes in Ontario, Canada, up to December 10, 2024. The graph includes data from 4,928 sequenced genomes. The x-axis represents dates from October 27 to December 08, while the y-axis represents lineage frequency percentages from 0% to 35%. Different colored lines represent different genome lineages: KP.3.1.1 (blue), MC.1 (green), MC.13 (purple), MC.16 (pink), MC.24 (orange), XEC (brown), and XEC.8 (yellow). Below the main graph, there is a bar chart showing the number of samples (n) collected each day, ranging from 0 to 200 s...
XEC is a combination of KP.3.3 and KS.1.1 that recombined together. MC.1 is a direct descendant of KP.3.1.1 with one spike mutation at T571I. To learn more about how variant naming works, you can read this article I wrote with @paulseaman31 ( ). 2/docs.google.com/document/d/1q0…
This Sankey graph shows the proportion of variants from PCR test genomic sequencing in Ontario since October 27, 2024. You can follow the lineage backwards to see where a variant is a descendant from. 3/ The Sankey diagram visually displays the evolution and distribution of sequenced genomes in Ontario, Canada, up to December 10, 2024. The diagram uses colored bars and curved lines to show the flow and relationships between different genome variants over time. Each variant is labeled, such as "XEC," "BA.2," "BA.2.86," "JN.1," "KP.3," and various sub-variants. These bars and lines illustrate the transitions and derivations from one variant to another. The total number of sequenced genomes depicted is 4,928. This visualization helps to underst...
Read 16 tweets
Dec 22, 2024
Population rate vs raw numbers

This is a good example of why it is useful to understand the importance of population *rate* and not just look at raw numbers. The first graph shows raw numbers and the second graph population rate. 🧵1/ #ED #Respiratory #Virus #Population #Ottawa Chart of Respiratory Related ED Visits by Week and Age (Ottawa, ON, Canada) with raw numbers
Chart of Respiratory Related ED Visits by Week and Age (Ottawa, ON, Canada) with population rate per 100K
Ottawa Public Health makes only the raw data available for All causes and respiratory-related emergency department visits to Ottawa hospitals by age group and week ( ). 2/open.ottawa.ca/datasets/ottaw…
If I take the data and plot all the ages together, you can at least see all of the age groups at the same time but it is just the raw numbers. 3/
Read 12 tweets

Did Thread Reader help you today?

Support us! We are indie developers!


This site is made by just two indie developers on a laptop doing marketing, support and development! Read more about the story.

Become a Premium Member ($3/month or $30/year) and get exclusive features!

Become Premium

Don't want to be a Premium member but still want to support us?

Make a small donation by buying us coffee ($5) or help with server cost ($10)

Donate via Paypal

Or Donate anonymously using crypto!

Ethereum

0xfe58350B80634f60Fa6Dc149a72b4DFbc17D341E copy

Bitcoin

3ATGMxNzCUFzxpMCHL5sWSt4DVtS8UqXpi copy

Thank you for your support!

Follow Us!

:(