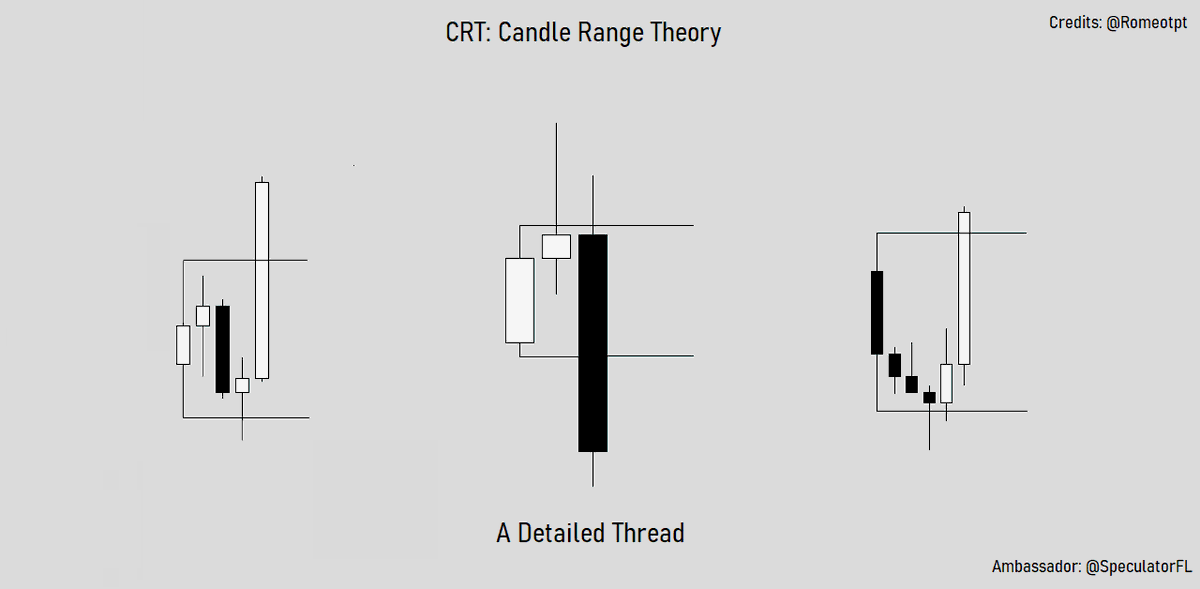
How to Select a CRT Correctly.
Protocols and Methods Fully Explained.
Thread:🧵
Protocols and Methods Fully Explained.
Thread:🧵

This thread will explain everything about selecting a CRT correctly. You won't have any doubts left after reading through it.
Make sure to pay attention to every single detail and don't miss out on anything.
Make sure to pay attention to every single detail and don't miss out on anything.

Selecting a CRT Correctly:
There are two types of CRTs and two methods for selecting your CRT correctly:
- One of them is Advanced CRT
- The other is Conformational CRT
Both of them have their own distinct characteristics and follow a specific framework for selection.
There are two types of CRTs and two methods for selecting your CRT correctly:
- One of them is Advanced CRT
- The other is Conformational CRT
Both of them have their own distinct characteristics and follow a specific framework for selection.

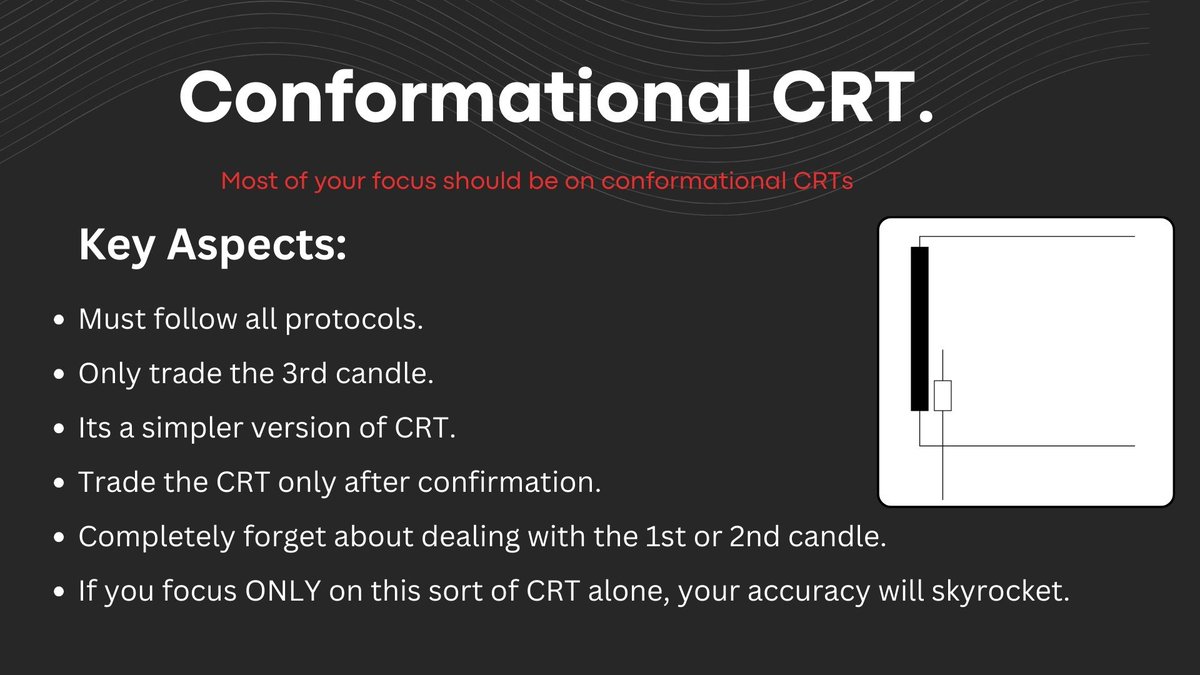
Characteristics of Conformational CRT:
- It requires confirmation before trading.
- It has greater accuracy due to the confirmation factor.
- With this method, you only trade the 3rd candle.
- You do not trade the 2nd candle but wait for the 3rd candle.
- More characteristics are shown in the attached picture.
- It requires confirmation before trading.
- It has greater accuracy due to the confirmation factor.
- With this method, you only trade the 3rd candle.
- You do not trade the 2nd candle but wait for the 3rd candle.
- More characteristics are shown in the attached picture.
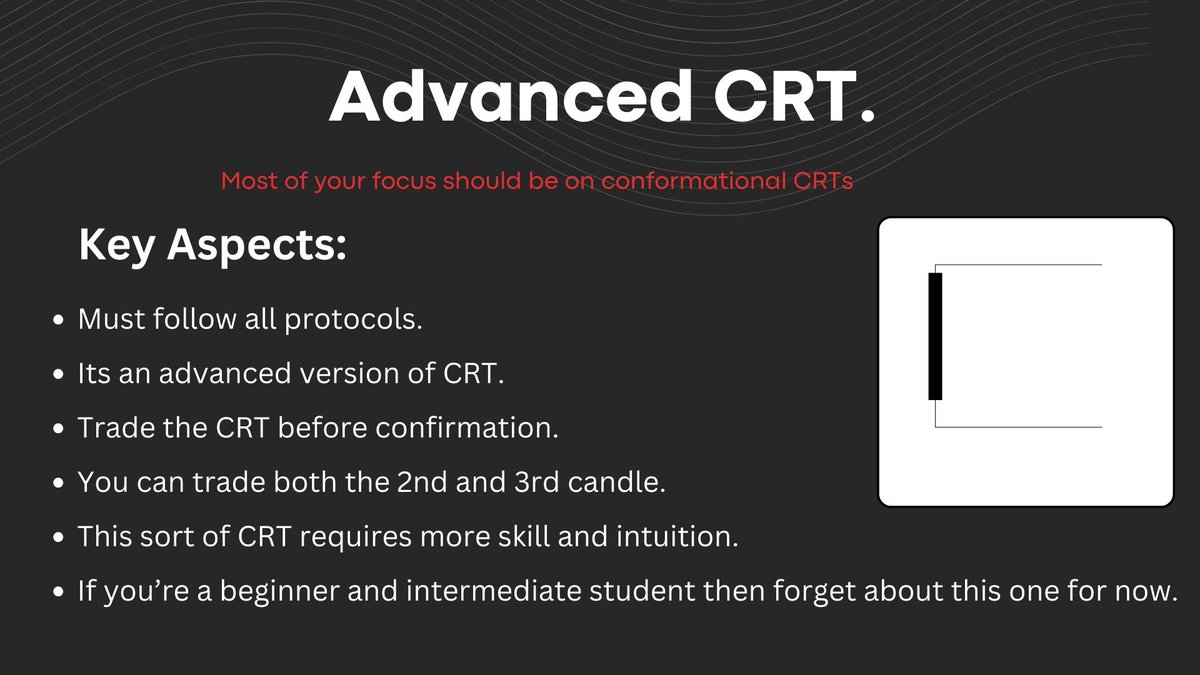
Characteristics of Advanced CRT:
- It's a much more advanced version and requires more intuition, chart time, and experience to trade.
- You trade it without confirmation.
- This is for advanced students rather than beginners or intermediates.
- You trade both the 2nd and 3rd candles.
- More details are in the attached picture.
- It's a much more advanced version and requires more intuition, chart time, and experience to trade.
- You trade it without confirmation.
- This is for advanced students rather than beginners or intermediates.
- You trade both the 2nd and 3rd candles.
- More details are in the attached picture.
If you prefer learning through video and audio formats, then this video is for you:
Link:
Go through this video in complete detail. I've explained everything in further detail and provided multiple examples.
Link:
Go through this video in complete detail. I've explained everything in further detail and provided multiple examples.
This thread will predominantly focus on Conformation CRT.
I understand that most of you are either beginners, intermediate, or semi-advanced students. That's why your focus should be on this Conformation CRT rather than the other one.
If you concentrate on this method alone, it will significantly increase your profitability and is more than enough to make you consistently profitable.

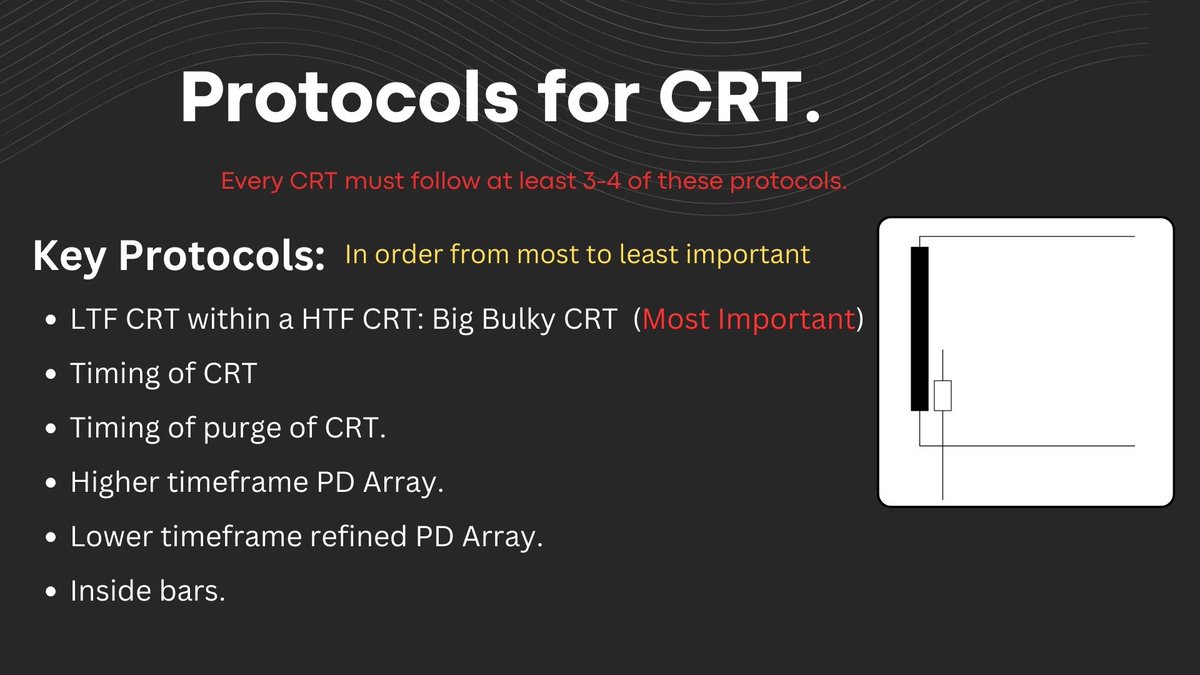
Protocols for CRT:
- PD Array
- LTF CRT within a HTF CRT
- Timing of CRT
- Timing of the purge of CRT
- Inside bars.
- PD Array
- LTF CRT within a HTF CRT
- Timing of CRT
- Timing of the purge of CRT
- Inside bars.
Timeframe Alignments:
It's one of the most important concepts when it comes to selecting CRT and trading it. You must have a good grasp of timeframe alignment before you can accurately trade CRT with higher precision.
Here are some examples.
It's one of the most important concepts when it comes to selecting CRT and trading it. You must have a good grasp of timeframe alignment before you can accurately trade CRT with higher precision.
Here are some examples.

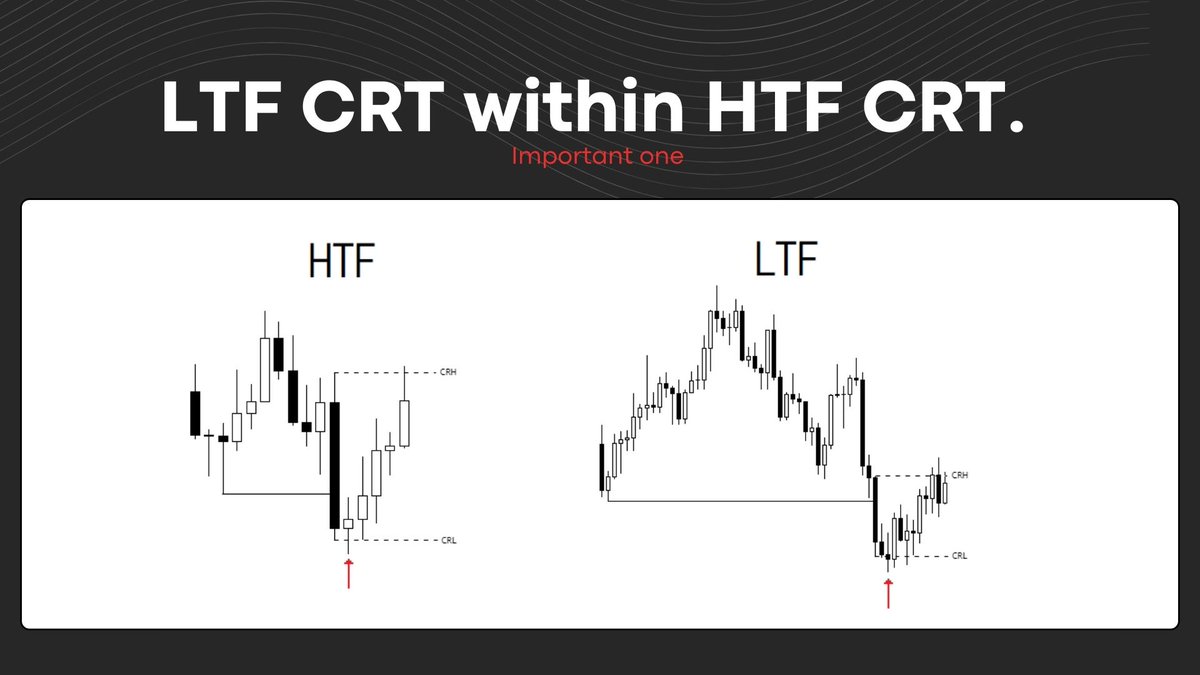
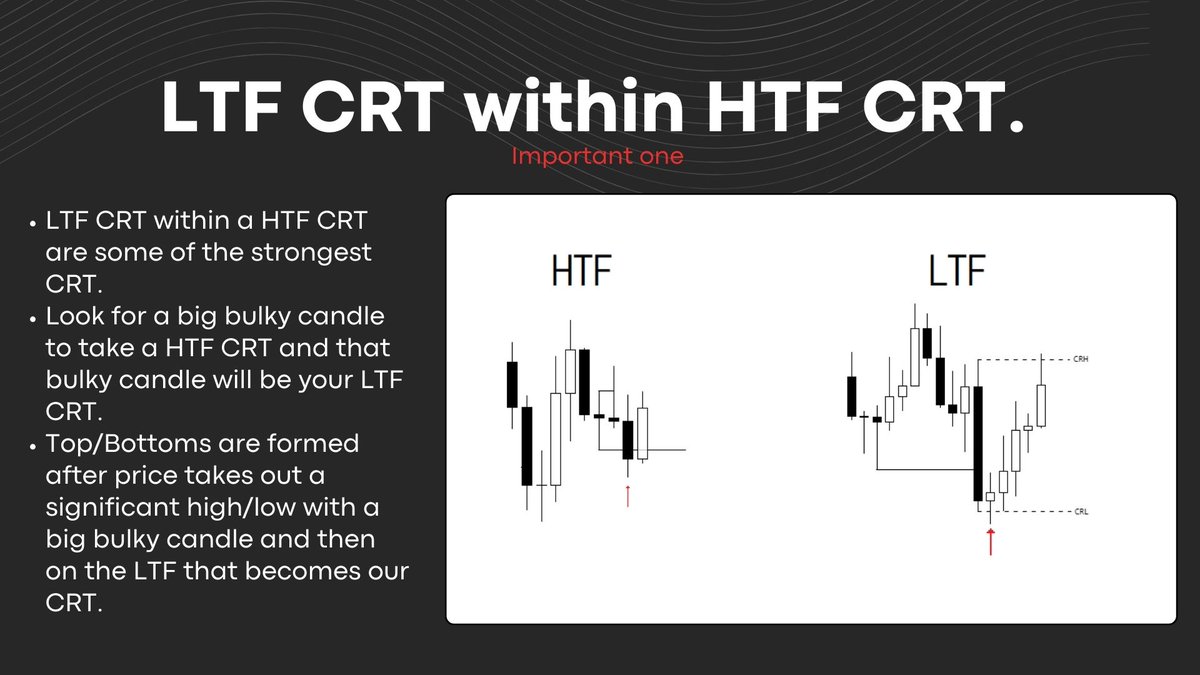
LTF CRT within a HTF CRT:
This is one of the significant protocols when it comes to selecting CRT.
In this approach, you use a top-down approach and top-down analysis to look for CRT on the higher timeframe (HTF), and then refine them on the lower timeframe (LTF).
These kinds of CRT always work like a charm.
You wait for a big bulky candle on the LTF to confirm a HTF CRT, and then that candle becomes your LTF CRT, which you can trade on a further lower timeframe (LTF) using timeframe alignment.
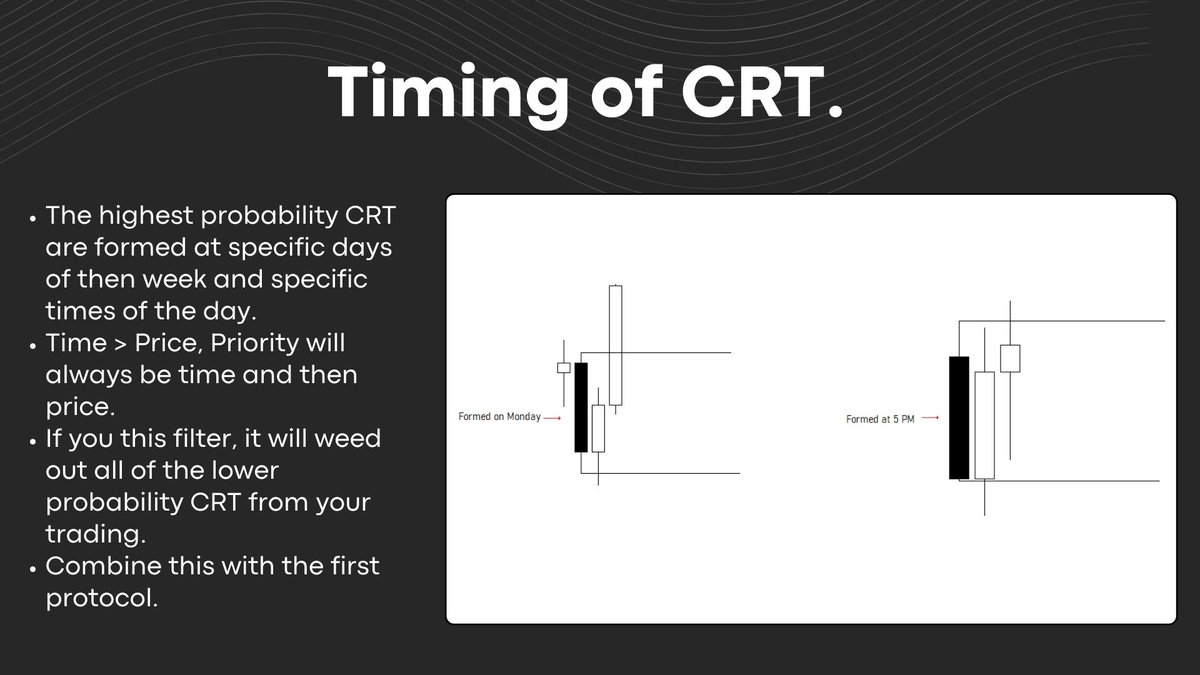
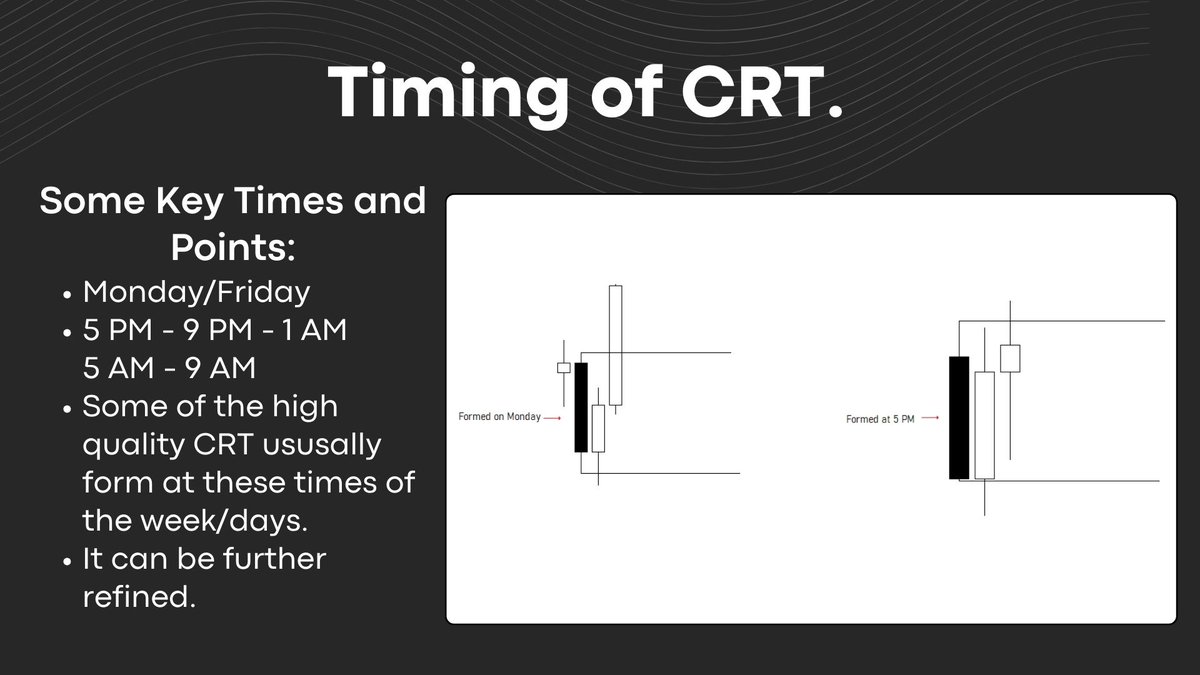
Timing of CRT:
One of the most important aspects you should consider when selecting CRT is the timing of their formation. It's crucial to not just focus on random CRTs formed at random times. There are key times that you should use to find the most accurate CRT.
This timing acts as a filter to weed out all the less accurate and invalid CRTs.
Timing of Purge of CRT:
We not only look at the timing of CRT formation but also the timing of the purge of CRT. We carefully consider when the purge of the CRT occurs, and this adds to our time alignment analysis. It acts as another filter in selecting CRT correctly.
We not only look at the timing of CRT formation but also the timing of the purge of CRT. We carefully consider when the purge of the CRT occurs, and this adds to our time alignment analysis. It acts as another filter in selecting CRT correctly.
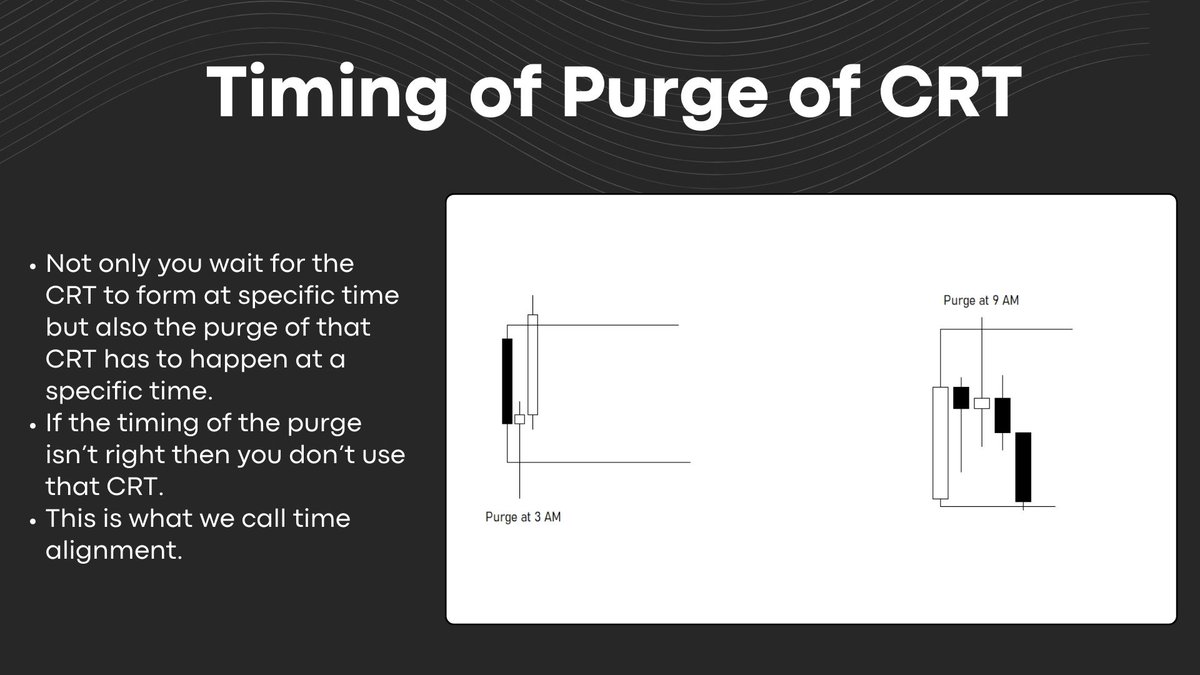
Time Alignment:
Time alignment involves aligning the timing of CRT and the timing of the purge of CRT. That's what we call time alignment.
It's different from timeframe alignment because in timeframe alignment, we align different timeframes with each other, but in this case, we align different times with each other.
There are different time alignments for the purges of CRT and the timing of the CRT, and when both of them align with each other, it always leads to the most accurate CRT.

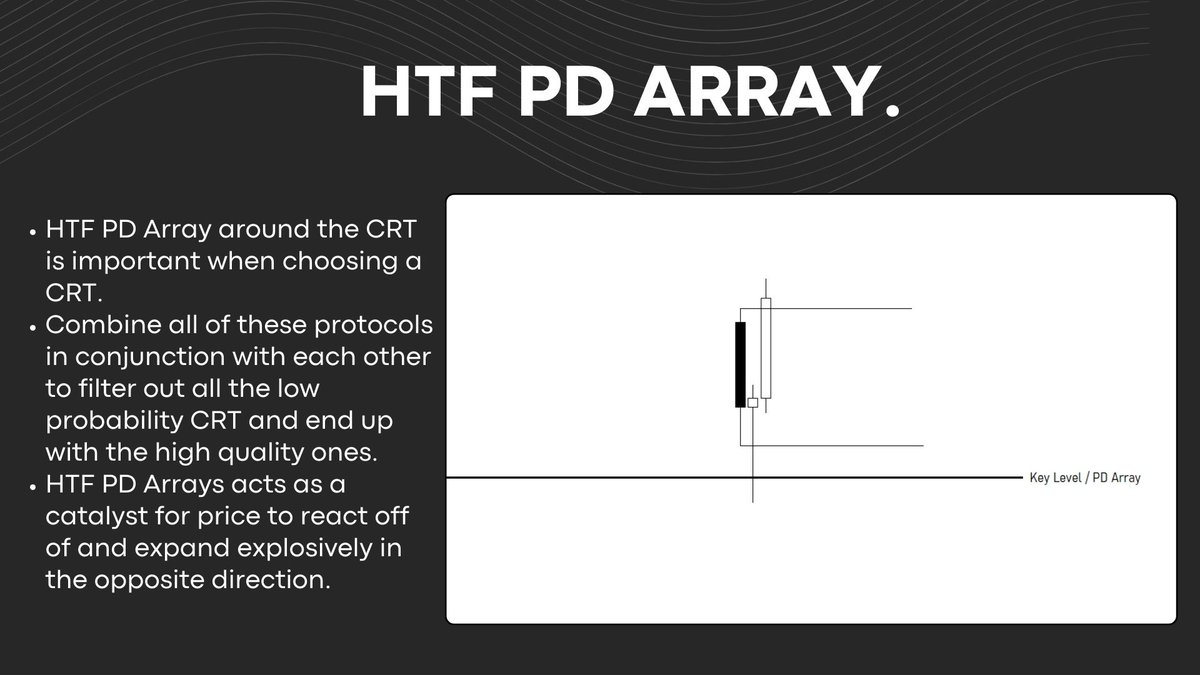
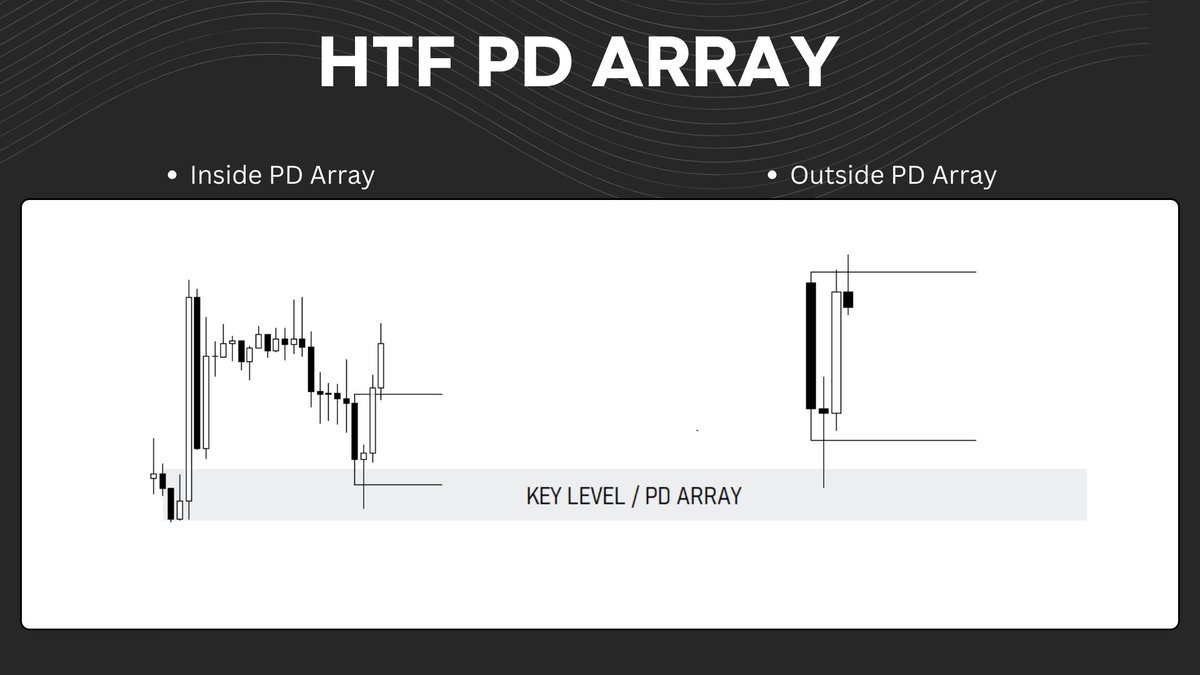
HTF PD Array:
This is also one of the biggest factors you should consider when selecting CRT correctly.
HTF PD array essentially acts as a catalyst for expansion. When one side of the CRT is purged and price tests a PD array, some of the most explosive expansions occur after price tests an indicative PD array.
There must be an HTF PD array around CRT to be considered correct and valid.
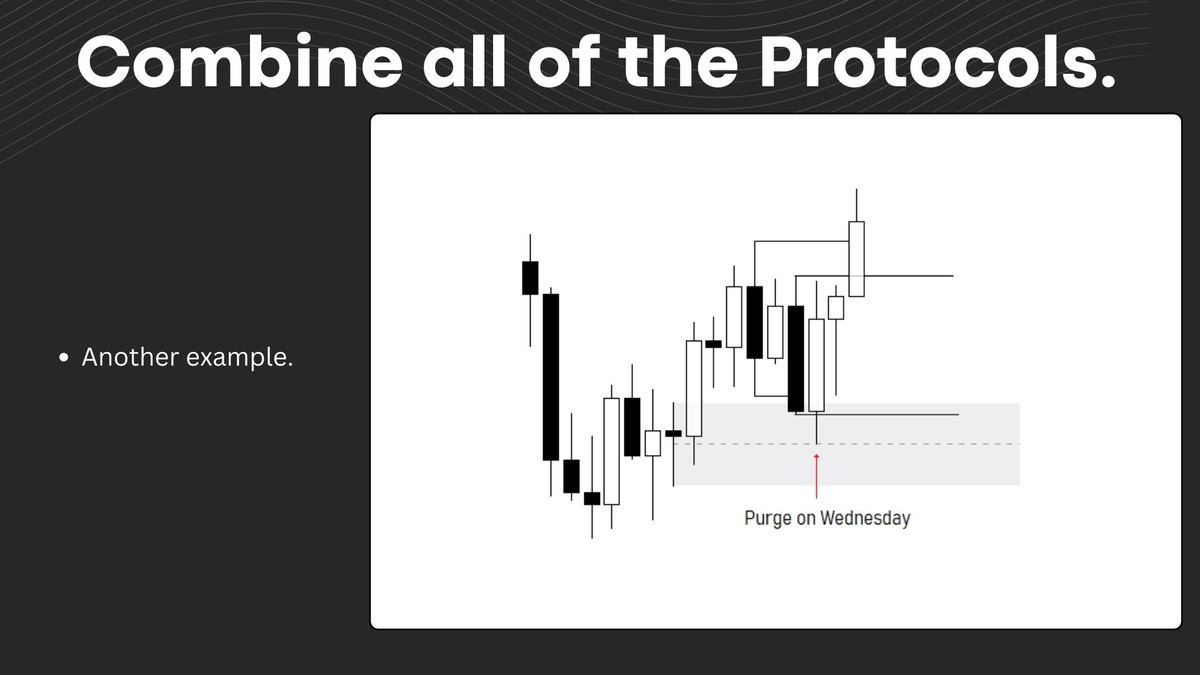
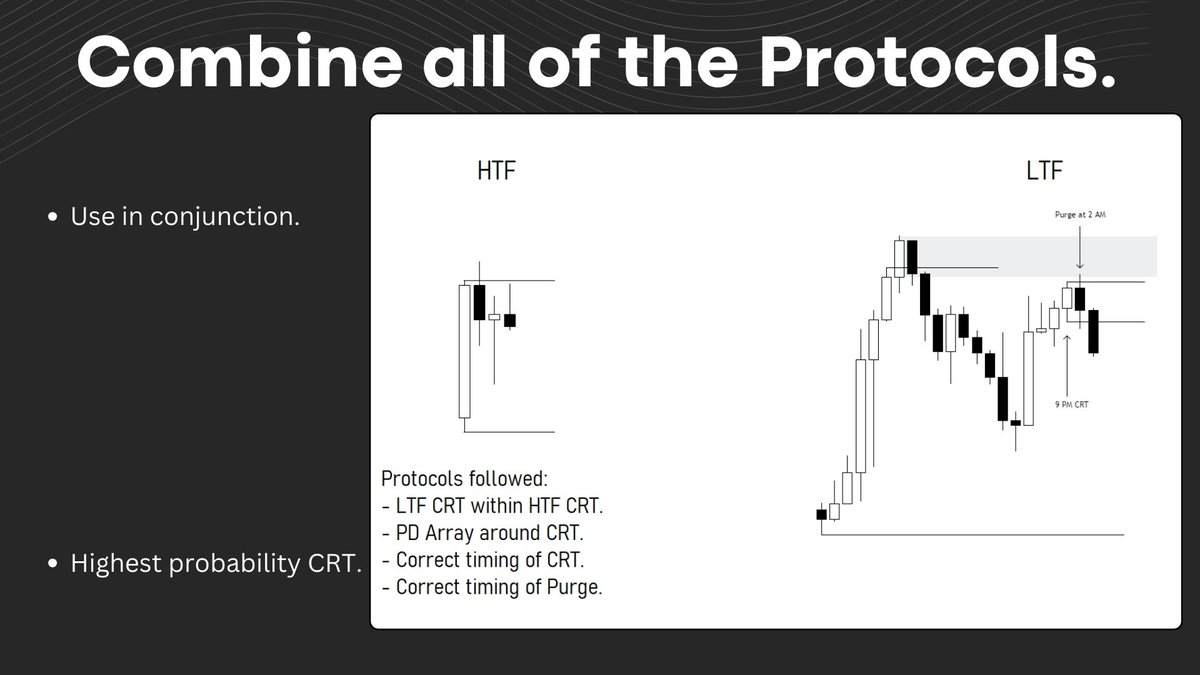
Combining All Protocols:
The best way to find the highest quality CRT is by using these protocols together in conjunction. This comprehensive approach ensures that you end up with the best CRT.
You don't just use them alone; a high-quality CRT follows at least 3-4 protocols to be considered correct. This integrated method ensures a thorough analysis and increases the probability of identifying accurate CRTs.
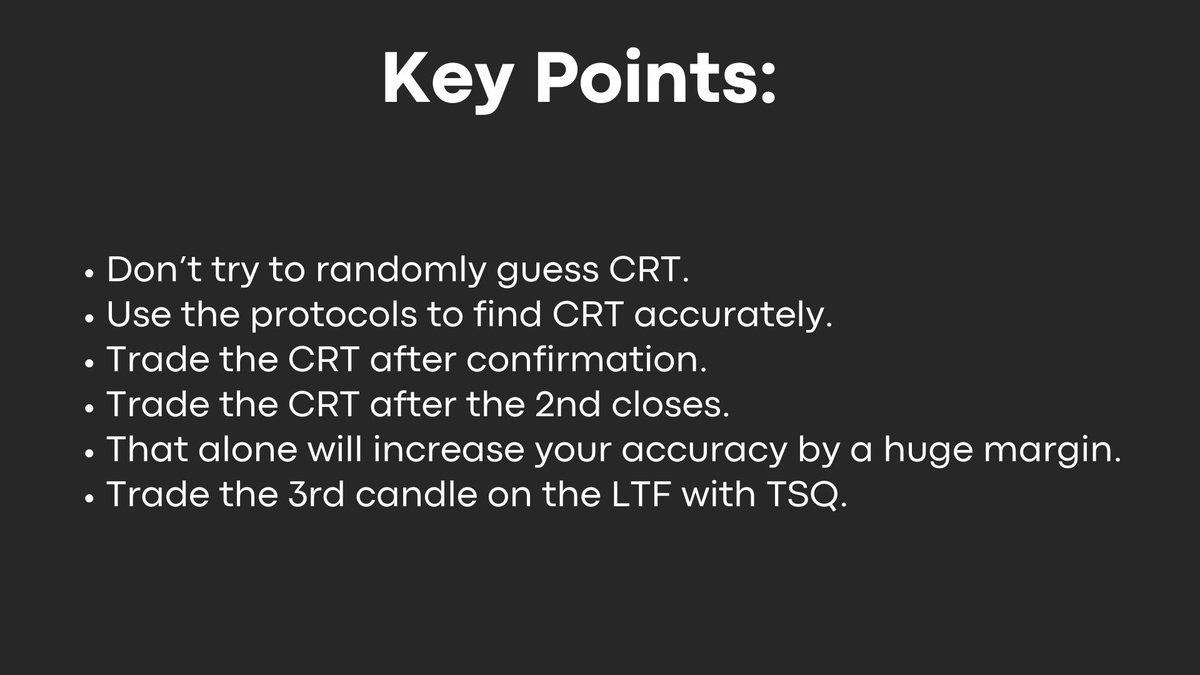
Key Points:
- Use all of these protocols in a logical manner in conjunction with each other.
- Avoid randomly guessing CRT but rely on these protocols for a structured approach.
- To find conformational CRT, wait for the second candle to close, and then trade - the 3rd candle after the 2nd candle confirms the CRT.
- More details are provided in the picture.
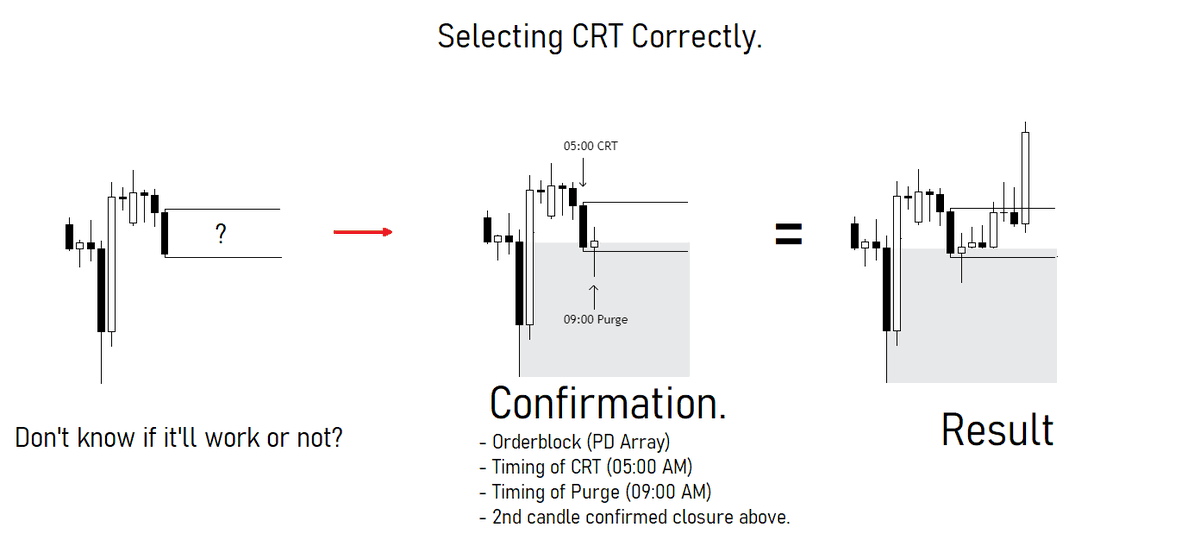
Here's a case study for you to delve deeper into and reverse engineer. By using this same approach, you can accurately find conformational CRTs with an unbelievable amount of accuracy and precision.
On the left side, you might be uncertain whether this CRT could be considered correct. To determine its validity, follow the protocols explained in this thread. Once you observe that it follows at least 3-4 protocols, wait for the 2nd candle to close. After one side of the CRT is purged and confirmed, trade the 3rd candle or the subsequent candles.
This systematic approach ensures that you can identify and trade CRTs with confidence and precision.
The thread is already quite comprehensive, covering multiple aspects of trading CRTs and hopefully addressing all your doubts. However, if you're seeking further examples and case studies to enhance your knowledge even more and reach a different level of understanding, I recommend visiting the YouTube video. In that video, I've explained numerous examples for you to grasp the knowledge and apply it in live markets.
Additionally, on that channel, I have planned many other videos, including:
- Trading CRT the Correct Way
- My Favorite CRT Model
- Backtesting CRT Sessions
- Live Trading CRT
These videos will provide additional insights and practical demonstrations to further solidify your understanding of CRT.
Additionally, on that channel, I have planned many other videos, including:
- Trading CRT the Correct Way
- My Favorite CRT Model
- Backtesting CRT Sessions
- Live Trading CRT
These videos will provide additional insights and practical demonstrations to further solidify your understanding of CRT.
• • •
Missing some Tweet in this thread? You can try to
force a refresh