In this THREAD I will explain “Elliott Wave”
1. Elliott Wave Theory
2. Basic Wave
3. Corrective Wave
4. Elliott Wave Cycle
🧵(1/8)
1. Elliott Wave Theory
2. Basic Wave
3. Corrective Wave
4. Elliott Wave Cycle
🧵(1/8)
1. Elliot Wave Theory
The Elliott Wave Theory suggests that price movements can be reasonably predicted by studying price history as the markets move in wave patterns
Like ocean waves, the movements are repetitive, rhythmic, and timely.
The Elliott Wave Theory suggests that price movements can be reasonably predicted by studying price history as the markets move in wave patterns
Like ocean waves, the movements are repetitive, rhythmic, and timely.
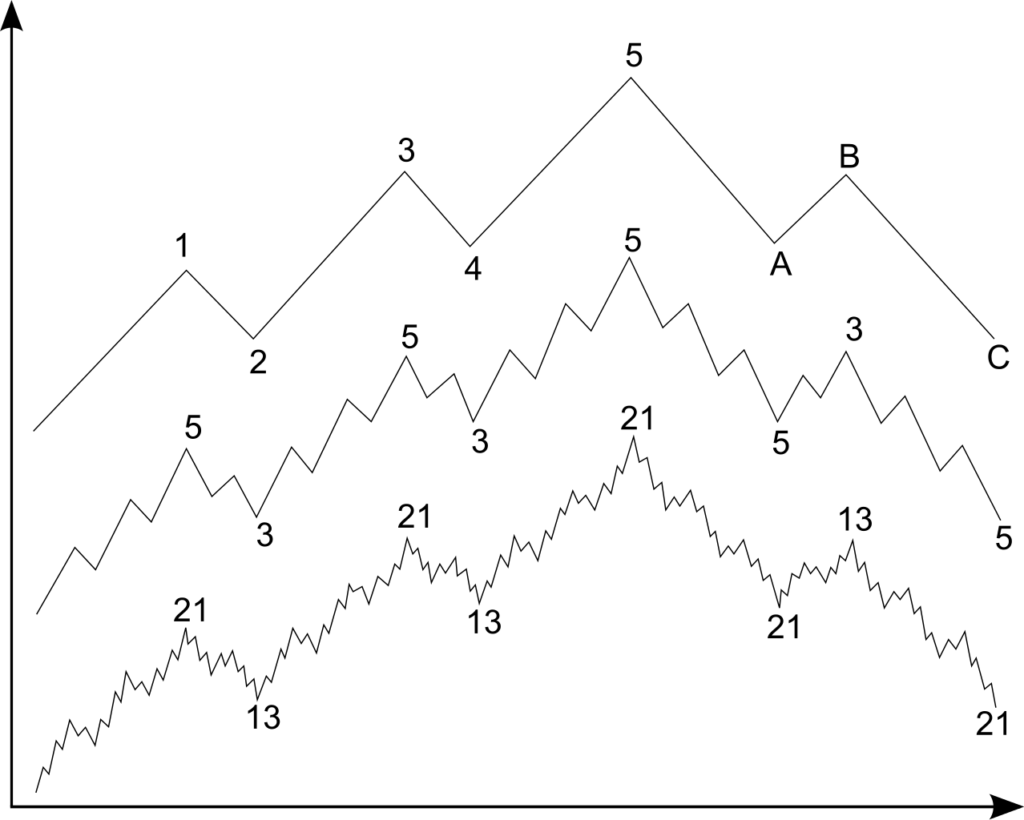
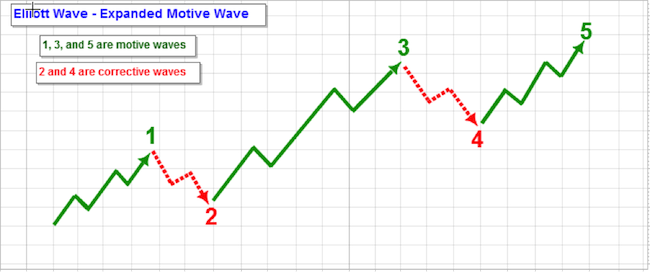
2. Basic Motive Wave
A wave that always advances in the direction of the trend of one larger degree. It's subdivided into five smaller waves.
Waves 1, 3 and 5 in the Motive Wave are called “actionary” sub-waves.
Waves 2 and 4 are called “corrective” sub-waves.
A wave that always advances in the direction of the trend of one larger degree. It's subdivided into five smaller waves.
Waves 1, 3 and 5 in the Motive Wave are called “actionary” sub-waves.
Waves 2 and 4 are called “corrective” sub-waves.
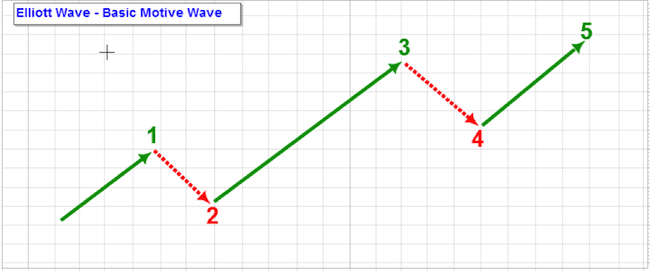
2.1 Basic Motive Wave
There are 3 rules for Motive Wave formation:
- Wave 2 always retraces (gives back) less than 100% of Wave 1
- Wave 4 always retraces less than 100% of Wave 3
- Wave 3 always travels beyond the end of Wave 1 and is never the shortest wave
There are 3 rules for Motive Wave formation:
- Wave 2 always retraces (gives back) less than 100% of Wave 1
- Wave 4 always retraces less than 100% of Wave 3
- Wave 3 always travels beyond the end of Wave 1 and is never the shortest wave
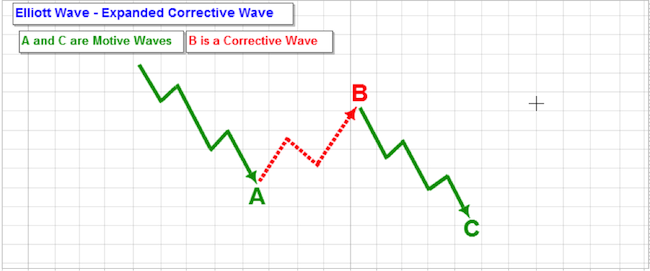
3. Corrective Wave
The three-wave structure has its sub-waves labeled as waves A, B and C.
This can be misleading since not all corrective waves are exactly three-wave structures.
The three-wave structure has its sub-waves labeled as waves A, B and C.
This can be misleading since not all corrective waves are exactly three-wave structures.

3.1 Corrective Wave
Wave A and Wave C are both in the direction of the trend
Wave B is traveling against the direction of the larger correction and will therefore be shown as having three waves
Wave A and Wave C are both in the direction of the trend
Wave B is traveling against the direction of the larger correction and will therefore be shown as having three waves
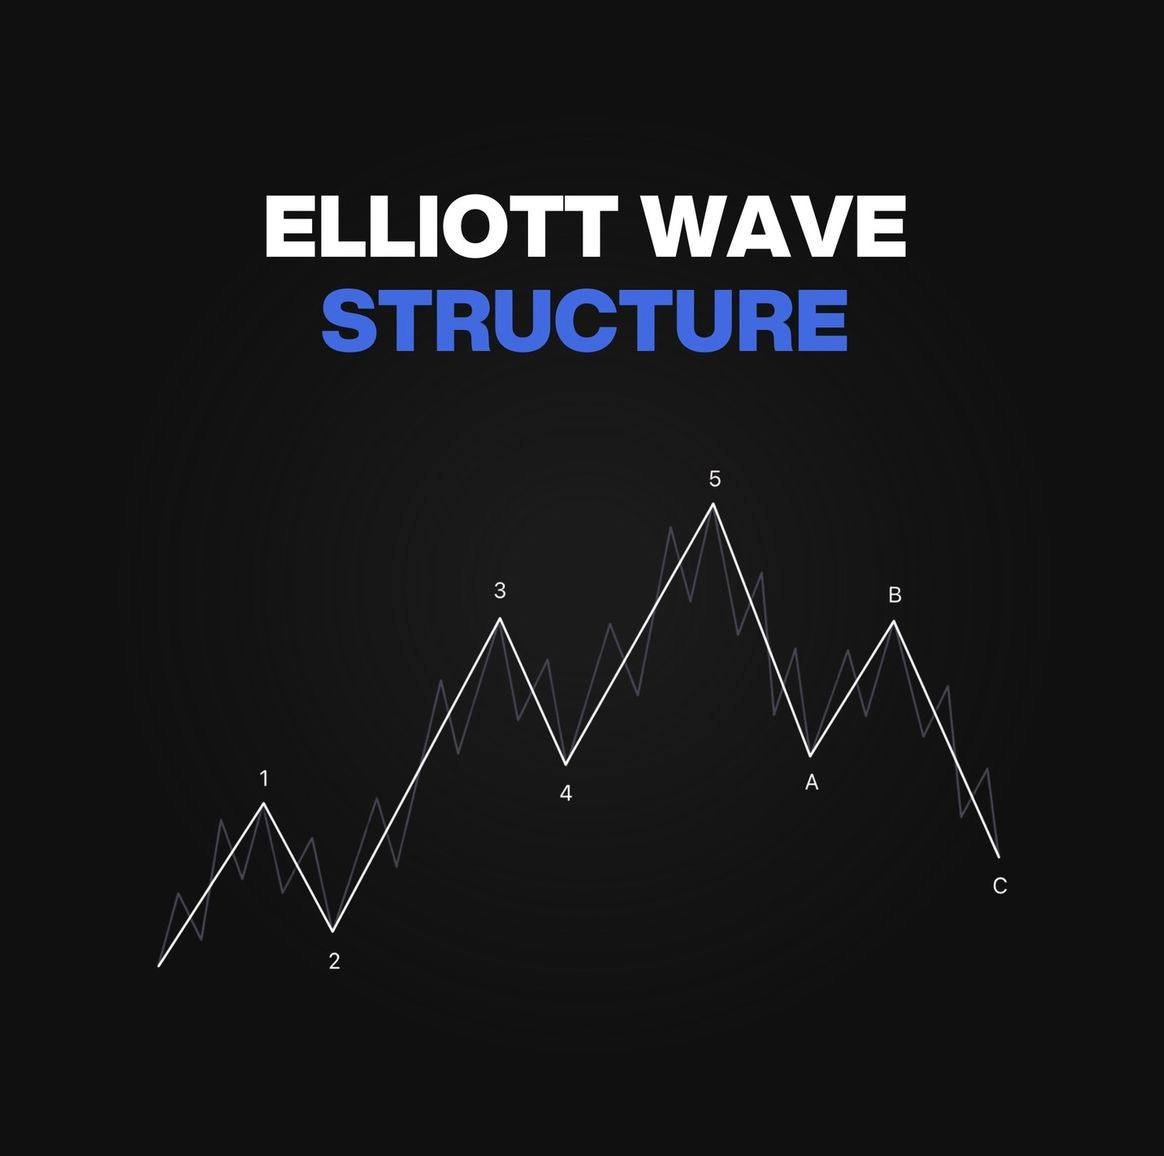
4. Elliott Wave Cycle
The combination of a motive wave and a corrective wave is the structure of the complete Elliott Wave Cycle
This is illustrated with a total of 8 waves.
There is a 5-wave in the direction of the trend, followed by a 3-wave correction against the trend
The combination of a motive wave and a corrective wave is the structure of the complete Elliott Wave Cycle
This is illustrated with a total of 8 waves.
There is a 5-wave in the direction of the trend, followed by a 3-wave correction against the trend
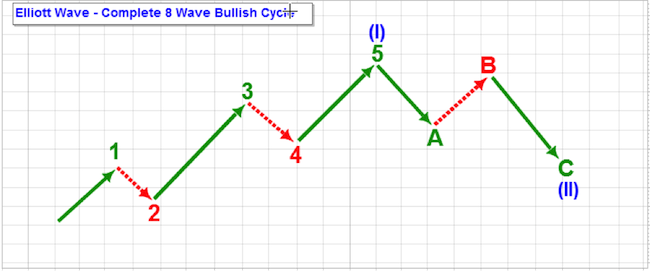
4.1 Elliott Wave Cycle
The chart above shows this eight-wave structure in a declining market.
If you saw this pattern on a chart, depending on HTF, you might expect another five waves down.
This pattern is known as "Wave Bearish Cycle"
The chart above shows this eight-wave structure in a declining market.
If you saw this pattern on a chart, depending on HTF, you might expect another five waves down.
This pattern is known as "Wave Bearish Cycle"

• • •
Missing some Tweet in this thread? You can try to
force a refresh