Crypto, Distilled Profile picture
Jun 3 16 tweets 5 min read Read on X
14 Key Lessons From @GCRClassic (pt. 2)

GCR is one of the best traders in crypto history.

> Shorted top of $DOGE & $LUNA
> Shorted top of 21' metaverse
> Bought the cycle bottom in Nov. 2022

To trade like him, you must learn from him.Image
2/ GCR's Advice For Traders:

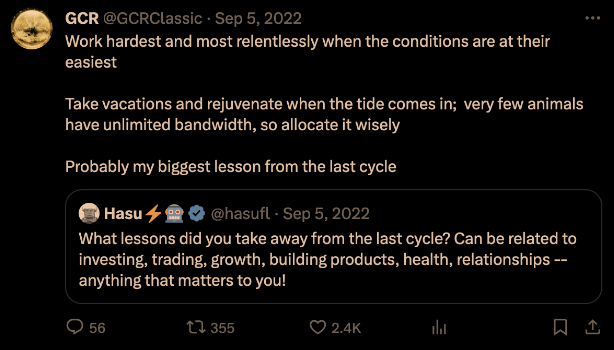
GCR is all about the grind.

His advice? Go all in when the market's on your side.

The potential gains from giving it your all during peak conditions are simply too good to pass up.Image
3/ GCR, a Contrarian At Heart:
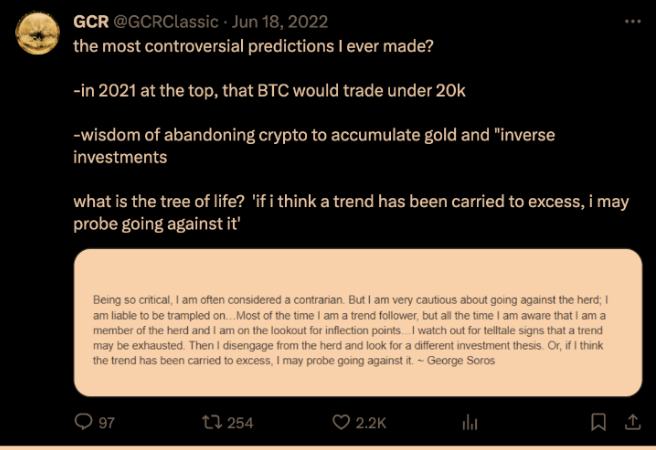
GCR's secret?

He's a contrarian at heart, often betting against the crowd.

He's inspired by George Soros, frequently citing Soros's ideas on reflexivity and contrarianism.Image
4/ News Headline Trading Tips:

GCR focuses on how markets react to headlines rather than their truth.Image
5/ Hedging in Bull Markets:

In 2021's latter half, GCR stayed active in crypto, despite his bearish outlook.

He shifted to short positions, capitalizing on liquidity exiting the market.Image
6/ Skill Diversification

GCR diversified his predictive skills across assets.

In 2021, he explored NFT speculation, favoring them over memecoins.

He viewed NFTs as a small part of his broader investment strategy.Image
7/ Coins With Weak Tokenomics:

Contrary to common belief, top-performing coins can have poor tokenomics.

Many teams launch during bear markets, waiting for better conditions to manipulate their holdings

This applies even in mini-bears within bear markets.Image
8/ Bet On Unit Bias :

Unit bias in crypto refers to preferring whole asset units.

This can lead to irrational investment decisions based solely on price, common among retail investors.Image
9/ Retail Hyped Coins:

Retail-hyped coins often trigger buying frenzies as anticipated events approach.

Investors anticipate wealth, but market makers exploit the surge to offload holdings.Image
10/ What To Do When Sidelined:

If sidelined, consider trading news instead of FOMOing into others' holdings.

News trading is competitive, so having infrastructure is crucial.Image
11/ Gaming Airdrop Patterns:

To maximize returns, capitalize on volatility at both ends, despite the market's increasing efficiency.

However, airdrops still follow predictable patterns.

GCR advises studying every event since 2018 for insights.Image
12/ Selling Points Of Round Numbers:

In reflexive assets, round numbers are powerful selling points.Image
13/ Prioritising Intuition:

GCR values intuition, the knack for picking up subtle cues even without conscious awareness.

He believes the best traders always prioritize this skill.Image
14/ Resetting Your Perspective:

Thinking about your peak net worth can cloud your judgment and emotional stability.

GCR suggests clearing your mind.

You could also regularly resetting your PNL perspective for better trading outcomes.Image
15/ Taking Profits Wisely:

Many overlook a simple truth: wealth isn't realized until it's taken.

Most lose gains by forgetting this.

Keep an eye on volume surpassing market cap.

It's a common indicator of the final stages of a parabolic move.Image
16/ Conclusion:

GCR's predictions are a starting point; always do your research.

Thanks for reading; if you enjoyed it, please like and RT!

Remember, this is purely educational, not financial advice.

• • •

Missing some Tweet in this thread? You can try to force a refresh
 

Keep Current with Crypto, Distilled

Crypto, Distilled Profile picture

Stay in touch and get notified when new unrolls are available from this author!

Read all threads

This Thread may be Removed Anytime!

PDF

Twitter may remove this content at anytime! Save it as PDF for later use!

Try unrolling a thread yourself!

how to unroll video
  1. Follow @ThreadReaderApp to mention us!

  2. From a Twitter thread mention us with a keyword "unroll"
@threadreaderapp unroll

Practice here first or read more on our help page!

More from @DistilledCrypto

May 29
How To Follow The Liquidity - 2024/2025:

Liquidity is the lifeblood of the economy, much like the water in the ocean.

When liquidity surges, just like the tide, altcoins can rise effortlessly.

Here's how you can surf the next tsunami 🧵Image
2/ Measuring Liquidity:

We use the 'M2' to measure liquidity.

M2 counts all the cash people have, both in hand and in their bank accounts.Image
3/ The Impact Of Liquidity:

When there's more M2, this means that people have more money.

Often because of lower interest rates or the government printing more money.

They're more likely to invest. This extra money causes crypto prices to rise fast.
Read 14 tweets
May 27
Deadly Crypto Biases To Avoid:

Crypto moves very fast.

If you're not focused, it's easy to get lost.

As the bull market heats up, mastering these 12 biases can prevent costly errors.

"Conquer your mind or it will conquer you" 🧵Image
2/ Sunk Cost Fallacy:

Occurs when someone won't abandon a strategy due to heavy past investments.

Even when it's clear that abandoning it would be better.

To avoid this, do a "clean slate" analysis.

If the current evidence doesn't support the investment, consider selling.Image
3/ Survivor Bias:

This bias occurs when we focus on success stories while ignoring failures.

For example, we might highlight cryptos that soared, overlooking the many that failed.

To avoid this, keep a "reality check" diary of major wins & losses, not just the headlines.Image
Read 14 tweets
May 23
Where Are The Retail Investors? (pt. 2)

$BTC & $ETH ETFs are both approved.

Normies, exit liquidity, [insert] = ghost town.

Why? Let’s dive into this mystery 🧵Image
2/ The Macro View:

Low liquidity levels could be the first big factor.

The crypto market closely aligns with the broader money supply.

Plus, in this major election year, policymakers may relax stringent policies to serve their interests.Image
3/ Anticipating Improved Liquidity

The expansion of the M2 money supply is at its lowest since the 1990s.

This indicates that there could be more money circulating soon.

Whereby, making it easier for people to buy and sell.Image
Read 17 tweets
May 21
7 Key Predictions From @GCRClassic:

This cycle has been full of surprises.

> $BTC hit new ATHs, but no altseason yet
> ETH has been widely disrespected on CT
> Old coins pumping & FDV is not a meme?

For clarity amid the chaos, here are GCR's top predictions 🧵Image
2/ GCR's Journey:

GCR tarted small in crypto, defying the "need money to make money" belief.

It's a lesson that with persistence and an edge, success is inevitable.

No matter how the cards are dealt.Image
3/ Next Bull Run Fuel: China & Asia

GCR predicts the next rally will be led by the East.

Signs are already showing with Hong Kong approving the first batch of crypto spot ETFs.Image
Read 9 tweets
May 19
Bull Market Peak - 2024 or Beyond 2025?

This cycle is truly different.

The market is less volatile, and everyone is ready for 'altcoin valhalla.'

As $BTC nears $70k, you're likely wondering:

Will the market peak in 2024, or will prices keep climbing into 2025? 🧵Image
Left Translated Cycle Top (2024):

Here, I present 4 key pieces of evidence that support a top in 2024.

Save and bookmark this; you may need to read it twice!

1. Extremely Low Social Risk:

Despite new price highs for $BTC, social risk is still extremely low.

This is important because altcoins rely on social attention to grow.

The current low social risk indicates very little mainstream focus on altcoins.

Even with $BTC's rise, minimal interest in altcoins suggests limited growth potential.

$BTC might enter a super cycle, whereas altcoins could quickly lose momentum.

Increasing altcoin saturation worsens this effect.

Renewed retail interest would invalidation this point.

Early ETH ETF acceptance?
Further TradFi tokenization efforts?
Memecoin super cycle + GME?

2. Treasury Yield Spreads

Treasury yield spreads are a strong indicator for a left-translated cycle.

This insight comes from analyzing other prior periods with inverted yield curves.

Inverted yield curves have reliably signaled upcoming recessions.

Let's review past cycles with similar conditions to see what happened:

(refer to image at bottom of section)

(i) Post-WWII 1948:

Post-WWII in 1948 saw significant money printing and economic struggles.

The peak occurred in June, during an election year.

(ii) Year Of 1966:

In 1966, a bear market was followed by a rally.

This led to a recession and a market top in December.

(iii) The Dotcom Bubble 2000:

The Dotcom Bubble in 2000 peaked in March and saw a sharp decline in April.

A rally followed, lasting until the Q3.

It nearly reached previous highs before a recession ensued.

Case Study Summary:

Each of these instances coincided with election years (same as 2024).

Market peaks occurred in March, June, and December.

3. The April & Q4 Pattern:

Historically, April has been a pivotal month in election years.

It often coincides with the $BTC halving.

Typically, the market forms a local top in April.

It then surpasses this peak in Q4, reaching the cycle top.

This pattern occurred in:

- April and Q4 of 2013
- April and Q4 of 2021
- Repetition in April and Q4 of 2024?

If the market exceeds the local top before Q4, the pattern might continue.

To avoid a top this year, we shouldn't see a local high before Q4.

This helps prevent cycle front-loading.

However, the reliability of this pattern is limited by a small sample size.

While history may not repeat itself exactly, it often rhymes.

4. Rate Cuts + BTC Dominance:

This is a long but valuable piece of evidence; I recommend reading twice.

(i) Anticipated Rate Cuts:

The first rate cut is anticipated in June.

The market currently anticipates three rate cuts, mirroring the situation in 2019.

(ii) Impact on Crypto Dynamics:

Historically, rate cuts combined with rising $BTC dominance have led to a cool off.

This cooling period typically lasts about six months.

(iii) Why Does $BTC Dom. Fall?

(This question is complex, and I don't have a clear answer. I tried to distill @intocryptoverse's response.)

The slowdown in $BTC following rate cuts is due to capital redistribution.

This redistribution occurs at the end of a rate-hiking cycle.

(iv) Capital Redistribution Effects:

With the onset of rate cuts, capital shifts towards riskier, smaller-cap assets.

This shift is driven by expectations of looser monetary policy.

(v) Market Correction Mechanisms:

When capital from stable blue chips to riskier small caps, the market often destabilizes

This can cause corrections & expose the market's reliance on blue chips for stability & growth.

(vi) Crypto Market Response:

This could cause ALT/BTC pairs to eventually bottom while ALT/USD pairs see a decline.

Similar to patterns observed in Sept 2019.

$BTC generally remains stable during these transitions, outperforming altcoins.

(vii) Forecasting Market Trends:

If the market doesn't cool off in Q3/Q4, it likely anticipated the changes.

This suggests a market top in 2024 due to front-running and speculation overload.

Conclusion:
Before you re-read and comment, consider the case for a 2025+ top in my next post.

Credit to @intocryptoverse for the insights and images that made this post possible.Image
Image
Image
Image
Evidence For 2025+ Top:

Here, I present 4 key pieces of evidence that support a top in 2025 and beyond.

Save and bookmark this; you may need to read it twice!

1. $BTC ROI From Cycle Low:

Analyzing $BTC's ROI from its cycle low shows evidence to support a 2025+ top.

The current cycle (red line) has significant room to grow compared to previous ones.

Even with generally lower returns each cycle, this cycle's potential remains strong.

At 500 days, this cycle's ROI (4.4x), is higher than any previous cycle at the same stage.

This indicates a trend of accelerated growth in the current cycle.

This rapid pace suggests that a cooling-off period might be necessary.

If true, this would support the possibility of a $BTC super cycle.

If a mild recession occurs this year, it could lead to easier monetary policies in 2025.

Eg. QE or "money printing".

This scenario would further support the likelihood of a prolonged cycle.

2. ROI After Market Cycle Peak:

Another piece of evidence is revealed by analyzing the April 2021 peak as a reference.

Current data shows we are significantly ahead of past cycles.

Typically, at this stage in the last two cycles, $BTC was down about 60% from its ATH.

If that pattern held now, BTC would be around $29k.

We've never seen ATHs before a halving, but this cycle is different.

Additionally, $BTC has matured as an asset class, and we now have ETFs.

If the ROI from the cycle peak follows past patterns, we might see a peak in Q4 2025.

This forecast heavily relies on experiencing a lull in Q3 or Q4 of 2024.

This would prevent the cycle from being front-loaded and a early leverage overload.

Ben suggests that the 100-week moving average is a key level to monitor.

3. ALT/BTC Trends

(refer to diagram below for this section)

The ratio of (Total 3 - USDT) to BTC, suggests a potential market peak in 2025+.

Total 3 represents the market cap of cryptocurrencies excluding BTC and ETH,

Here's a breakdown:

(i) Understanding Total 3:

We exclude $USDT to focus solely on altcoins.

This gives a clearer view of their market dynamics relative to BTC.

(ii) Historical Trends:

In the past two cycles, market peaks coincided with ALT/BTC ratios dropping below 0.25.

Currently, the ratio stands around 0.45.

In past cycles, market tops usually happen when two conditions are met:

(1) First, $BTC's dominance increases significantly beyond current levels.

(2) This is followed by an altcoin rally vs. $BTC, marking the second phase before the peak.

(iii) Current Situation:

$BTC dom. is expected to rise in the coming months due to market uncertainty.

However, current low retail attention makes it unclear whether we are:

1. Very, very early to altcoins;
2. Or if the best days for ALTs are behind us.

(iv) Long-Term Forecast:

Similar to patterns seen in 2019, the cycle peak might extend into late 2025.

If the ALT/BTC ratio begins to decline now, an altcoin rally could start in late 2025.

This rally could continue into 2026, driving altcoins up against BTC.

4. Unemployment Rate:

The unemployment rate is starting to rise.

While it may not reach the highs seen in prior cycles, it could still increase significantly.

This could prompt the Federal Reserve to cut rates aggressively.

Typically, $BTC value drops when unemployment rises.

However, during the 2020 Covid recession, it increased (super strong V-shape recovery).

This suggests the market might cool off now Q3/Q4 2024 but rally into 2025.

This could happen if the Fed introduces looser monetary policies to manage unemployment.

There might be a three-quarter delay in the market's reaction due to slow rate cuts.

This aligns with a possible peak in 2025.
Be ready for asset prices to rise sooner as investors anticipate the Fed’s actions.

Final Thoughts:

The nature of this cycle's peak will likely hinge on developments in Q3/Q4 2024.

A period of consolidation below ATHs would strengthen the case for 2025+ top.

Conversely, a fast rally without a major paradigm shift could suggest an early peak.

Key Factors to Watch:
1. Interest Rate Decisions: Changes here can significantly impact market dynamics.

2. Bitcoin vs. Altcoins: The strength of $BTC relative to altcoins can signal market shifts.

3. Political Influences: Election agendas and motives may affect market sentiment.

4. Retail Interest in Altcoins: A resurgence here could drive market trends.

Disclaimer:
As always, this content is purely educational and not financial advice.

Acknowledgment:
Thanks to @intocryptoverse for the insights that made this post possible. Follow him for more updates.Image
Image
Image
Image
Read 5 tweets
May 17
The Bull Run - Exit Strategies

It's Q4 2024, $BTC is at $80k.

Altcoin season has finally arrived.

You're tempted to rely on your gut to time the peak. But is there a better approach?

"Failing to prepare is preparing to fail" 🧵Image
2/ Pitfalls Of Price Predictions

Relying only on price targets for managing investments is a common mistake.

Such targets are often subjective, driven by emotions or influenced by social media.

Accurately predicting prices and timing their changes is extremely difficult.Image
3/ The Mind's Tactical Advantage:

As portfolio your grow, fear & greed amplify.

Each dip & rip escalates the battle for rational thinking.

Goalposts move, confirmation bias grows and discipline wanes.

It's you against yourself, and the difficulty rises with the stakes.Image
Read 16 tweets

Did Thread Reader help you today?

Support us! We are indie developers!


This site is made by just two indie developers on a laptop doing marketing, support and development! Read more about the story.

Become a Premium Member ($3/month or $30/year) and get exclusive features!

Become Premium

Don't want to be a Premium member but still want to support us?

Make a small donation by buying us coffee ($5) or help with server cost ($10)

Donate via Paypal

Or Donate anonymously using crypto!

Ethereum

0xfe58350B80634f60Fa6Dc149a72b4DFbc17D341E copy

Bitcoin

3ATGMxNzCUFzxpMCHL5sWSt4DVtS8UqXpi copy

Thank you for your support!

Follow Us!

:(