TPO [market profile] - a complete guide
...basics to advanced
a thread 🧵
...basics to advanced
a thread 🧵

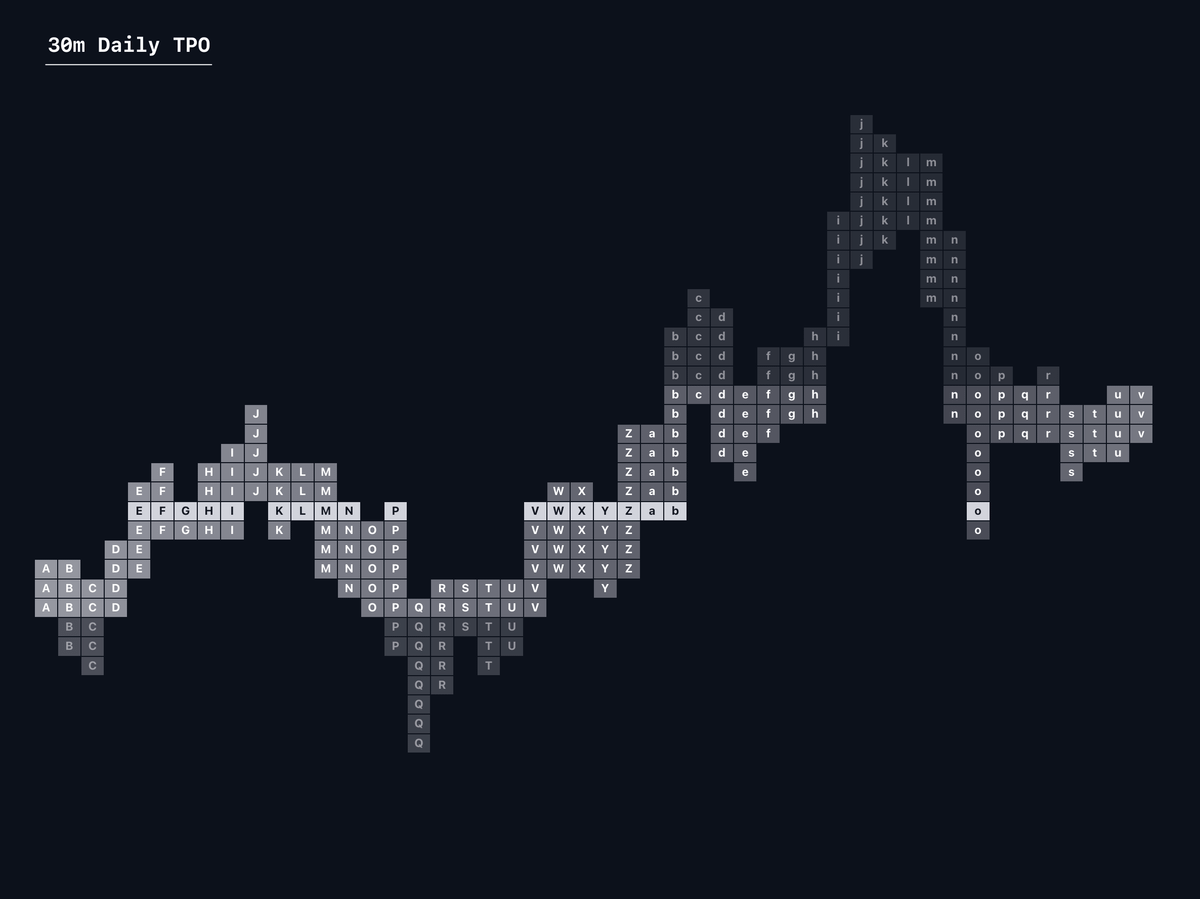
1) How market profiles are formed:
Market profiles are formed based on how much time has been spent at individual price levels.
It will print letters in alphabetical order starting with A, and going on from there based upon your selected timeframe.
Market profiles are formed based on how much time has been spent at individual price levels.
It will print letters in alphabetical order starting with A, and going on from there based upon your selected timeframe.

2) Timeframes
Mostly TPO profiles are used on the daily timeframe built using 30m candles.
If you do use a weekly TPO I recommend building them with 4H candles and for monthly I be using 1d candles.
Most concepts you see online will be built with 30m profiles.
Mostly TPO profiles are used on the daily timeframe built using 30m candles.
If you do use a weekly TPO I recommend building them with 4H candles and for monthly I be using 1d candles.
Most concepts you see online will be built with 30m profiles.
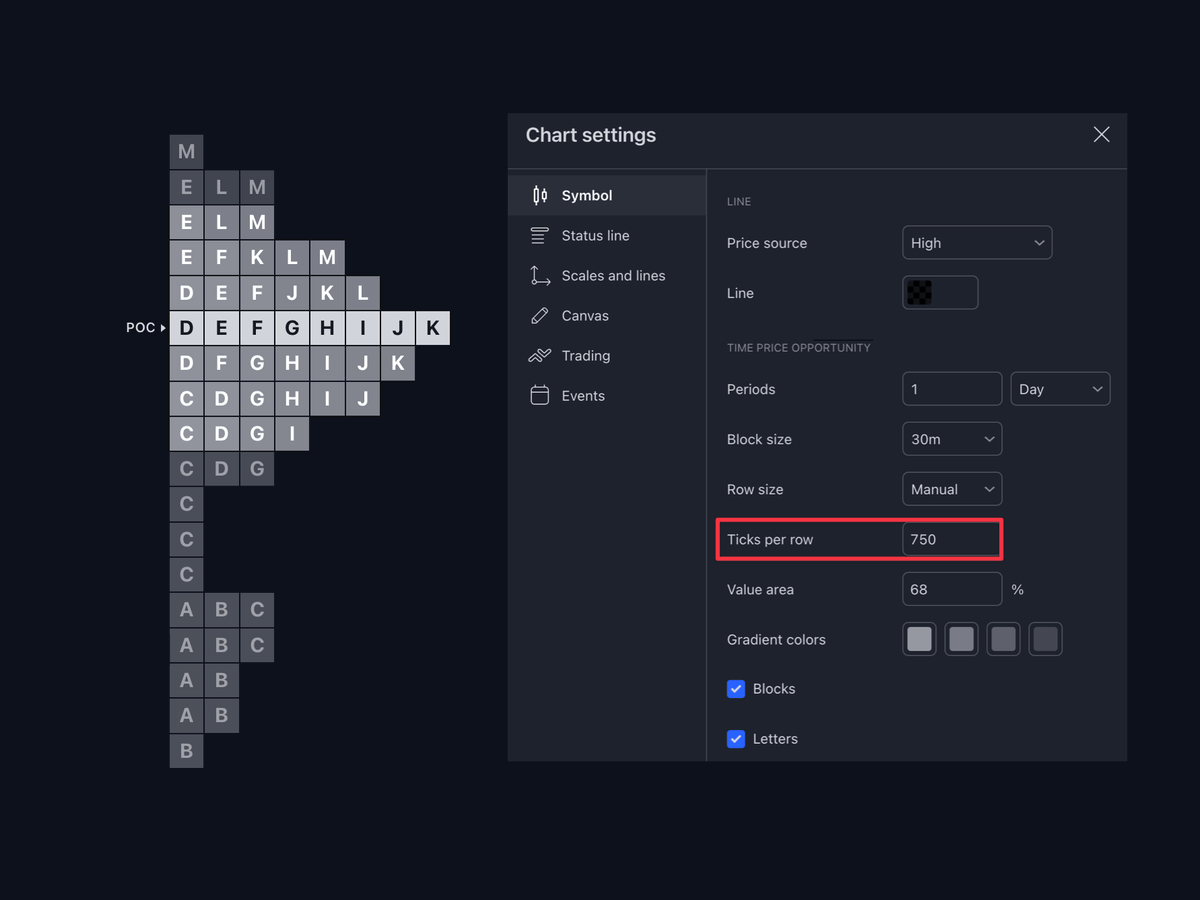
3) Tick sizes
Tick size of your TPO will be dependent mainly on volatility and the specific pair you are using.
It is a variable component of the TPO meaning you should be adapting as price continues to build.
for Bybit BTC/USDT as of June 3 2024, I am using 750 ticks.
Tick size of your TPO will be dependent mainly on volatility and the specific pair you are using.
It is a variable component of the TPO meaning you should be adapting as price continues to build.
for Bybit BTC/USDT as of June 3 2024, I am using 750 ticks.
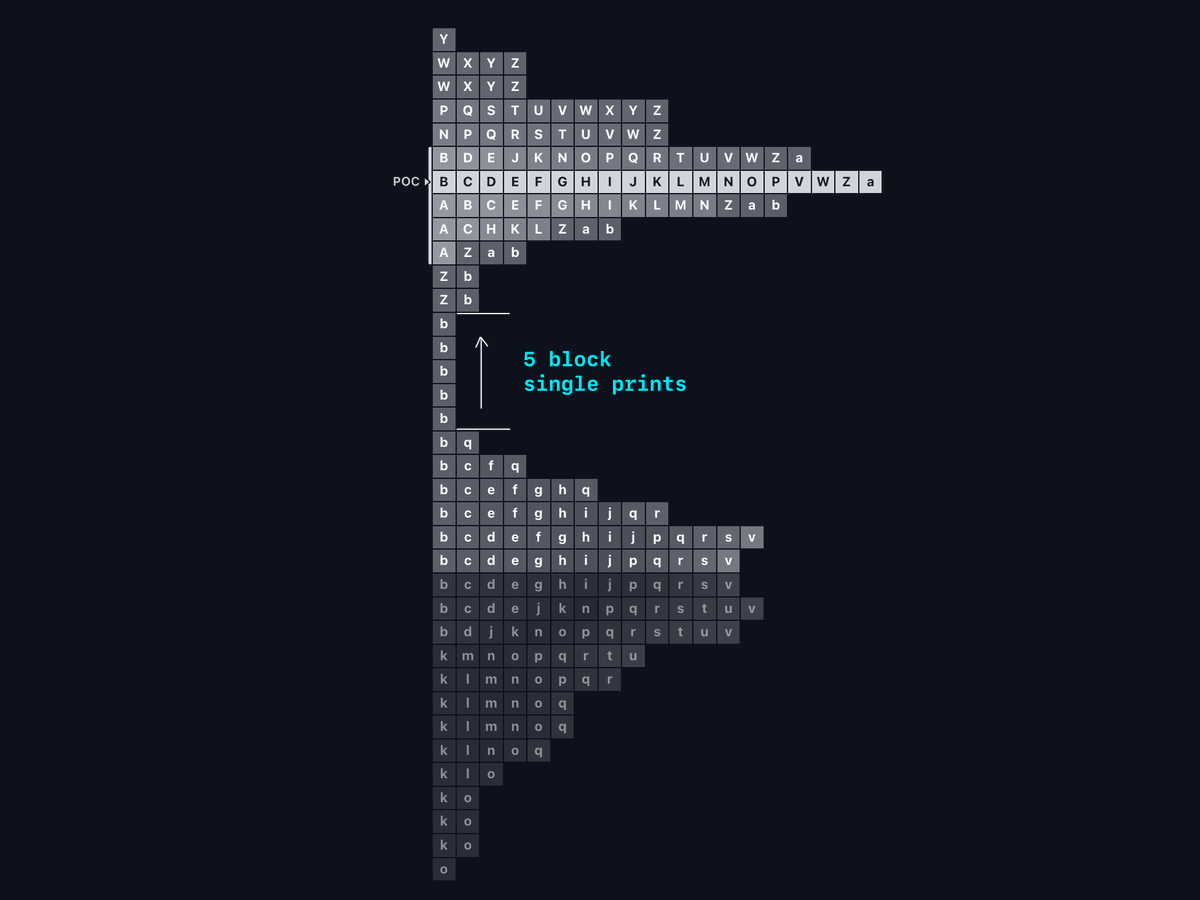
4) Single prints
where price has spent little time (1 candle); a set of consecutive 1 blocks within the TPO
These single prints if revisited, price can see a quick move to the other side
The initial move into the sp’’s could be a good poi for potential rejection or bounce
where price has spent little time (1 candle); a set of consecutive 1 blocks within the TPO
These single prints if revisited, price can see a quick move to the other side
The initial move into the sp’’s could be a good poi for potential rejection or bounce
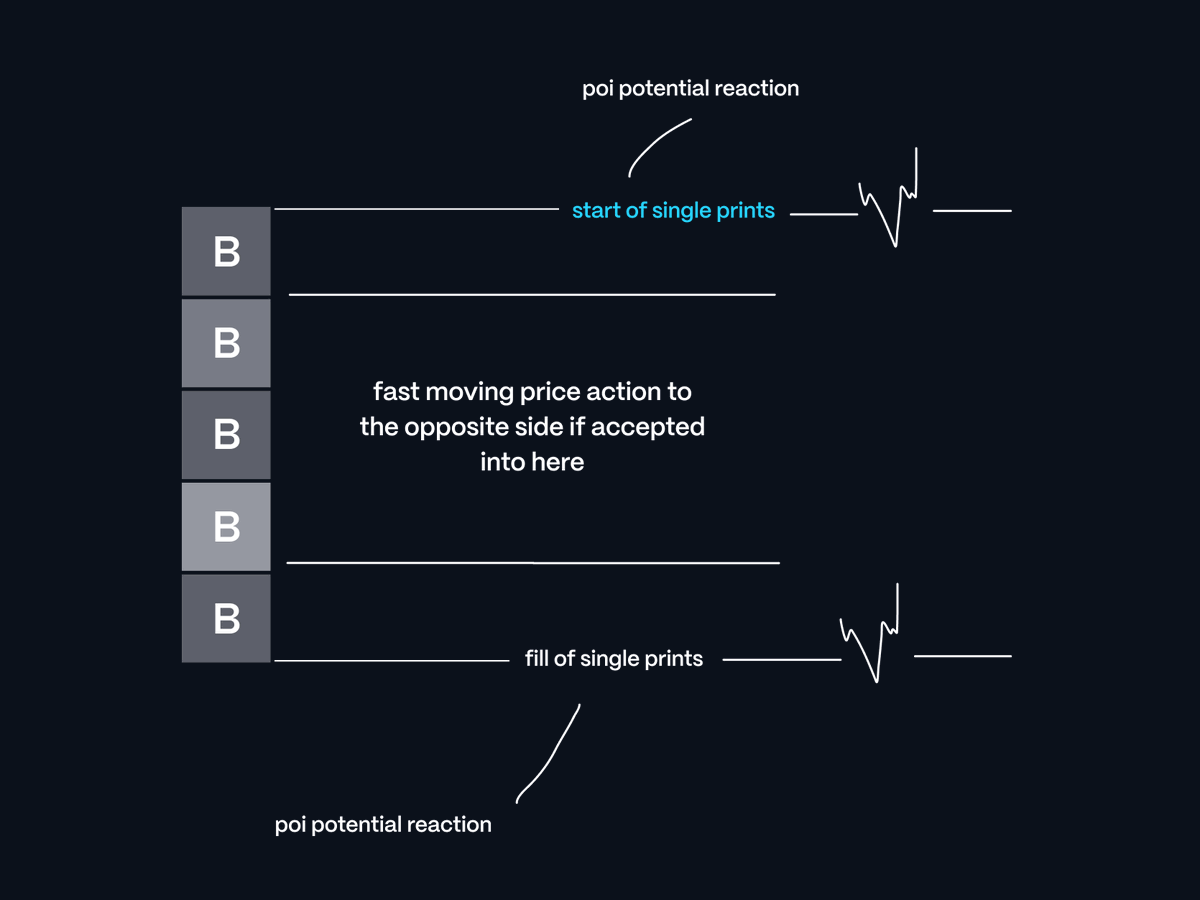
Single prints [2]
3 components:
First touch - potential POI with people anticipating breakdowns/breakups.
Middle of SP - not interested in trading, as if price sees acceptance, it’s a swift move to the other side.
Complete fill - can be POI however, I prefer the first touch.
3 components:
First touch - potential POI with people anticipating breakdowns/breakups.
Middle of SP - not interested in trading, as if price sees acceptance, it’s a swift move to the other side.
Complete fill - can be POI however, I prefer the first touch.
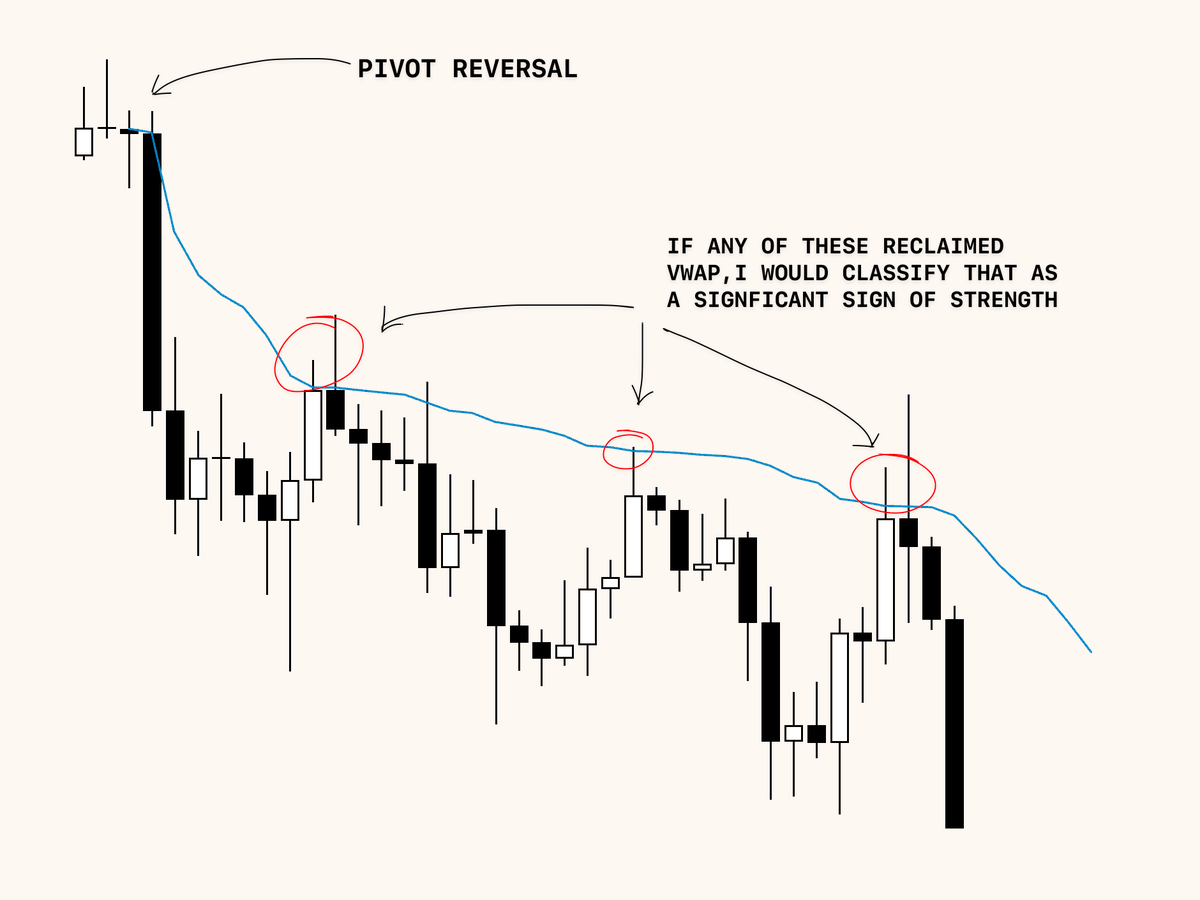
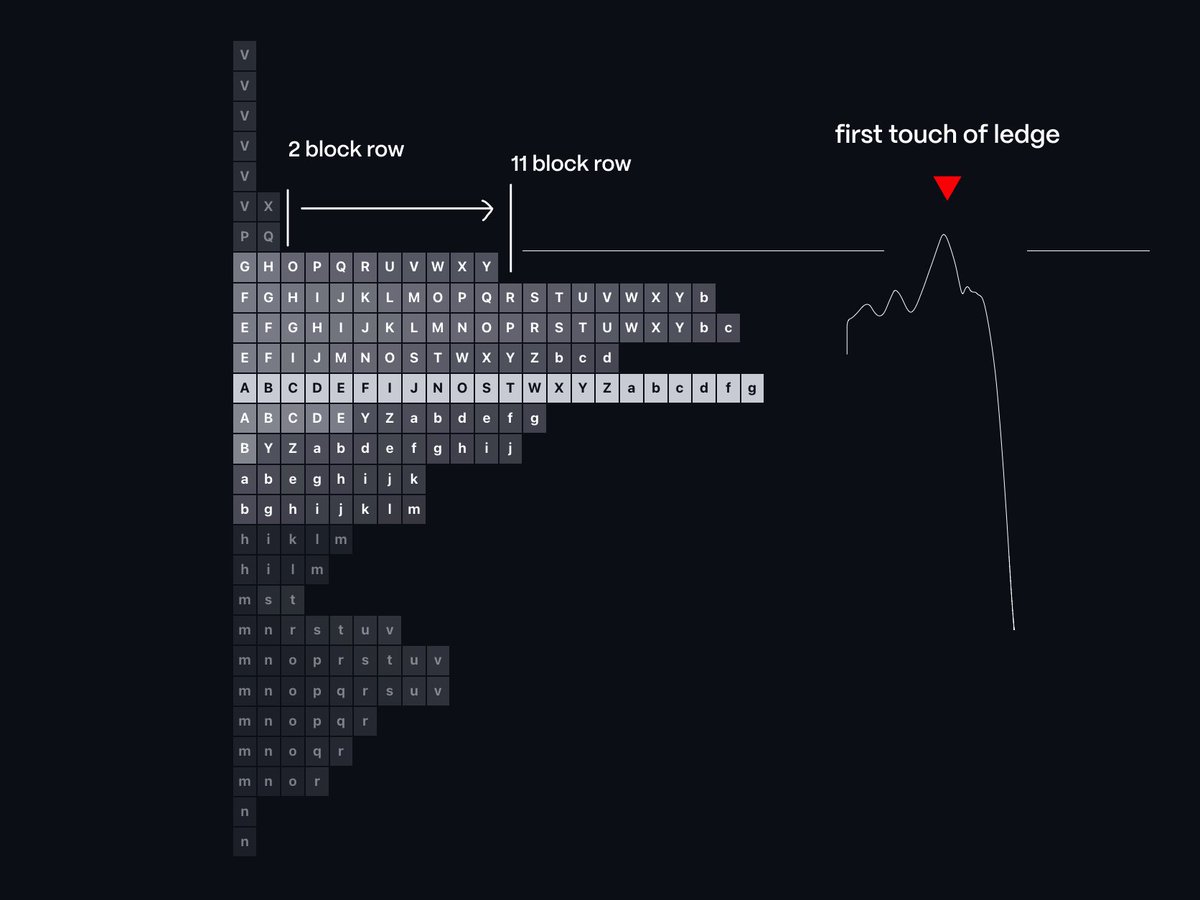
5) Ledge
When the TPO profile drops suddenly, resembling a “ledge”.
These ledges are ideal for breakout traders entering to break past the pivot point after the ledge.
These ledges can signal reversals for POIs.
below is an example ↓
When the TPO profile drops suddenly, resembling a “ledge”.
These ledges are ideal for breakout traders entering to break past the pivot point after the ledge.
These ledges can signal reversals for POIs.
below is an example ↓
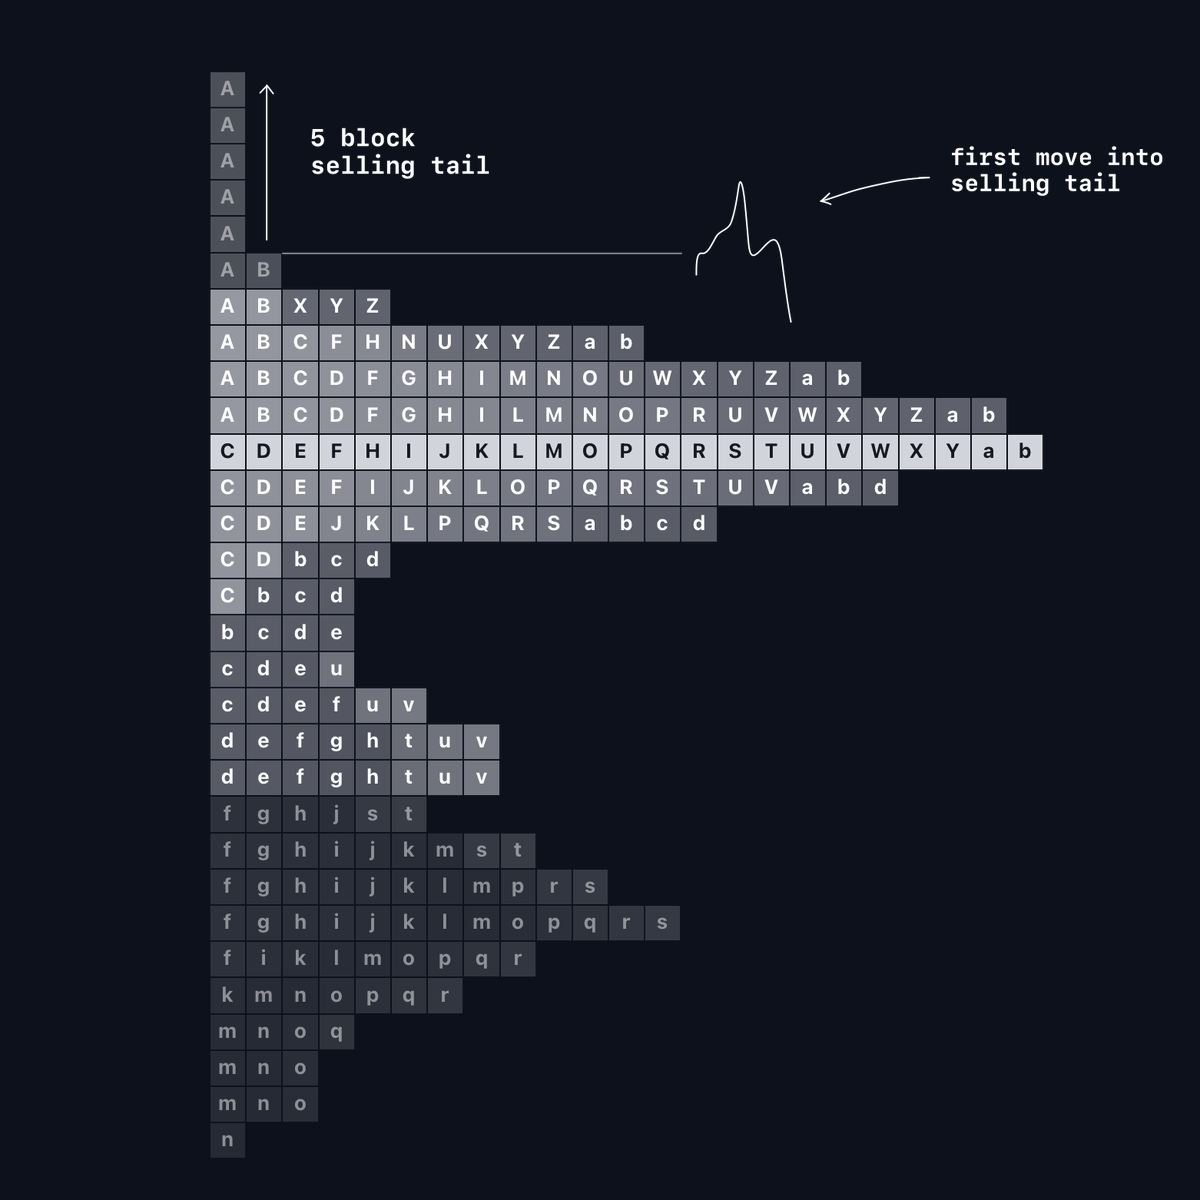
6) Buying/Selling Tails
Top of profiles - Selling tails
Bottom of profiles - Buying tails
Similar to single prints; however, they are referred to only the very high and low of the profile.
If a profile does not have a buying/selling tail, it is seen as a unfinished auction.
Top of profiles - Selling tails
Bottom of profiles - Buying tails
Similar to single prints; however, they are referred to only the very high and low of the profile.
If a profile does not have a buying/selling tail, it is seen as a unfinished auction.
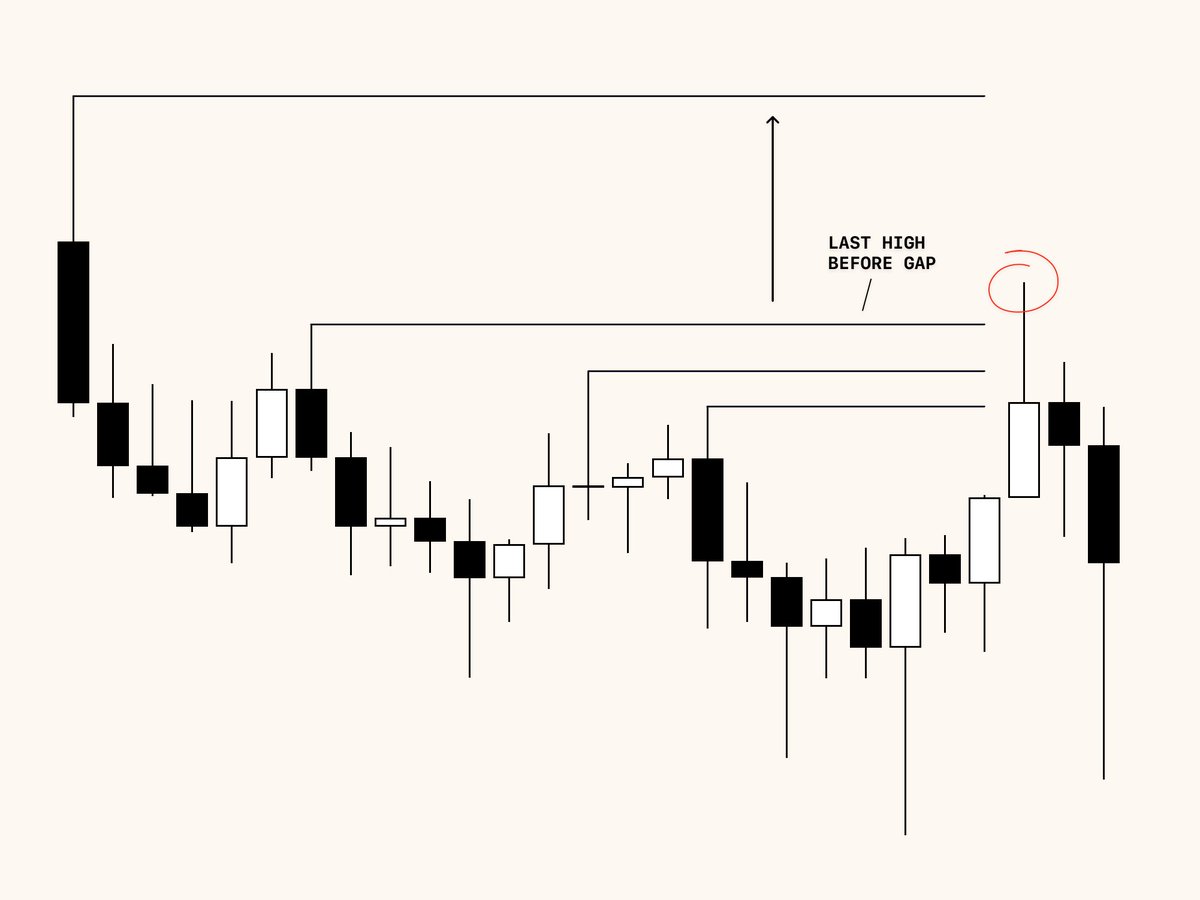
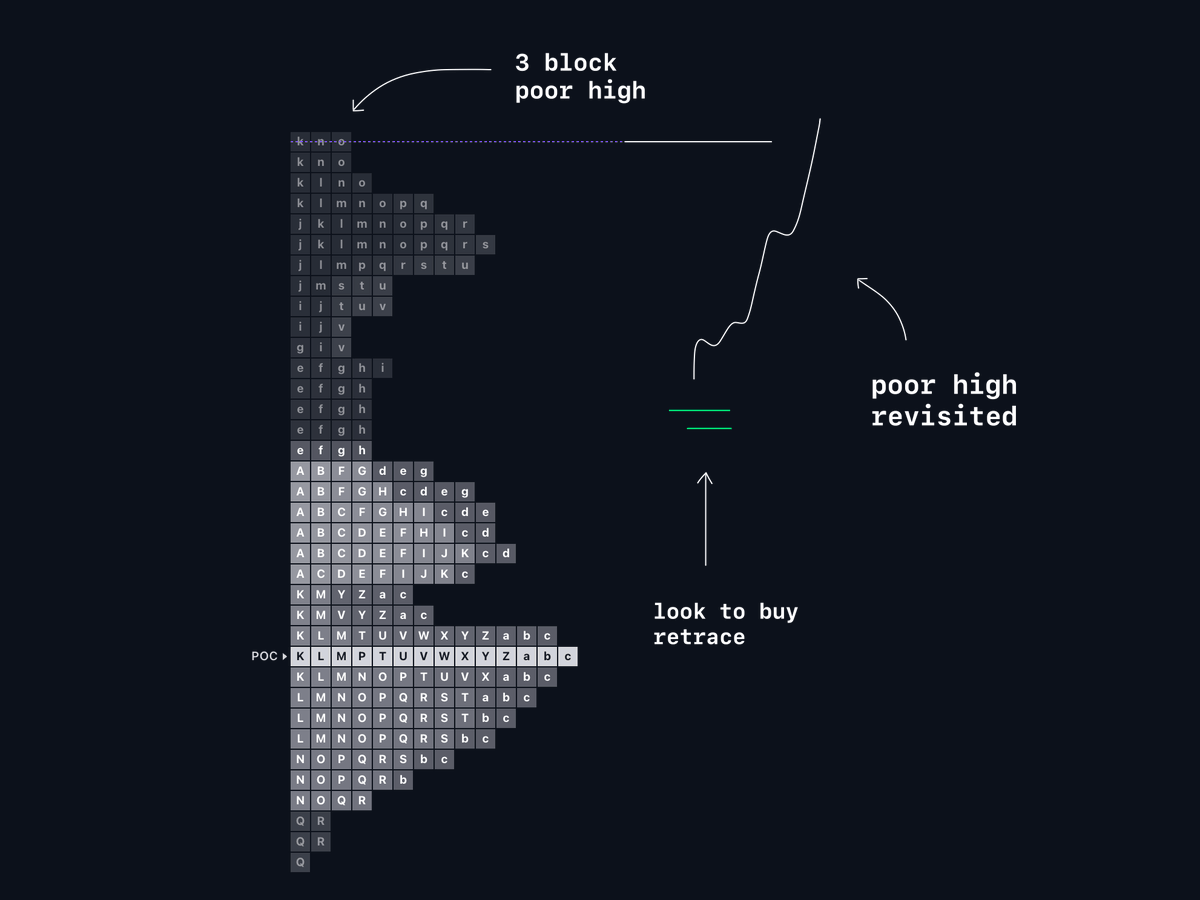
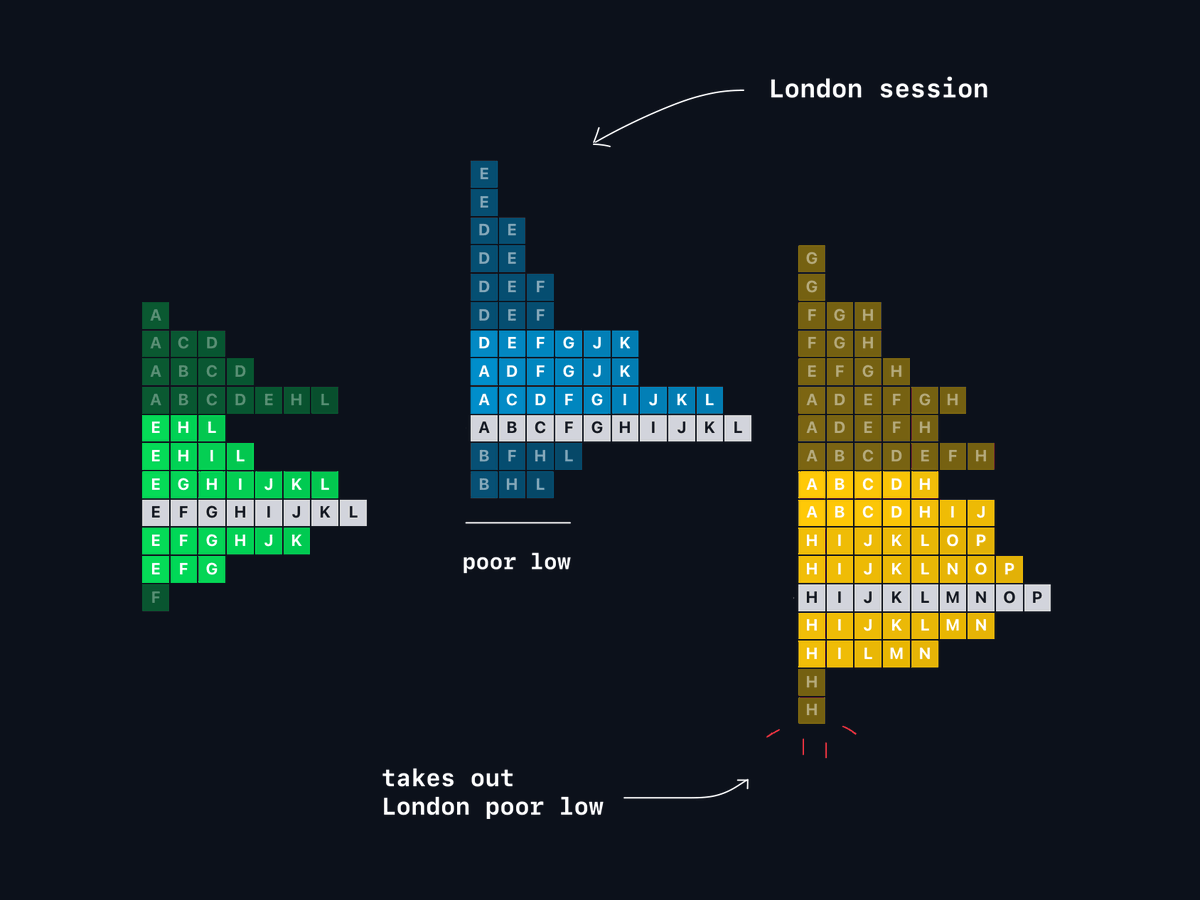
7) Poor Highs & Lows
When the profile lacks a buying/selling tail, leaving a 2-block or more high or low.
I use these daily for directional bias.
If a daily or session tpo leaves a poor high/low, chances of revisiting the pivot increase.
↓ example for directional bias.
When the profile lacks a buying/selling tail, leaving a 2-block or more high or low.
I use these daily for directional bias.
If a daily or session tpo leaves a poor high/low, chances of revisiting the pivot increase.
↓ example for directional bias.
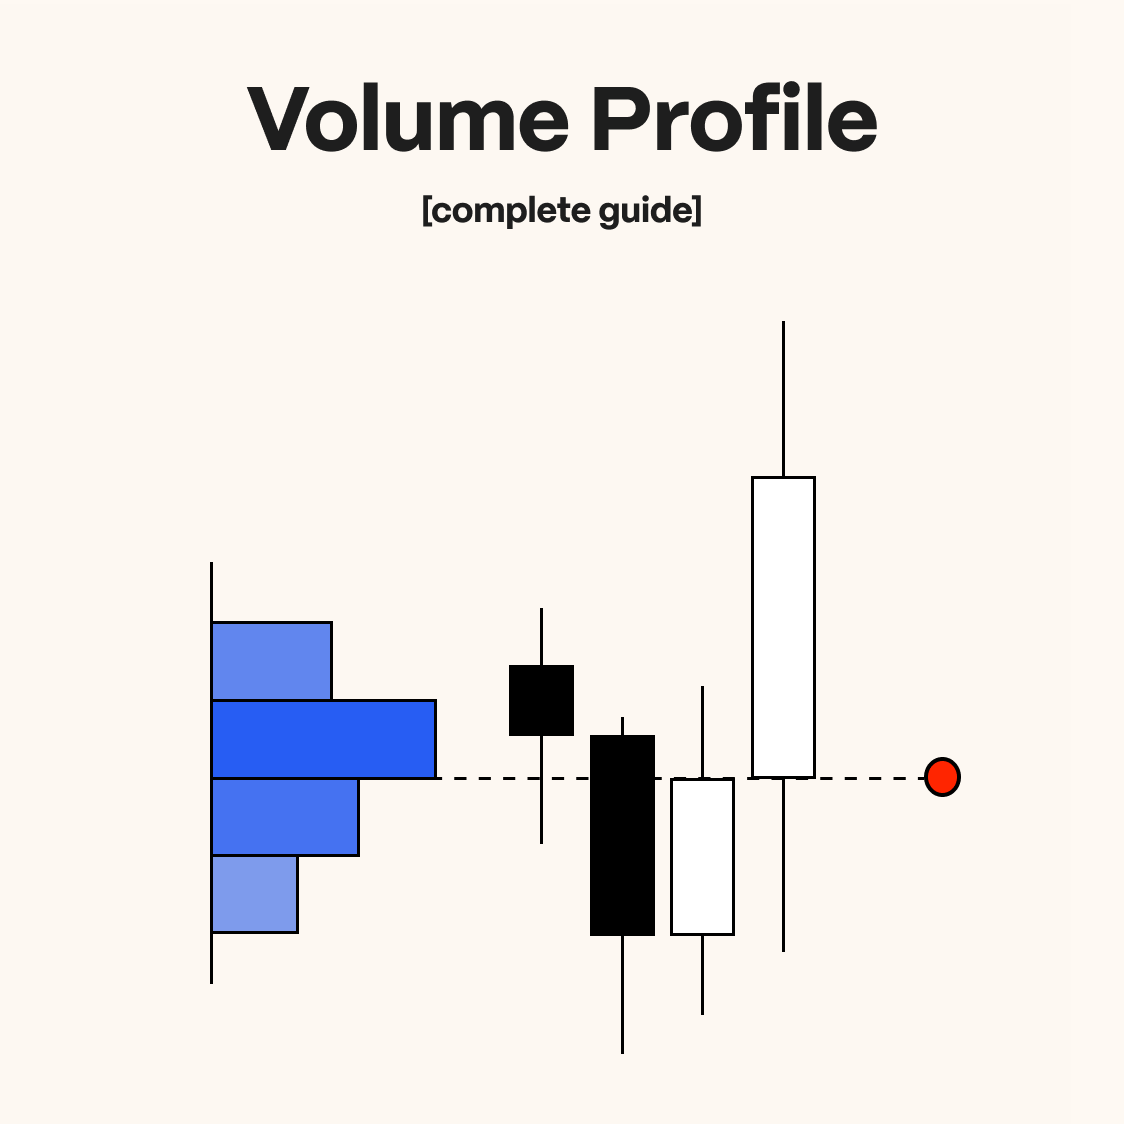
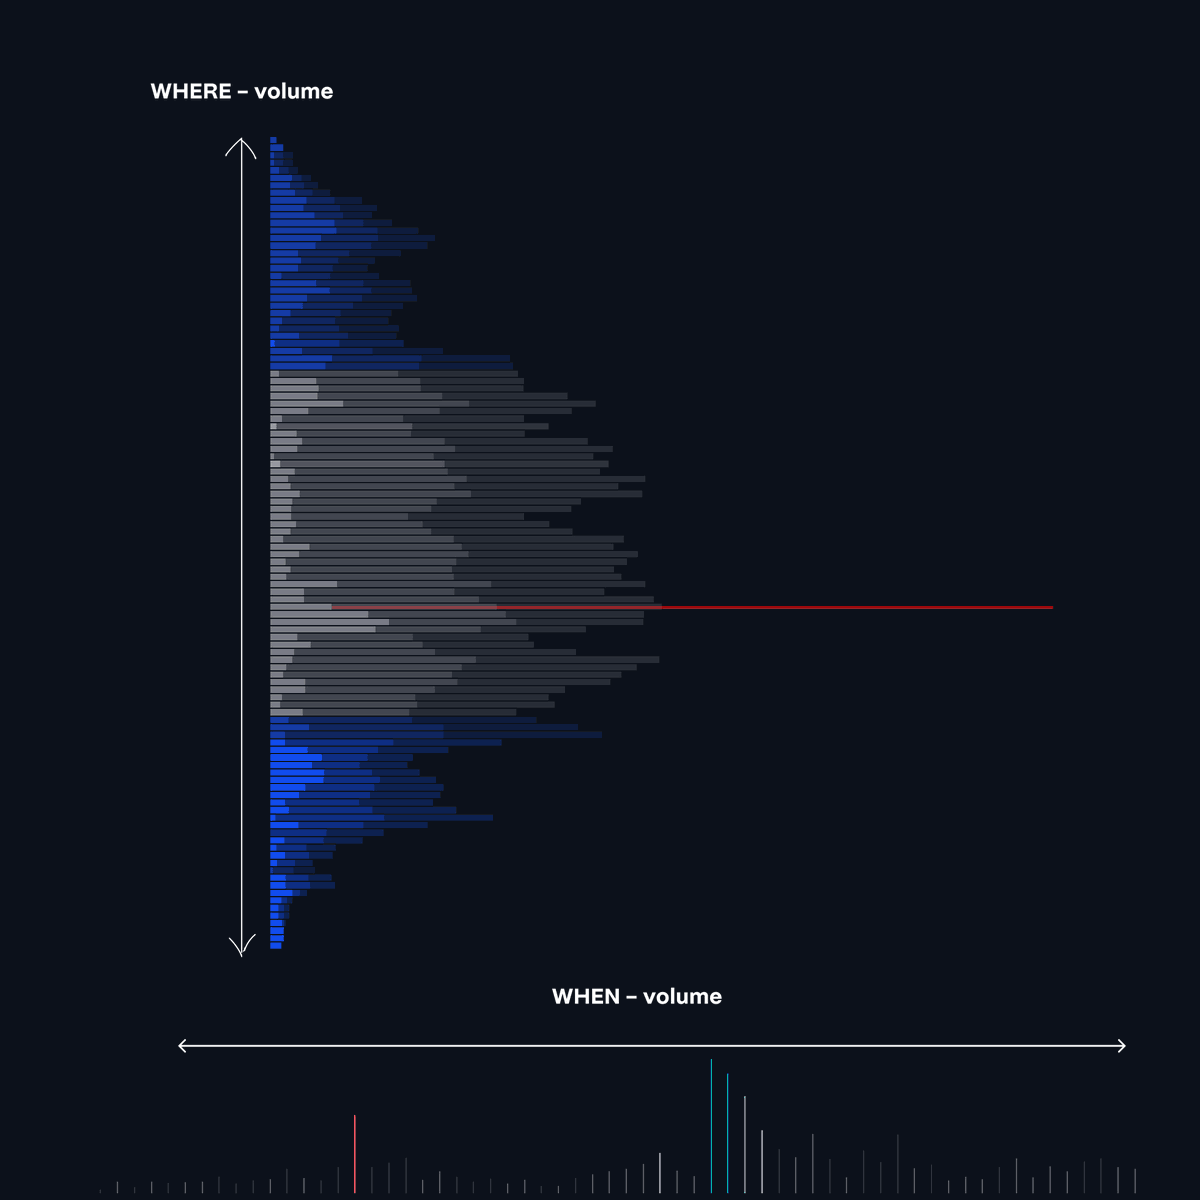
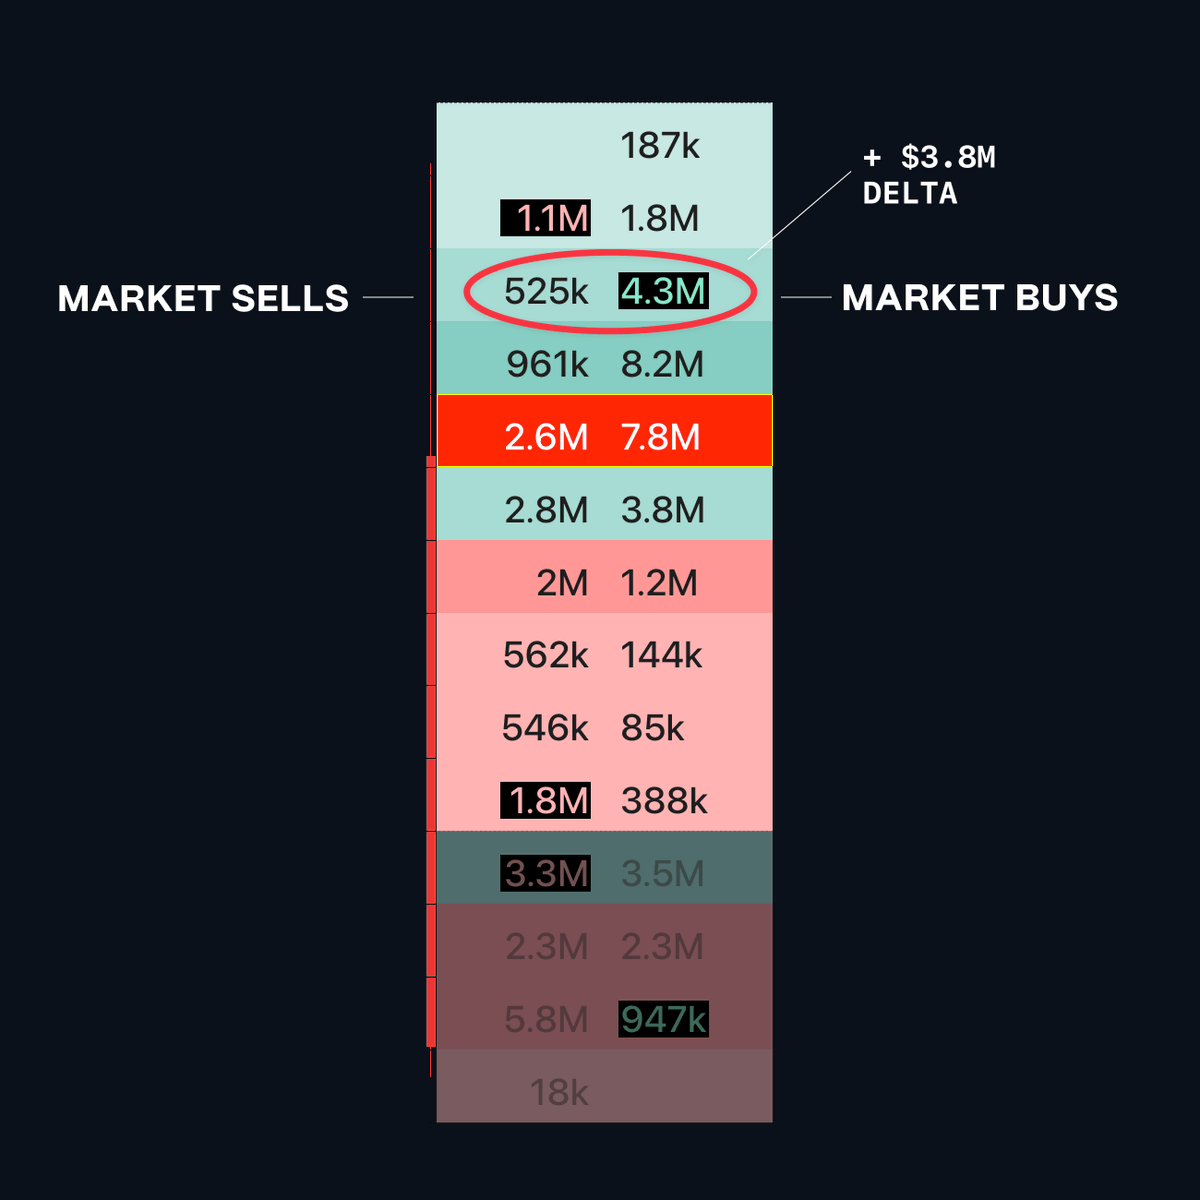
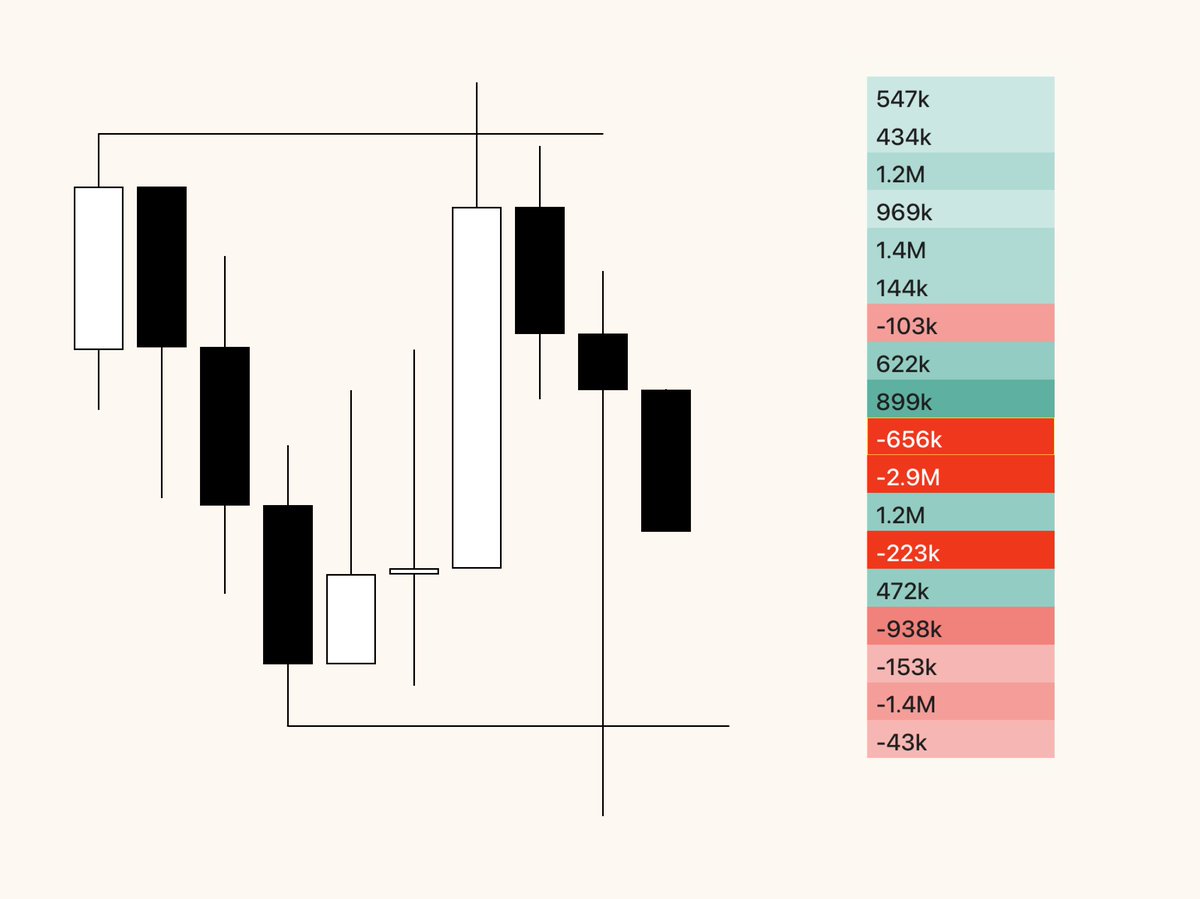
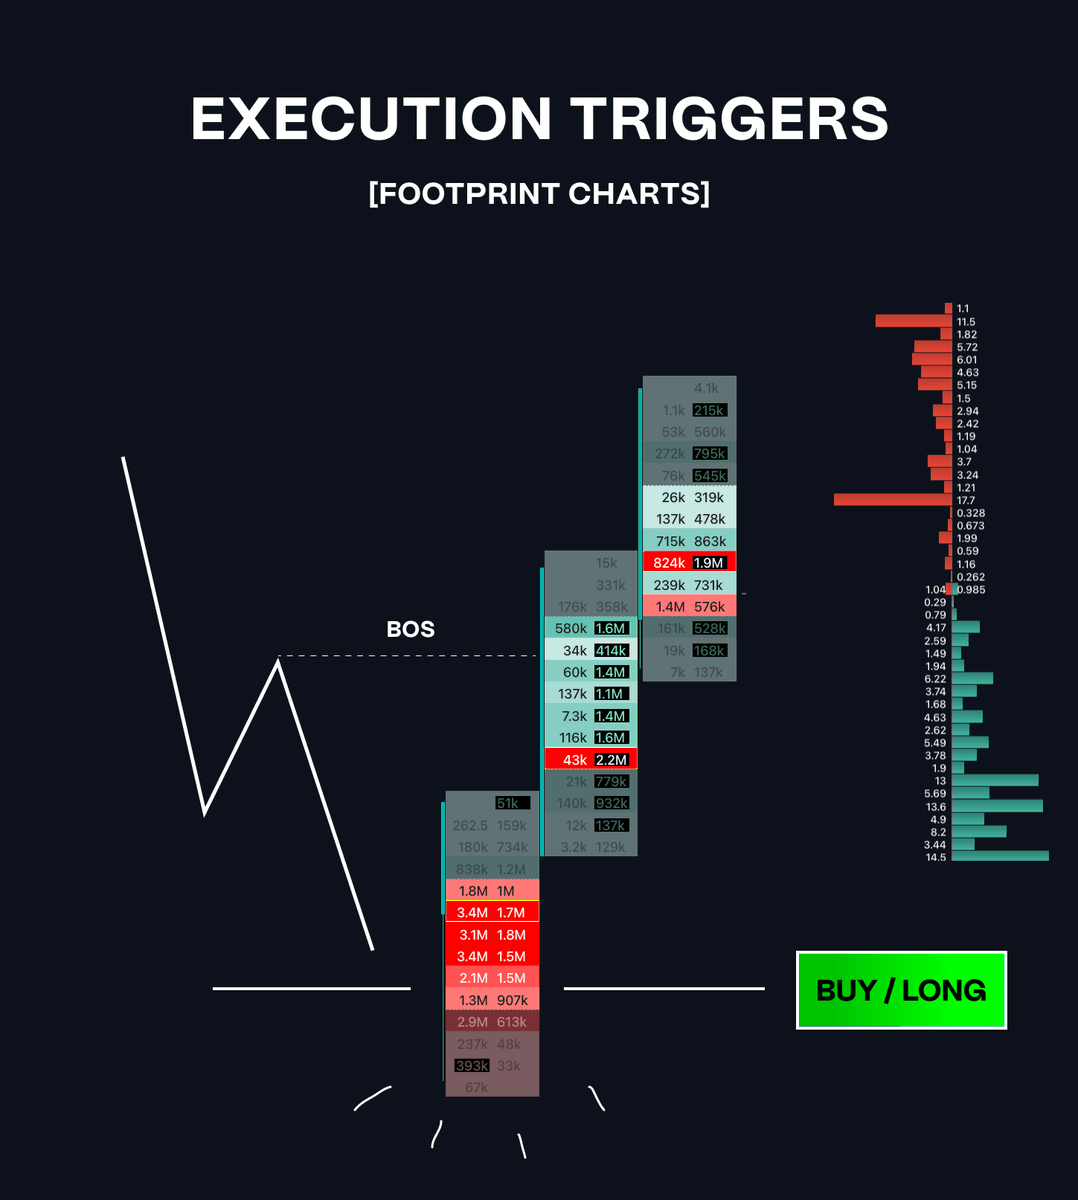
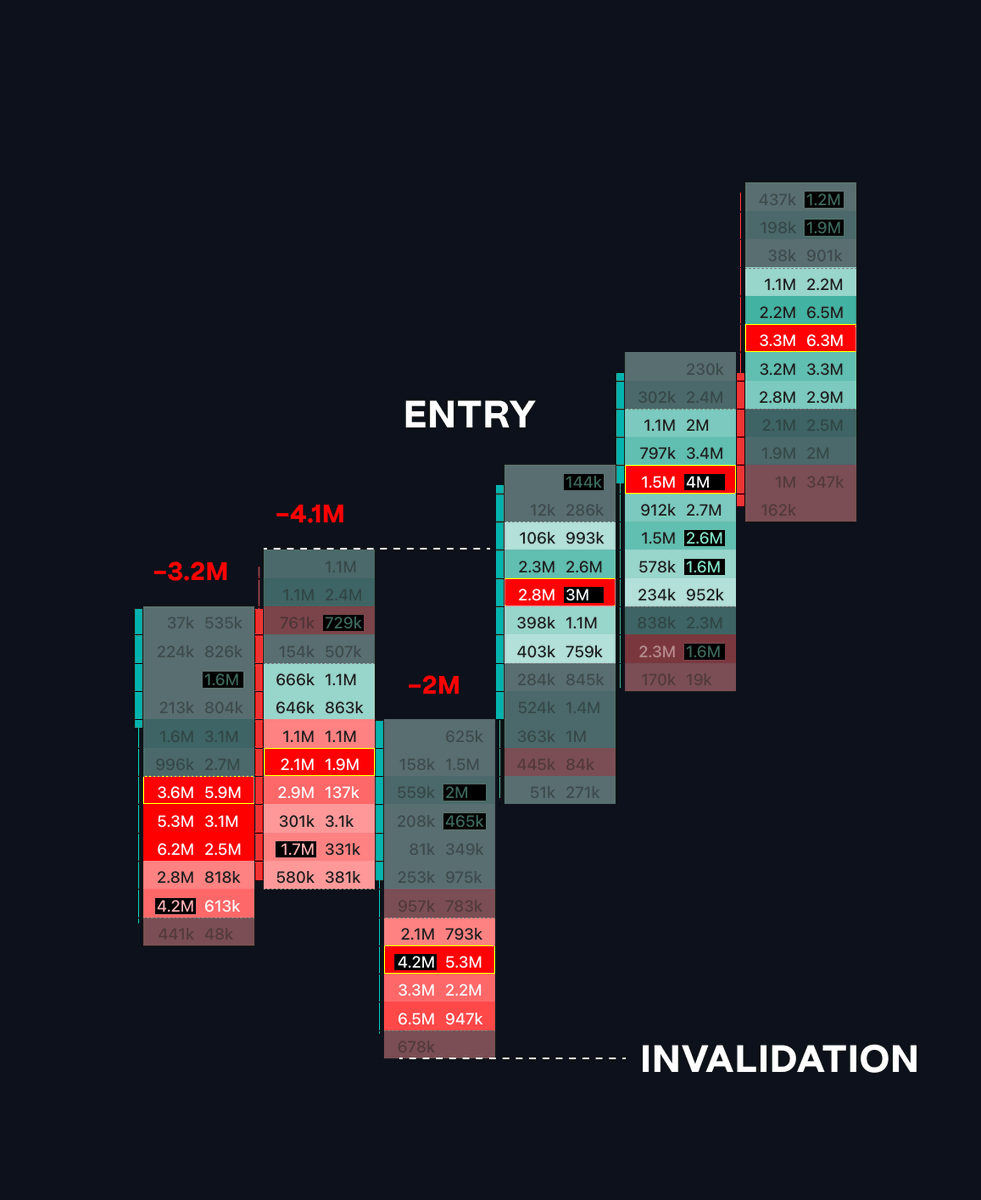
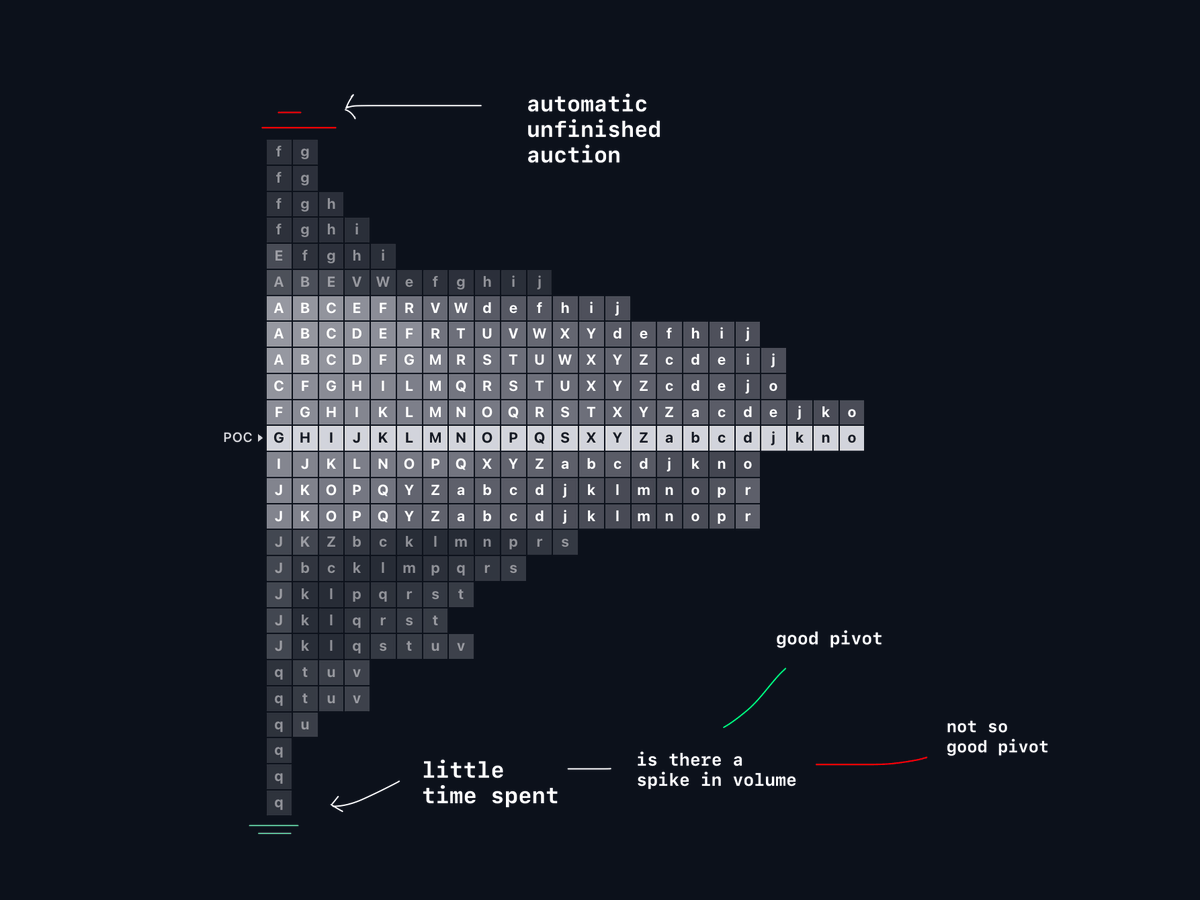
8) Time vs Volume
Complete auction → spike in volume with little time spent at the pivot
Incomplete auction → no spike in volume with more time spent at the pivot
The key is to use time and volume (footprint) together to make better decisions, not using one over the other.
Complete auction → spike in volume with little time spent at the pivot
Incomplete auction → no spike in volume with more time spent at the pivot
The key is to use time and volume (footprint) together to make better decisions, not using one over the other.
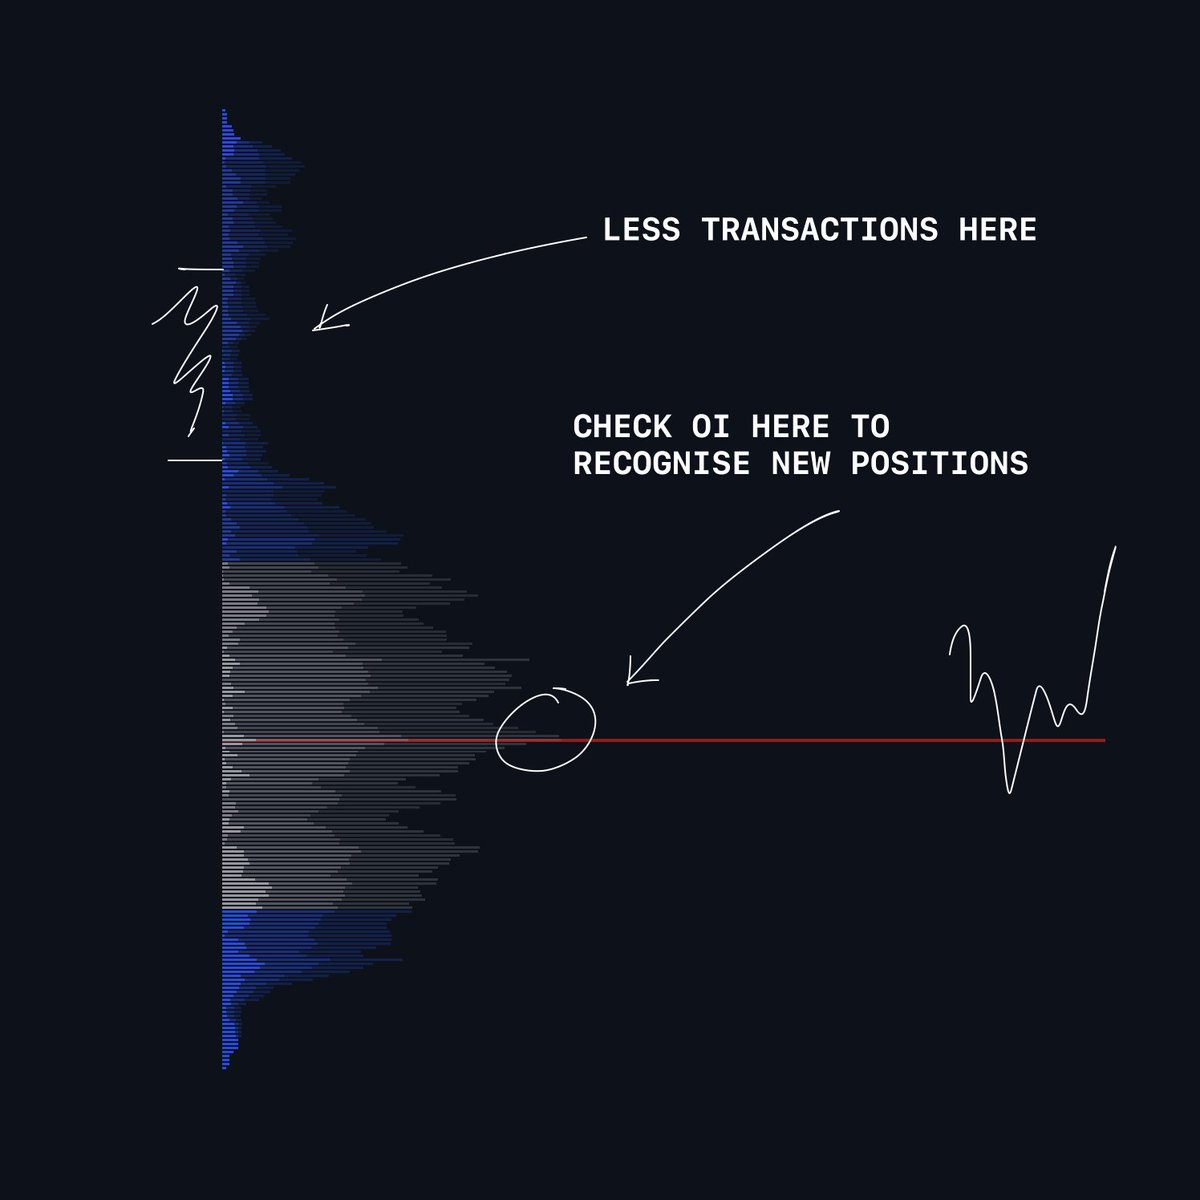
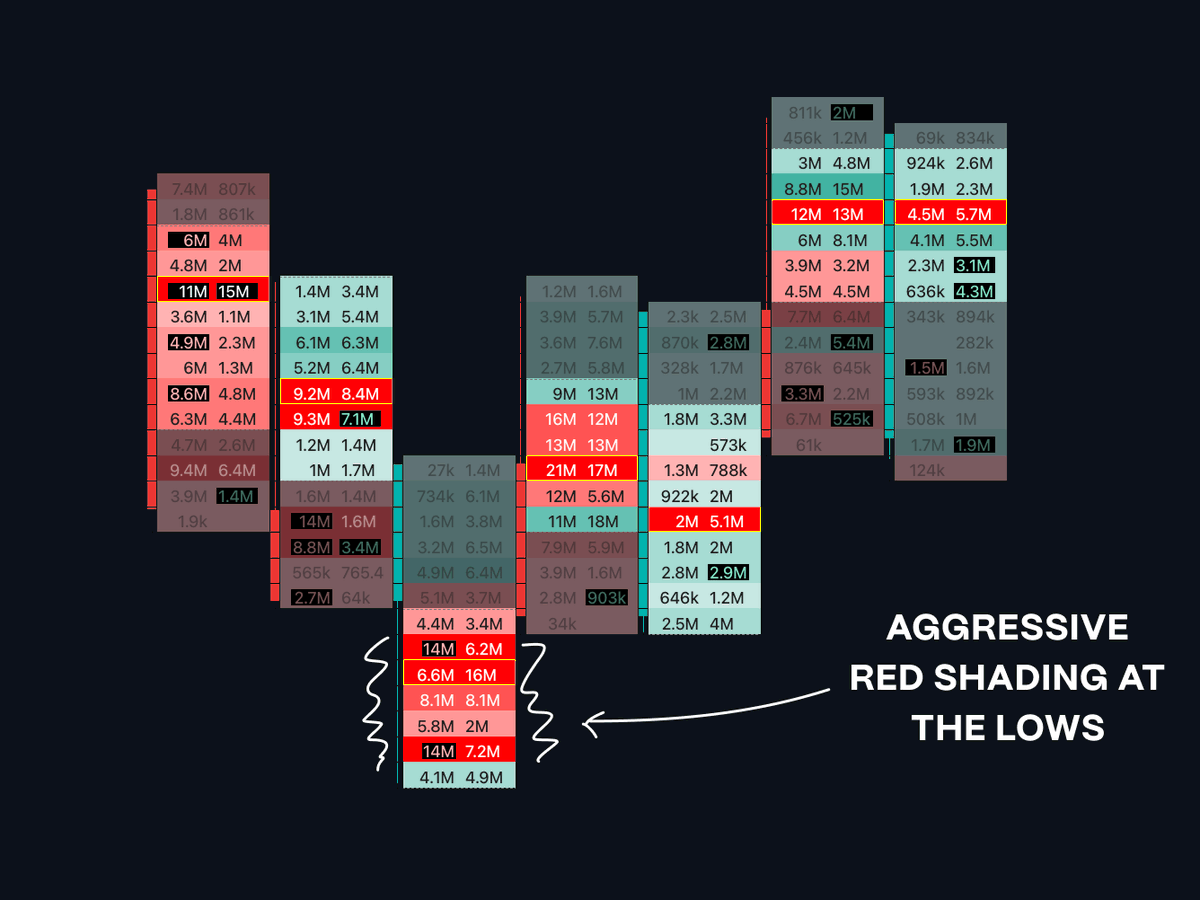
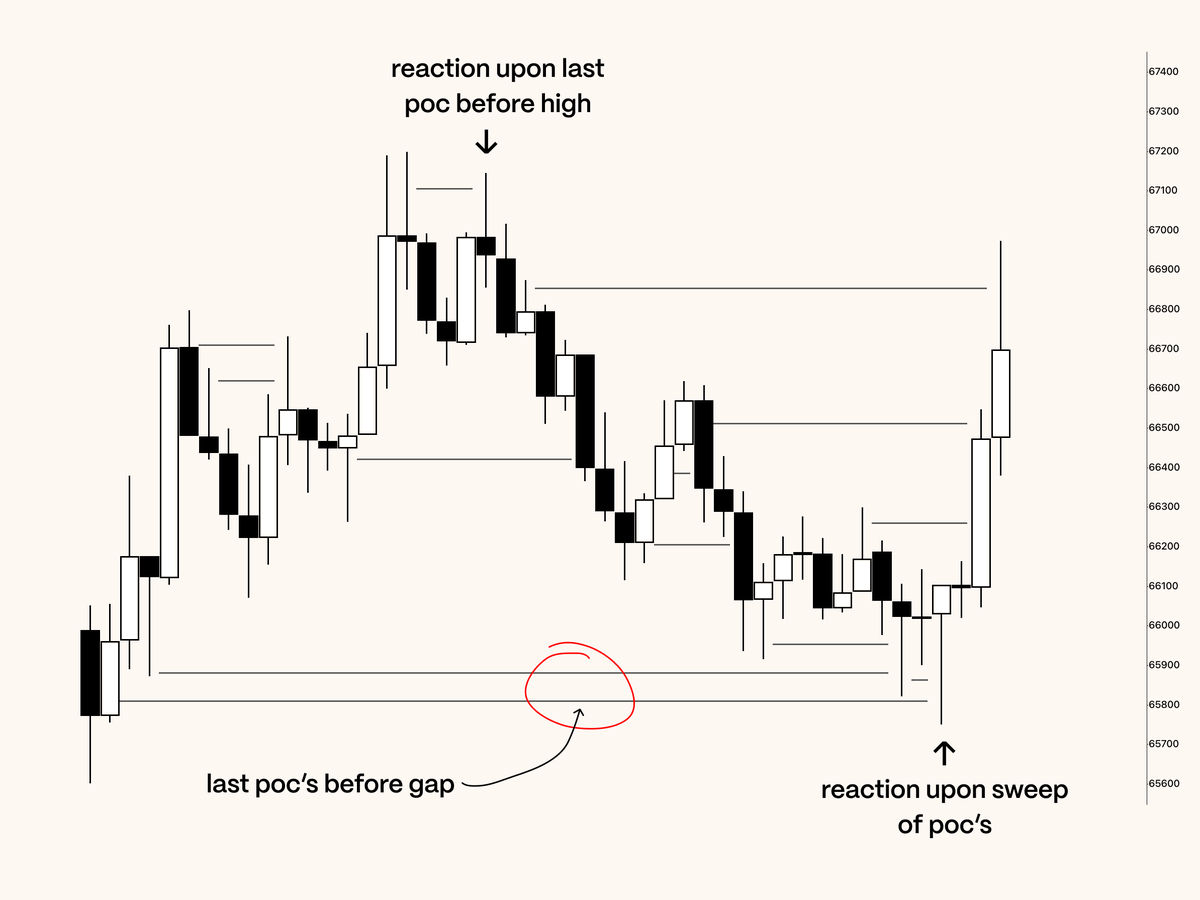
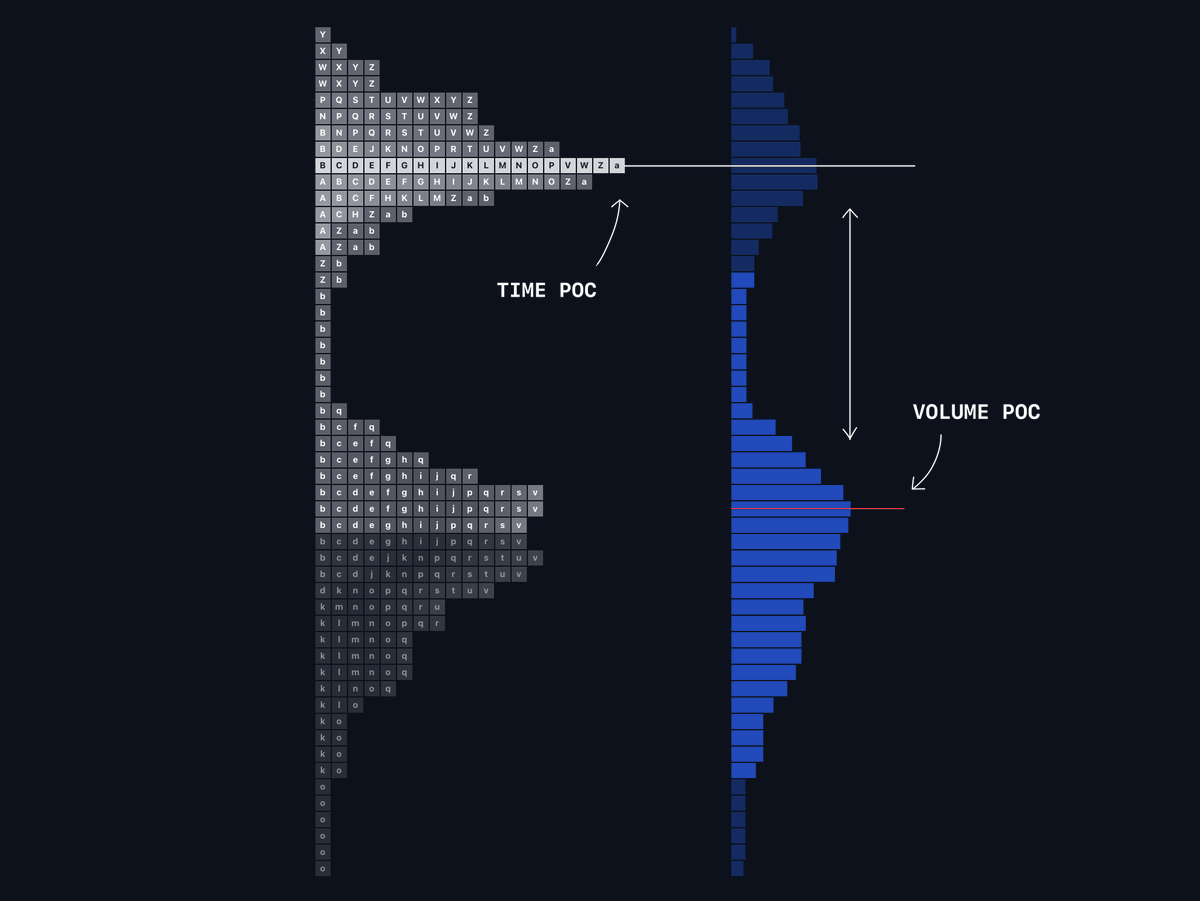
9) POC discrepancies
Can indicate time being spent somewhere not aligned with the volume.
If price breaks out of a range and the vPOC shifts up, leaving behind the tPOC, that move has significant volume behind it. Making it less likely I'm going to fade that move.
Can indicate time being spent somewhere not aligned with the volume.
If price breaks out of a range and the vPOC shifts up, leaving behind the tPOC, that move has significant volume behind it. Making it less likely I'm going to fade that move.
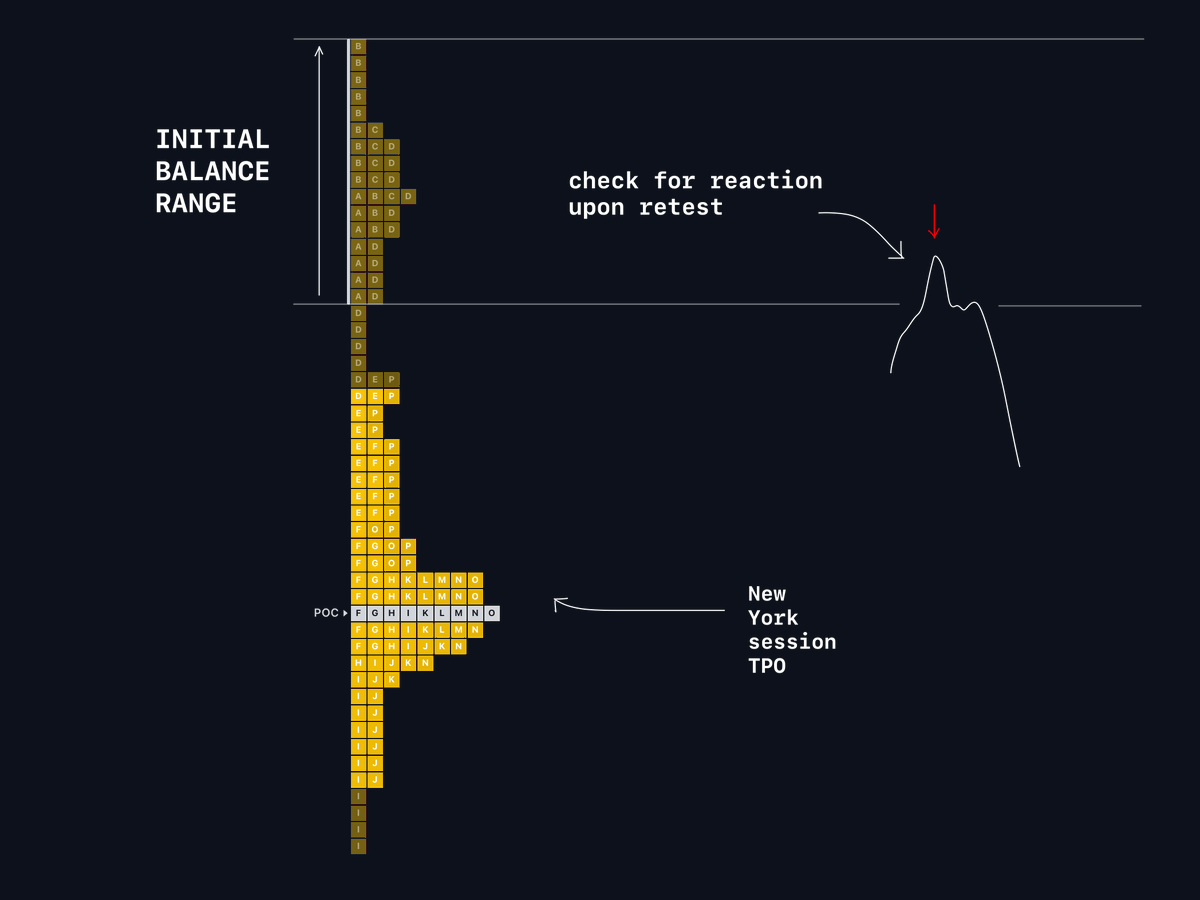
10) Initial balance
Normally, the first 2 candles of the profile as it align with the 1st hour of the day’s price action.
The IB can provide for good POI's by the participants within its range.
I target session IB's (NY), to focus on where larger traders may be participating.
Normally, the first 2 candles of the profile as it align with the 1st hour of the day’s price action.
The IB can provide for good POI's by the participants within its range.
I target session IB's (NY), to focus on where larger traders may be participating.
11) Custom sessions
TPOs can be applied across intraday periods. They are useful for monitoring poor highs/lows, session highs and lows, and revisitation potential.
My session times (UTC):
Asia → 0-6
London → 6-12
New York → 12-20
Close → 20-0
TPOs can be applied across intraday periods. They are useful for monitoring poor highs/lows, session highs and lows, and revisitation potential.
My session times (UTC):
Asia → 0-6
London → 6-12
New York → 12-20
Close → 20-0
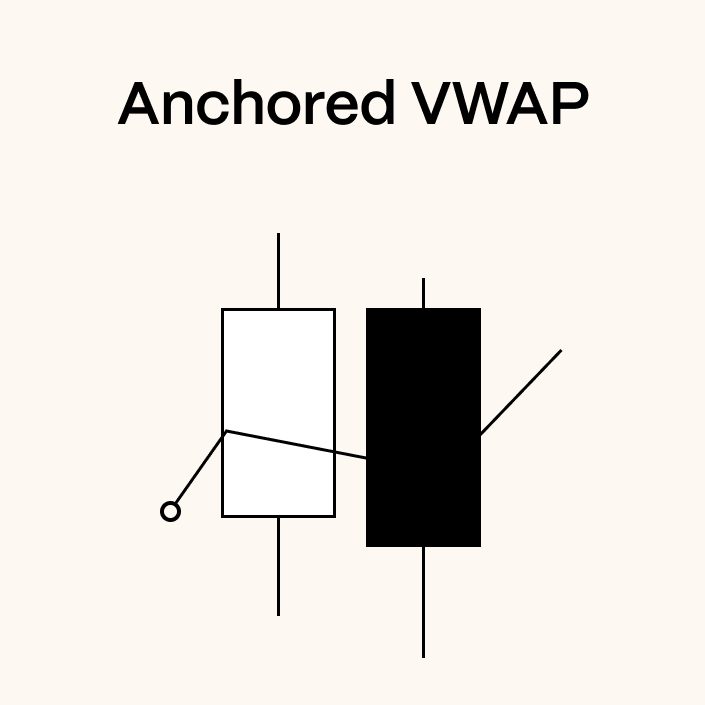
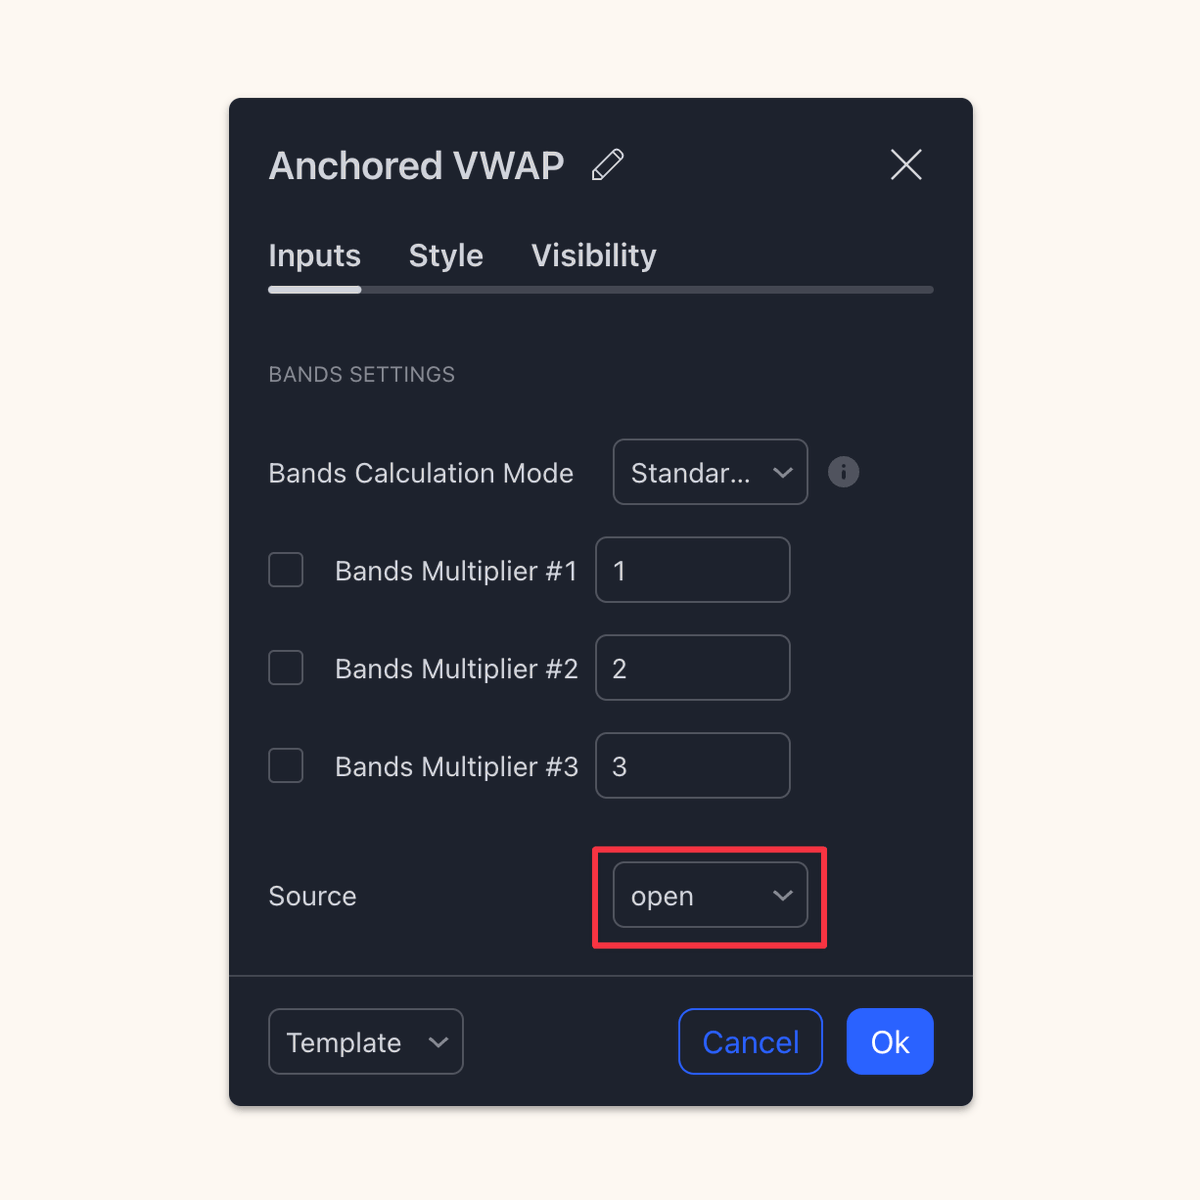
12) Tools
You can using @tradingview built in TPO for premium accounts, which has most settings you would want.
alternatively @ExochartsC provides advanced TPO function with a more customisable TPO option: complete custom session times, session filtering and more.
You can using @tradingview built in TPO for premium accounts, which has most settings you would want.
alternatively @ExochartsC provides advanced TPO function with a more customisable TPO option: complete custom session times, session filtering and more.
Thanks for reading. I will cover day types in a separate 🧵, otherwise it would make for a thread too large (imo).
Hope you found this valuable.
Please leave a like if you did & ask any questions down below.
For everything I have to offer, read my pinned post (ALL FREE).
Hope you found this valuable.
Please leave a like if you did & ask any questions down below.
For everything I have to offer, read my pinned post (ALL FREE).

• • •
Missing some Tweet in this thread? You can try to
force a refresh