Michael Olesen 💉😷🇺🇸🇺🇦 Profile picture
Jun 13 4 tweets 2 min read Read on X
1-4

It looks like we have hit the bottom of the curve for wastewater in the US. Also notice how the bottoms keep getting higher and higher. Notice how the y-axis gives concentrations. Image
2- Here is the wastewater data from the CDC for the past year. Notice how the national "activity level" (black line) is climbing. Image
3- Here it is again, but zoomed out. Why isn't there the same increasing pattern in the baselines? The y-axis gives us a hint. Image
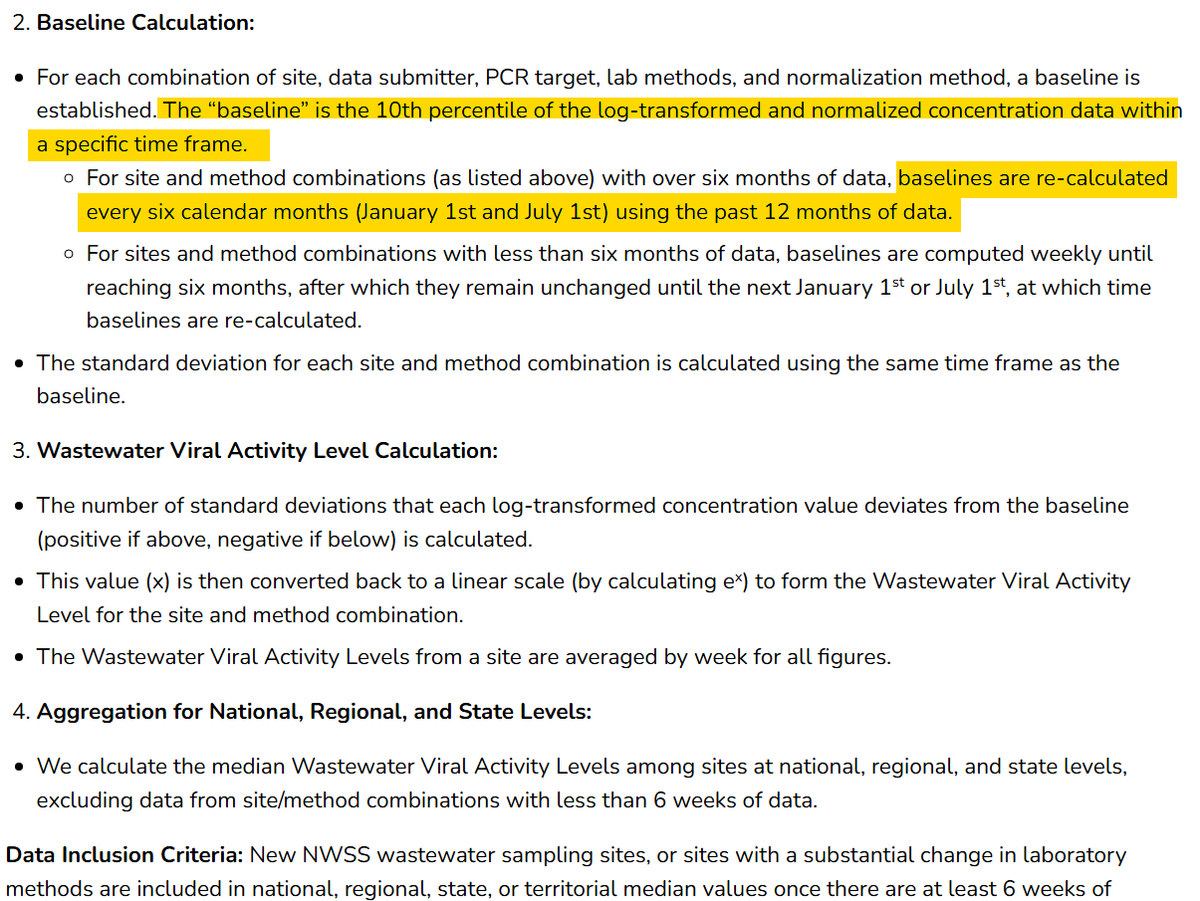
4-4 It's because the CDC is obfuscating the data and making things look better over time than they are. They are doing this by recalculating the baselines, hence no objective scale on the y-axis.

cdc.gov/nwss/about-dat…
Image

• • •

Missing some Tweet in this thread? You can try to force a refresh
 

Keep Current with Michael Olesen 💉😷🇺🇸🇺🇦

Michael Olesen 💉😷🇺🇸🇺🇦 Profile picture

Stay in touch and get notified when new unrolls are available from this author!

Read all threads

This Thread may be Removed Anytime!

PDF

Twitter may remove this content at anytime! Save it as PDF for later use!

Try unrolling a thread yourself!

how to unroll video
  1. Follow @ThreadReaderApp to mention us!

  2. From a Twitter thread mention us with a keyword "unroll"
@threadreaderapp unroll

Practice here first or read more on our help page!

More from @maolesen

Jun 12
1-5
I've been thinking about what is going on at the CDC and reached a theory. I think that many people there are trying to do the right thing. However, just like we are seeing with the public related to COVID, I bet there is a similar psychological phenomenon going on.
2- I'm going to posit that it's actually two different social psychology mechanisms working in synergy with each other.
3- The first is the bystander effect. It's the idea that others will help with a problem if there really was a problem. It's kind of a groupthink induced inertia. I've seen this in action when I saw a pedestrian launched off a car that ran a light.

psychologytoday.com/us/basics/byst…
Read 5 tweets
Jun 9
1-7
Today was the first day I stayed in a hotel since the start of the pandemic. I thought some people might like to know my respiratory protection strategy.
2-

First, I picked a hotel that had individual HVAC connected to the outside. Image
3- When I arrived, I immediately turned that fan on but kept my respirator on. I then did a qualitative assessment of airflow the same way I do in hospitals to verify that positive and negative pressure rooms work correctly.
Read 7 tweets
Jun 6
1-4

I was aware of a huge surge of pertussis in England this year.

gov.uk/government/pub…
Image
2-4
Here's the data for the US. 2022-2024 is still provisional data. Note the big drop in cases in 2020 (green) which is definitely attributable to respiratory protection and social distancing. A lower number also contributed to keeping cases low in subsequent years. Image
3-4
Pay particular attention to 2024 (red). We have almost as many cases as last year already, and summer and fall are when we tend to see the most cases. Image
Read 4 tweets
May 25
1-5

COVID will cause pandemics of chronic disease. I think it will be a number of year before we really have a grasp of the scale of what our indifference has done. One of my questions is who will care for all of these people?
2- The MI Health Council started creating an annual report called the MI Healthcare Workforce Index in 2023. The 2024 report came out just over a week ago.

mhc.org/_files/ugd/71b…
3- I've highlighted a couple of areas where there are shortages (higher scores = bigger shortages). Image
Read 5 tweets
May 21
1-6

I found what CDC is now releasing for COVID data. It's pretty bleak. The data comes from 98 counties in 13 states. They even made a surprising admission. Image
2-

Even someone with zero statistics training would realize that this is not a representative sample by any means and does not characterize meaningful trends, except perhaps in MD. Image
3-
More info is available on the page describing their methodology. It looks to me that they are really just gathering clinical data and not bothering with population impacts.

cdc.gov/coronavirus/20…
Read 6 tweets
May 17
1-4
They pulled the plug. It's official. The well has gone completely dry. These were the two main datasets I used for my state and metro graphs. Image
2-
In my region, I saw that about 80% of the hospitals were still reporting data, so I was hoping I could at least provide that data along with the drop in facilities reporting, like I had done with suspected COVID admissions.
3-
The timing of this is awful. We are seeing the FLiRT variants becoming dominant around the world, but are going in blindly. I also have suspicions that burying the data is a political move. I'm disgusted and disheartened.
Read 4 tweets

Did Thread Reader help you today?

Support us! We are indie developers!


This site is made by just two indie developers on a laptop doing marketing, support and development! Read more about the story.

Become a Premium Member ($3/month or $30/year) and get exclusive features!

Become Premium

Don't want to be a Premium member but still want to support us?

Make a small donation by buying us coffee ($5) or help with server cost ($10)

Donate via Paypal

Or Donate anonymously using crypto!

Ethereum

0xfe58350B80634f60Fa6Dc149a72b4DFbc17D341E copy

Bitcoin

3ATGMxNzCUFzxpMCHL5sWSt4DVtS8UqXpi copy

Thank you for your support!

Follow Us!

:(