A post about:
🔵Canadian COVID-19 data reporting
🔵How the Canadian COVID-19 Forecast has been changing in recent months in response to disappearing data
🔵How we're preparing to do a Forecast even if we lose all weekly reporting except waste water from @GovCanHealth
🔵Canadian COVID-19 data reporting
🔵How the Canadian COVID-19 Forecast has been changing in recent months in response to disappearing data
🔵How we're preparing to do a Forecast even if we lose all weekly reporting except waste water from @GovCanHealth

@GovCanHealth This will be a long post, and we have a three hour meeting starting in 20 min, so you might want to bookmark the thread, because I'll be doing that thing where I ramble on and off for hours.
And I'm deeply angry, which means I'll be on a tear for a while.
And I'm deeply angry, which means I'll be on a tear for a while.
@GovCanHealth I won't translate this thread to French as I write, but if you want a French translation to share with people who don't read English, please let me know.
I (with help from translation volunteers) can do this, but it might take an extra day if the thread is long.
I (with help from translation volunteers) can do this, but it might take an extra day if the thread is long.
@GovCanHealth First, let's look at the number of estimated weekly SARS-CoV-2 infections in Canada from February 2020 to the end of December 2023.
The blue line is estimated weekly infections (with 95% CI range).
The red line is cases publicly reported by provinces.
The blue line is estimated weekly infections (with 95% CI range).
The red line is cases publicly reported by provinces.

@GovCanHealth How many SARS-CoV-2 infections have there been in Canada since the start of 2020?
About 102.6 million, or 2.5 infections for every Canadian.
As you can see, there was an enormous surge in infections from summer to the end of December of 2023, although most of us didn't know.
About 102.6 million, or 2.5 infections for every Canadian.
As you can see, there was an enormous surge in infections from summer to the end of December of 2023, although most of us didn't know.

@GovCanHealth Were these infections benign?
No.
Here's a somewhat complicated graph showing weekly deaths from Feb 2020 to Dec 31, 2023.
I'll explain it after my meeting.
But...in this period there have been about 120,000 non-incidental ("from") COVID-19 deaths in Canada, about 30,000/year
No.
Here's a somewhat complicated graph showing weekly deaths from Feb 2020 to Dec 31, 2023.
I'll explain it after my meeting.
But...in this period there have been about 120,000 non-incidental ("from") COVID-19 deaths in Canada, about 30,000/year

@GovCanHealth Have to start the meeting. I'll be back in a few hours.
Folks, I'm just wiped after the meeting and have to head to bed. I'll start again in the morning though. Early, with a delicious coffee.
Good morning all. The rain is raining and the mosquitoes are biting, in ginormous swarms.
It's a good time to stay indoors with my coffee and continue this thread.
It's a good time to stay indoors with my coffee and continue this thread.
Let's go back to the graph of deaths. I won't do ALT text, but I will describe the graph and others in this thread in the thread text itself, so you will know what's going on if you use ALT text.

In this graph there are four lines.
The red line is COVID-19 deaths reported by provinces.
The gray line is unadjusted excess mortality from @StatCan_eng .
The red line is COVID-19 deaths reported by provinces.
The gray line is unadjusted excess mortality from @StatCan_eng .

@StatCan_eng What are excess deaths?
These are deaths of people who died prematurely--it's the number of reported deaths minus the number expected for the same week in 2015-2019, after adjustment for population growth, aging and other trends from 2015-2019.
StatsCan does this estimate.
These are deaths of people who died prematurely--it's the number of reported deaths minus the number expected for the same week in 2015-2019, after adjustment for population growth, aging and other trends from 2015-2019.
StatsCan does this estimate.

@StatCan_eng We take StatsCan weekly excess deaths we subtract excess deaths attributable to non-COVID-19 causes.
The main source of non-COVID-19 excess in Canada is toxic drug deaths. We get information about those deaths from the @GovCanHealth page linked here: health-infobase.canada.ca/substance-rela…
The main source of non-COVID-19 excess in Canada is toxic drug deaths. We get information about those deaths from the @GovCanHealth page linked here: health-infobase.canada.ca/substance-rela…
@StatCan_eng @GovCanHealth We also get information about toxic drug deaths from provincial pages, which are sometimes updated more quickly than numbers reported to PHAC.
All provinces have a public drug death reporting page, except Newfoundland and Labrador.
All provinces have a public drug death reporting page, except Newfoundland and Labrador.
@StatCan_eng @GovCanHealth Finally, we get information about toxic drug deaths from annual cause of death tables published by Statistics Canada, and from weekly reporting of specific causes of death for some of the top causes of death in Canada (also from Statistics Canada).
@StatCan_eng @GovCanHealth We report on all of this monthly in our public Excess Mortality Tracker.
A little known fact about this tracker, is that every month we calculate excess deaths attributable to all of the top ten causes of death for every single province.
See p29 onward.
covid19resources.ca/public/excess-…
A little known fact about this tracker, is that every month we calculate excess deaths attributable to all of the top ten causes of death for every single province.
See p29 onward.
covid19resources.ca/public/excess-…

@StatCan_eng @GovCanHealth We estimate toxic drug deaths from weekly reporting using combined deaths for accidents and suicide, which are the broad categories under which most toxic drug deaths are placed.
@StatCan_eng @GovCanHealth Estimating excess toxic drug deaths using these categories in the weekly data over-estimates excess drug deaths, because accidents also include excess deaths attributed to falls among adults over 65, which have increased significantly during COVID.
@StatCan_eng @GovCanHealth However, we can correct for this using the detailed annual cause of death data that StatsCan publishes in about Nov of the following year.
Toxic drug death reporting is slow, because of inquests, so over-correction for drug deaths in the most recent year of data balances out.
Toxic drug death reporting is slow, because of inquests, so over-correction for drug deaths in the most recent year of data balances out.
@StatCan_eng @GovCanHealth We also correct for excess deaths that may have been attributable to delays in accessing healthcare and/or MAID.
MAID has historically only been approved for people whose death is forseeable, so most will likely not be excess/untimely, but we still need to correct for this.
MAID has historically only been approved for people whose death is forseeable, so most will likely not be excess/untimely, but we still need to correct for this.
@StatCan_eng @GovCanHealth We correct for excess deaths attributable to non-drug, non-COVID causes by calculating excess deaths attributable to cancer.
85% of MAID is provided for people with cancer, so correcting for excess cancer deaths likely captures most MAID deaths.
85% of MAID is provided for people with cancer, so correcting for excess cancer deaths likely captures most MAID deaths.
@StatCan_eng @GovCanHealth Finally, we correct for other causes of excess deaths, such as heat wave and mass homicide events.
See the gray spike around Jul 1, 2021 in the graph below?
Those are the excess deaths in the BC heat dome.
See the gray spike around Jul 1, 2021 in the graph below?
Those are the excess deaths in the BC heat dome.

@StatCan_eng @GovCanHealth In the deaths graph the gray curve (all, uncorrected excess mortality) spikes above the black curve.
The black curve is COVID-19-specific excess mortality, or total excess mortality (gray) AFTER subtracting excess deaths attributable to drugs, cancer, heat waves, mass homicide.
The black curve is COVID-19-specific excess mortality, or total excess mortality (gray) AFTER subtracting excess deaths attributable to drugs, cancer, heat waves, mass homicide.

@StatCan_eng @GovCanHealth You see how both unadjusted (gray) and COVID-19-specific excess mortality dip a lot each year sometime around December?
That's because historically, more deaths in Canada happen in late fall/winter. The surge in all-cause mortality at this time of year is largely flu/pneumonia.
That's because historically, more deaths in Canada happen in late fall/winter. The surge in all-cause mortality at this time of year is largely flu/pneumonia.

@StatCan_eng @GovCanHealth COVID-19 deaths in fall/winter are less likely to be untimely/excess because some of these people would have died of flu/pneumonia around the same time of year.
More COVID-19 deaths in spring/summer are untimely because fewer people die from flu/pneumonia in these months.
More COVID-19 deaths in spring/summer are untimely because fewer people die from flu/pneumonia in these months.

@StatCan_eng @GovCanHealth Canada's COVID-19 death reporting has declined badly.
The red line shows the COVID deaths reported on provincial pages and in Fig 1 of the PHAC weekly epidemiology report.
The red line shows the COVID deaths reported on provincial pages and in Fig 1 of the PHAC weekly epidemiology report.

@StatCan_eng @GovCanHealth For a brief period at the peak of the winter wave of 2020-2021 Canada reported slightly more COVID-19 deaths than excess deaths.
This was the only period when publicly reported COVID-19 deaths included some incidental ("with" not "from", non-excess, not untimely) COVID-19 deaths
This was the only period when publicly reported COVID-19 deaths included some incidental ("with" not "from", non-excess, not untimely) COVID-19 deaths

@StatCan_eng @GovCanHealth As you can see, public reporting of COVID-19 deaths by provinces (red) is particularly bad in the spring/summer, and after about March of 2022.

@StatCan_eng @GovCanHealth How do we know that what we call COVID-19-specific excess deaths (black line) were likely COVID-19 deaths?
Because provinces report only a fraction of total COVID-19 deaths on provincial pages and in Fig. 1 of the PHAC weekly epidemiology report.
Because provinces report only a fraction of total COVID-19 deaths on provincial pages and in Fig. 1 of the PHAC weekly epidemiology report.

@StatCan_eng @GovCanHealth We estimate total COVID-19 deaths from all sources of COVID-19 death reporting for Canada and provinces (blue line: Estimated total).

@StatCan_eng @GovCanHealth What are the sources of information about COVID-19 deaths in Canada that are NOT reported on provincial pages and in Fig 1 of the PHAC weekly epidemiology report?
@StatCan_eng @GovCanHealth 1. Contemporaneous reporting of COVID-19 deaths by provinces, assembled painstakingly (and painfully) from archived pdf reports available on provincial pages and via the @waybackmachine provided by @internetarchive (thank you, and please donate to them!).
Who did the painstaking, painful collection of contemporaneously reported deaths (and hospital and ICU admissions)?
@netgaines @CircaLiz @BattlingBeaver @sillenojunior @Paparak2
Please thank them. It was a mission of love and fortitude to do this.
@netgaines @CircaLiz @BattlingBeaver @sillenojunior @Paparak2
Please thank them. It was a mission of love and fortitude to do this.
@netgaines @CircaLiz @BattlingBeaver @sillenojunior @Paparak2 2. A second source of Canadian COVID-19 death information?
The @WHO dashboard of COVID-19 data for each country.
DYK more Canadian COVID-19 deaths have been reported to the WHO than are currently reported on provincial pages and in Fig. 1 of the PHAC weekly epidemiology report?
The @WHO dashboard of COVID-19 data for each country.
DYK more Canadian COVID-19 deaths have been reported to the WHO than are currently reported on provincial pages and in Fig. 1 of the PHAC weekly epidemiology report?
@netgaines @CircaLiz @BattlingBeaver @sillenojunior @Paparak2 @WHO 3. A third source of Canadian COVID-19 death information
The Canadian Vital Statistics Death registry (CVS-D), provided by Statistics Canada
The Canadian Vital Statistics Death registry (CVS-D), provided by Statistics Canada
@netgaines @CircaLiz @BattlingBeaver @sillenojunior @Paparak2 @WHO 4. Fourth source of Canadian COVID-19 death data:
Weekly age-specific death (and hospitalization and ICU admission) reporting available in the PHAC weekly epi report.
Weekly age-specific death (and hospitalization and ICU admission) reporting available in the PHAC weekly epi report.
@netgaines @CircaLiz @BattlingBeaver @sillenojunior @Paparak2 @WHO 5. Fifth source of Canadian COVID-19 death data:
The PHAC individual COVID-19 case dataset, shared quarterly by StatsCan. This provides weekly deaths, hospital and ICU admissions.
Caveat: BC hasn't reported since ~Apr of 2023. Deaths are no longer available for Quebec. Grr.
The PHAC individual COVID-19 case dataset, shared quarterly by StatsCan. This provides weekly deaths, hospital and ICU admissions.
Caveat: BC hasn't reported since ~Apr of 2023. Deaths are no longer available for Quebec. Grr.
@netgaines @CircaLiz @BattlingBeaver @sillenojunior @Paparak2 @WHO 6. Sixth source of Canadian COVID-19 death data:
In-hospital COVID-19 deaths reported by @CIHI_ICIS annually for each province, and monthly for Canada.
In-hospital COVID-19 deaths reported by @CIHI_ICIS annually for each province, and monthly for Canada.
@netgaines @CircaLiz @BattlingBeaver @sillenojunior @Paparak2 @WHO @CIHI_ICIS We use CIHI data in three ways to estimate COVID-19 deaths.
a) by calculating how much provinces under-report known in-hospital COVID-19 deaths
b) to estimate COVID-19 deaths from in-hospital deaths from the annual % of all-cause deaths in each province that occur in hospitals
a) by calculating how much provinces under-report known in-hospital COVID-19 deaths
b) to estimate COVID-19 deaths from in-hospital deaths from the annual % of all-cause deaths in each province that occur in hospitals
@netgaines @CircaLiz @BattlingBeaver @sillenojunior @Paparak2 @WHO @CIHI_ICIS c) to calculate in-hospital C19 deaths after correcting for province-specific underascertainment of C19 deaths in CIHI data, by comparing seroprevalence-adjusted hospital admissions/excess death in each province to QC (which reports better) and France (best reporting of G7).
@netgaines @CircaLiz @BattlingBeaver @sillenojunior @Paparak2 @WHO @CIHI_ICIS We assemble weekly COVID-19 deaths from all of these sources, and then subtract the number in each week that are greater than COVID-19-specific excess deaths in the same week to get estimated total "from" COVID-19 deaths each week in Canada (blue line).

@netgaines @CircaLiz @BattlingBeaver @sillenojunior @Paparak2 @WHO @CIHI_ICIS FYI from Feb/20 to Dec 31/23 there were ~138,000 excess deaths in Canada before adjusting for non-COVID-19 causes of death.
The number of estimated COVID-19-specific deaths for this period is ~122,000, meaning ~12% of excess deaths during this period were likely not COVID-19.
The number of estimated COVID-19-specific deaths for this period is ~122,000, meaning ~12% of excess deaths during this period were likely not COVID-19.
@netgaines @CircaLiz @BattlingBeaver @sillenojunior @Paparak2 @WHO @CIHI_ICIS We can compare this figure to other medium-large high income democratic countries with advanced medical systems ("Peer countries").
In the graph shown here, we're comparing the % of total excess deaths accounted for by reported COVID-19 deaths in each country and province.
In the graph shown here, we're comparing the % of total excess deaths accounted for by reported COVID-19 deaths in each country and province.

@netgaines @CircaLiz @BattlingBeaver @sillenojunior @Paparak2 @WHO @CIHI_ICIS The data on the left are the proportion of excess deaths accounted for by reported COVID-19 deaths in peer countries.
The middle data ("Provinces") shows the proportion of excess deaths accounted for by COVID-19 deaths reported by provinces in Fig 1 of the PHAC weekly epi report
The middle data ("Provinces") shows the proportion of excess deaths accounted for by COVID-19 deaths reported by provinces in Fig 1 of the PHAC weekly epi report

@netgaines @CircaLiz @BattlingBeaver @sillenojunior @Paparak2 @WHO @CIHI_ICIS On the right we show COVID-19 deaths for each province estimated from all sources of death reporting ("All sources"). This is the same as "Estimated total" COVID-19 deaths in the weekly deaths graph shown earlier in the thread.

@netgaines @CircaLiz @BattlingBeaver @sillenojunior @Paparak2 @WHO @CIHI_ICIS You can see that ~100% of COVID-19-specific excess mortality in Canada is accounted for by total COVID-19 deaths estimated from all sources.

@netgaines @CircaLiz @BattlingBeaver @sillenojunior @Paparak2 @WHO @CIHI_ICIS Importantly, if we calculate % excess deaths accounted for by total estimated COVID-19 deaths using StatsCan excess mortality that has NOT been corrected for non-COVID-19 excess deaths ("CAN unadjust" in the graph), then we get a percentage somewhere between USA and France.

@netgaines @CircaLiz @BattlingBeaver @sillenojunior @Paparak2 @WHO @CIHI_ICIS So, fewer of Canada's total unadjusted excess deaths are accounted for by estimated total COVID-19 deaths than in UK or France or the UK, but this makes sense.
Why? Because toxic drug deaths are big source of excess mortality in Can and USA, where fentanyl is a major problem.
Why? Because toxic drug deaths are big source of excess mortality in Can and USA, where fentanyl is a major problem.

@netgaines @CircaLiz @BattlingBeaver @sillenojunior @Paparak2 @WHO @CIHI_ICIS OK, I've spent a lot of time on methods, but I want to help people understand how we estimate COVID-19 deaths, and that these estimates are robust and make sense compared to other countries.
Let's go back to the original infection and death graphs to talk about under-reporting.
Let's go back to the original infection and death graphs to talk about under-reporting.
@netgaines @CircaLiz @BattlingBeaver @sillenojunior @Paparak2 @WHO @CIHI_ICIS I have to remind myself of where I was!
Sorry for the technical pitstop, but I have to do it, so that you understand we're actually being conservative in our estimates, and that we're not just waving our hands and conjuring numbers out of thin air.
Sorry for the technical pitstop, but I have to do it, so that you understand we're actually being conservative in our estimates, and that we're not just waving our hands and conjuring numbers out of thin air.
@netgaines @CircaLiz @BattlingBeaver @sillenojunior @Paparak2 @WHO @CIHI_ICIS I also need a pit stop myself, and another coffee.
BRB
BRB
@netgaines @CircaLiz @BattlingBeaver @sillenojunior @Paparak2 @WHO @CIHI_ICIS In this thread, I mainly want to focus on 2023, since what we saw in 2023 is likely what is happening this year, and knowing what is happening in 2024 is important for the Canadian COVID-19 Forecast.
@netgaines @CircaLiz @BattlingBeaver @sillenojunior @Paparak2 @WHO @CIHI_ICIS Heads up--there will be more technical pit stops along the way.
For those frustrated by this, I'm sorry!
For those who want to know how the Forecast works and will work, so you can decide if you trust it, then these technical excursions are for you.
For those frustrated by this, I'm sorry!
For those who want to know how the Forecast works and will work, so you can decide if you trust it, then these technical excursions are for you.
@netgaines @CircaLiz @BattlingBeaver @sillenojunior @Paparak2 @WHO @CIHI_ICIS First, let's talk about infections in 2023 compared to 2022.
But before that, let's talk about how we estimate infections, because this is really important.
But before that, let's talk about how we estimate infections, because this is really important.
@netgaines @CircaLiz @BattlingBeaver @sillenojunior @Paparak2 @WHO @CIHI_ICIS Before ~Jan of 2022, we estimate infections from seroprevalence data from the @COVIDimmunityTF .
The Canadian COVID-19 Immunity Task Force's work ended on December 31, 2023.
The Canadian COVID-19 Immunity Task Force's work ended on December 31, 2023.
@netgaines @CircaLiz @BattlingBeaver @sillenojunior @Paparak2 @WHO @CIHI_ICIS @COVIDimmunityTF Please thank @COVIDimmunityTF for this work, and (many) researchers and blood donors who contributed, including @HemaQuebec and @CanadasLifeline.
Canada's weekly seroprevalence data to the end of 2023 is the best in the world.
covid19immunitytaskforce.ca/seroprevalence…
Canada's weekly seroprevalence data to the end of 2023 is the best in the world.
covid19immunitytaskforce.ca/seroprevalence…
@netgaines @CircaLiz @BattlingBeaver @sillenojunior @Paparak2 @WHO @CIHI_ICIS @COVIDimmunityTF @HemaQuebec @CanadasLifeline The research required to model and understand seroprevalence in Canada is described in the peer-reviewed paper from @CMAJ here.
The work was led by @tmurphEpi and David Buckeridge of @mcgillu but many researchers who are authors on the paper contributed.
cmaj.ca/content/195/31…
The work was led by @tmurphEpi and David Buckeridge of @mcgillu but many researchers who are authors on the paper contributed.
cmaj.ca/content/195/31…
@netgaines @CircaLiz @BattlingBeaver @sillenojunior @Paparak2 @WHO @CIHI_ICIS @COVIDimmunityTF @HemaQuebec @CanadasLifeline @CMAJ @tmurphEpi @mcgillu From Jan/22 onward, we model infections from three data sources. We also used to include seroprevalence estimates from @COVIDimmunityTF but now that this project is done, we've had to adjust our model to work without seroprevalence data.
@netgaines @CircaLiz @BattlingBeaver @sillenojunior @Paparak2 @WHO @CIHI_ICIS @COVIDimmunityTF @HemaQuebec @CanadasLifeline @CMAJ @tmurphEpi @mcgillu Compensating for a world without province-specific seroprevalence data is one of the reasons our model has changed in recent months.
@netgaines @CircaLiz @BattlingBeaver @sillenojunior @Paparak2 @WHO @CIHI_ICIS @COVIDimmunityTF @HemaQuebec @CanadasLifeline @CMAJ @tmurphEpi @mcgillu This is also why there have been fluctuations in infection estimates from one Forecast to the next....we've been trying to balance building and testing a seroprevalence-independent model without stopping forecasts altogether.
As of this week, we're confident we're finally there.
As of this week, we're confident we're finally there.
@netgaines @CircaLiz @BattlingBeaver @sillenojunior @Paparak2 @WHO @CIHI_ICIS @COVIDimmunityTF @HemaQuebec @CanadasLifeline @CMAJ @tmurphEpi @mcgillu How does the new model work?
It's very similar to the previous model, except that seroprevalence data aren't included.
The core of the model is biweekly survey-based surveillance from @INSPQ published on their COVID-19 reporting page for Quebec.
inspq.qc.ca/covid-19/donne…
It's very similar to the previous model, except that seroprevalence data aren't included.
The core of the model is biweekly survey-based surveillance from @INSPQ published on their COVID-19 reporting page for Quebec.
inspq.qc.ca/covid-19/donne…
@netgaines @CircaLiz @BattlingBeaver @sillenojunior @Paparak2 @WHO @CIHI_ICIS @COVIDimmunityTF @HemaQuebec @CanadasLifeline @CMAJ @tmurphEpi @mcgillu @INSPQ @INSPQ does biweekly sampled surveillance surveys asking people in Quebec if they've tested positive for a SARS-CoV-2 infection by PCR or RAT in the preceding week.
They also report syndromic surveillance (people with COVID-like symptoms), but we use their test-positive numbers.
They also report syndromic surveillance (people with COVID-like symptoms), but we use their test-positive numbers.
@netgaines @CircaLiz @BattlingBeaver @sillenojunior @Paparak2 @WHO @CIHI_ICIS @COVIDimmunityTF @HemaQuebec @CanadasLifeline @CMAJ @tmurphEpi @mcgillu @INSPQ We correct these data to reflect the sensitivity of self-administered RATs and the proportion of total estimated infections identified by RAT and PCR.
The RAT sensitivity correction is from an important study conducted by Nova Scotia researchers, including @LisaBarrettID
The RAT sensitivity correction is from an important study conducted by Nova Scotia researchers, including @LisaBarrettID
@netgaines @CircaLiz @BattlingBeaver @sillenojunior @Paparak2 @WHO @CIHI_ICIS @COVIDimmunityTF @HemaQuebec @CanadasLifeline @CMAJ @tmurphEpi @mcgillu @INSPQ @LisaBarrettID Here's the free full-text of the Nova Scotia paper
ncbi.nlm.nih.gov/pmc/articles/P…
ncbi.nlm.nih.gov/pmc/articles/P…
@netgaines @CircaLiz @BattlingBeaver @sillenojunior @Paparak2 @WHO @CIHI_ICIS @COVIDimmunityTF @HemaQuebec @CanadasLifeline @CMAJ @tmurphEpi @mcgillu @INSPQ @LisaBarrettID The first author on this paper was @BarbaraGoodall6 . The senior author was @GPatriquinMD .
Please thank them. They did a smart and important study early in 2022 that is vital to our ongoing work.
Please thank them. They did a smart and important study early in 2022 that is vital to our ongoing work.
@netgaines @CircaLiz @BattlingBeaver @sillenojunior @Paparak2 @WHO @CIHI_ICIS @COVIDimmunityTF @HemaQuebec @CanadasLifeline @CMAJ @tmurphEpi @mcgillu @INSPQ @LisaBarrettID @BarbaraGoodall6 @GPatriquinMD What did they do?
They actually measured the sensitivity of RAT tests when people test themselves (not administered by healthcare workers).
They compared the sensitivity of nasal and throat swabbing alone and together to PCR testing.
They actually measured the sensitivity of RAT tests when people test themselves (not administered by healthcare workers).
They compared the sensitivity of nasal and throat swabbing alone and together to PCR testing.
@netgaines @CircaLiz @BattlingBeaver @sillenojunior @Paparak2 @WHO @CIHI_ICIS @COVIDimmunityTF @HemaQuebec @CanadasLifeline @CMAJ @tmurphEpi @mcgillu @INSPQ @LisaBarrettID @BarbaraGoodall6 @GPatriquinMD They did this work incredibly fast early in Omicron, using some of the most common RATs used in Canada.
And they didn't just rely on vendor sensitivity reports or studies from other countries conducted by healthcare workers who did the swabbing.
And they didn't just rely on vendor sensitivity reports or studies from other countries conducted by healthcare workers who did the swabbing.
@netgaines @CircaLiz @BattlingBeaver @sillenojunior @Paparak2 @WHO @CIHI_ICIS @COVIDimmunityTF @HemaQuebec @CanadasLifeline @CMAJ @tmurphEpi @mcgillu @INSPQ @LisaBarrettID @BarbaraGoodall6 @GPatriquinMD Without this important study, it would be hard(er) to do our work, so thank you.
@netgaines @CircaLiz @BattlingBeaver @sillenojunior @Paparak2 @WHO @CIHI_ICIS @COVIDimmunityTF @HemaQuebec @CanadasLifeline @CMAJ @tmurphEpi @mcgillu @INSPQ @LisaBarrettID @BarbaraGoodall6 @GPatriquinMD Using Quebec survey surveillance data and RAT sensitivity data published by Nova Scotia researchers, we could obtain sensitivity-adjusted weekly infection estimates for Quebec, and from that we could estimate the weekly prevalence of SARS-CoV-2 infections in Quebec.
@netgaines @CircaLiz @BattlingBeaver @sillenojunior @Paparak2 @WHO @CIHI_ICIS @COVIDimmunityTF @HemaQuebec @CanadasLifeline @CMAJ @tmurphEpi @mcgillu @INSPQ @LisaBarrettID @BarbaraGoodall6 @GPatriquinMD We could then compare these prevalence estimates to surveillance-based estimates from the UK, conducted by @ONS and @UKHSA .
From ~Mar 10/22 to Mar 10/23 the UK conducted surveillance by sending healthcare workers to people's homes to collect samples that were then PCR-tested.
From ~Mar 10/22 to Mar 10/23 the UK conducted surveillance by sending healthcare workers to people's homes to collect samples that were then PCR-tested.
@netgaines @CircaLiz @BattlingBeaver @sillenojunior @Paparak2 @WHO @CIHI_ICIS @COVIDimmunityTF @HemaQuebec @CanadasLifeline @CMAJ @tmurphEpi @mcgillu @INSPQ @LisaBarrettID @BarbaraGoodall6 @GPatriquinMD @ONS @UKHSA It was a crucial program that provided the only complete, weekly direct surveillance data for any country in the world during the first year of Omicron.
Our Forecast also depends on the work of many researchers, healthcare workers and volunteers in the UK. Please thank them.
Our Forecast also depends on the work of many researchers, healthcare workers and volunteers in the UK. Please thank them.
@netgaines @CircaLiz @BattlingBeaver @sillenojunior @Paparak2 @WHO @CIHI_ICIS @COVIDimmunityTF @HemaQuebec @CanadasLifeline @CMAJ @tmurphEpi @mcgillu @INSPQ @LisaBarrettID @BarbaraGoodall6 @GPatriquinMD @ONS @UKHSA Why is 2022-2023 UK surveillance data crucial for the Canadian COVID-19 Forecast?
Because we could compare UK infection prevalence data for 2022-2023 to (Nova Scotia team) RAT sensitivity-adjusted @INSPQ survey data from Quebec.
Because we could compare UK infection prevalence data for 2022-2023 to (Nova Scotia team) RAT sensitivity-adjusted @INSPQ survey data from Quebec.
@netgaines @CircaLiz @BattlingBeaver @sillenojunior @Paparak2 @WHO @CIHI_ICIS @COVIDimmunityTF @HemaQuebec @CanadasLifeline @CMAJ @tmurphEpi @mcgillu @INSPQ @LisaBarrettID @BarbaraGoodall6 @GPatriquinMD @ONS @UKHSA From Mar 10/22 to Mar 10/23, average weekly SARS-CoV-2 infection prevalence in Quebec estimated from INSPQ surveillance adjusted for RAT sensitivity was 2.97-/+0.51%.
Average weekly infection prevalence in England during this period from PCR-based surveillance was 2.77-/+0.21%.
Average weekly infection prevalence in England during this period from PCR-based surveillance was 2.77-/+0.21%.
@netgaines @CircaLiz @BattlingBeaver @sillenojunior @Paparak2 @WHO @CIHI_ICIS @COVIDimmunityTF @HemaQuebec @CanadasLifeline @CMAJ @tmurphEpi @mcgillu @INSPQ @LisaBarrettID @BarbaraGoodall6 @GPatriquinMD @ONS @UKHSA Surveillance-based prevalence estimates for QC were 7% higher than in the UK, but seroprevalence data for the UK and Quebec for this period indicate that infections in Quebec were about 7% higher than in England.
@netgaines @CircaLiz @BattlingBeaver @sillenojunior @Paparak2 @WHO @CIHI_ICIS @COVIDimmunityTF @HemaQuebec @CanadasLifeline @CMAJ @tmurphEpi @mcgillu @INSPQ @LisaBarrettID @BarbaraGoodall6 @GPatriquinMD @ONS @UKHSA So, Quebec's survey data closely match what we would expect based on UK surveillance data, after adjusting QC survey data for RAT sensitivity.
Thank you Quebec, Nova Scotia and the UK.
Thank you Quebec, Nova Scotia and the UK.
@netgaines @CircaLiz @BattlingBeaver @sillenojunior @Paparak2 @WHO @CIHI_ICIS @COVIDimmunityTF @HemaQuebec @CanadasLifeline @CMAJ @tmurphEpi @mcgillu @INSPQ @LisaBarrettID @BarbaraGoodall6 @GPatriquinMD @ONS @UKHSA So, we have fantastic data for Quebec, which used and continues to use cheap, survey-based surveillance to provide what turns out to be a really solid estimate of infections in the province.
@netgaines @CircaLiz @BattlingBeaver @sillenojunior @Paparak2 @WHO @CIHI_ICIS @COVIDimmunityTF @HemaQuebec @CanadasLifeline @CMAJ @tmurphEpi @mcgillu @INSPQ @LisaBarrettID @BarbaraGoodall6 @GPatriquinMD @ONS @UKHSA If other provinces chose to do (cheap) survey-based weekly/biweekly surveillance, and chose to publicly report these data, then a big part of our work wouldn't be needed.
Certainly there's money to do regular political polling in each province, but priorities are priorities.
Certainly there's money to do regular political polling in each province, but priorities are priorities.
@netgaines @CircaLiz @BattlingBeaver @sillenojunior @Paparak2 @WHO @CIHI_ICIS @COVIDimmunityTF @HemaQuebec @CanadasLifeline @CMAJ @tmurphEpi @mcgillu @INSPQ @LisaBarrettID @BarbaraGoodall6 @GPatriquinMD @ONS @UKHSA So, we have one piece of important data from one province in Canada.
How do we figure out what's happening in other provinces that don't choose to be aware of SARS-CoV-2 infections, or to publicly share this information?
How do we figure out what's happening in other provinces that don't choose to be aware of SARS-CoV-2 infections, or to publicly share this information?
@netgaines @CircaLiz @BattlingBeaver @sillenojunior @Paparak2 @WHO @CIHI_ICIS @COVIDimmunityTF @HemaQuebec @CanadasLifeline @CMAJ @tmurphEpi @mcgillu @INSPQ @LisaBarrettID @BarbaraGoodall6 @GPatriquinMD @ONS @UKHSA To do this, we have to estimate how much higher or lower infections are in each province in each week compared to Quebec.
@netgaines @CircaLiz @BattlingBeaver @sillenojunior @Paparak2 @WHO @CIHI_ICIS @COVIDimmunityTF @HemaQuebec @CanadasLifeline @CMAJ @tmurphEpi @mcgillu @INSPQ @LisaBarrettID @BarbaraGoodall6 @GPatriquinMD @ONS @UKHSA The first piece of information we use to do this is test positivity rates.
Quebec still tests more per capita than most provinces, and every province has a different strategy.
These testing strategies have changed a lot over time.
Quebec still tests more per capita than most provinces, and every province has a different strategy.
These testing strategies have changed a lot over time.
@netgaines @CircaLiz @BattlingBeaver @sillenojunior @Paparak2 @WHO @CIHI_ICIS @COVIDimmunityTF @HemaQuebec @CanadasLifeline @CMAJ @tmurphEpi @mcgillu @INSPQ @LisaBarrettID @BarbaraGoodall6 @GPatriquinMD @ONS @UKHSA However, testing in all provinces has largely changed in sync, with a sharp decline in Dec-Jan of 2021 to 2022, and further declines to the present.
How much has Canadian testing declined over time?
A LOT.
How much has Canadian testing declined over time?
A LOT.

@netgaines @CircaLiz @BattlingBeaver @sillenojunior @Paparak2 @WHO @CIHI_ICIS @COVIDimmunityTF @HemaQuebec @CanadasLifeline @CMAJ @tmurphEpi @mcgillu @INSPQ @LisaBarrettID @BarbaraGoodall6 @GPatriquinMD @ONS @UKHSA There aren't a lot of testing data available any more for peer countries, but from April to September of 2023, Canada performed nearly 200 times fewer tests per excess death than the median for France, Italy and Spain.

@netgaines @CircaLiz @BattlingBeaver @sillenojunior @Paparak2 @WHO @CIHI_ICIS @COVIDimmunityTF @HemaQuebec @CanadasLifeline @CMAJ @tmurphEpi @mcgillu @INSPQ @LisaBarrettID @BarbaraGoodall6 @GPatriquinMD @ONS @UKHSA We don't actually have information about numbers of tests performed for Canada anymore, because PHAC has been forced to start obtaining testing data directly from select laboratories in each province.
So much for health data-sharing agreements tied to federal funding.
So much for health data-sharing agreements tied to federal funding.
@netgaines @CircaLiz @BattlingBeaver @sillenojunior @Paparak2 @WHO @CIHI_ICIS @COVIDimmunityTF @HemaQuebec @CanadasLifeline @CMAJ @tmurphEpi @mcgillu @INSPQ @LisaBarrettID @BarbaraGoodall6 @GPatriquinMD @ONS @UKHSA However, we do have testing data for much of 2022-2023, when Canada reported about 10 times fewer tests per excess death than peer countries.
This is an angry sidetrack that doesn't help you understand province-specific testing....
This is an angry sidetrack that doesn't help you understand province-specific testing....

@netgaines @CircaLiz @BattlingBeaver @sillenojunior @Paparak2 @WHO @CIHI_ICIS @COVIDimmunityTF @HemaQuebec @CanadasLifeline @CMAJ @tmurphEpi @mcgillu @INSPQ @LisaBarrettID @BarbaraGoodall6 @GPatriquinMD @ONS @UKHSA However, what we do know is that testing declined largely in sync in all provinces during Omicron.
Provinces like Quebec that tested more per capita than most other provinces continued to test about the same amount more per capita than other provinces.
Provinces like Quebec that tested more per capita than most other provinces continued to test about the same amount more per capita than other provinces.
@netgaines @CircaLiz @BattlingBeaver @sillenojunior @Paparak2 @WHO @CIHI_ICIS @COVIDimmunityTF @HemaQuebec @CanadasLifeline @CMAJ @tmurphEpi @mcgillu @INSPQ @LisaBarrettID @BarbaraGoodall6 @GPatriquinMD @ONS @UKHSA To deal with differences across provinces, we compare test positivity within each province each week to test positivity in the same province the week before, to get a weekly % change in test positivity.
@netgaines @CircaLiz @BattlingBeaver @sillenojunior @Paparak2 @WHO @CIHI_ICIS @COVIDimmunityTF @HemaQuebec @CanadasLifeline @CMAJ @tmurphEpi @mcgillu @INSPQ @LisaBarrettID @BarbaraGoodall6 @GPatriquinMD @ONS @UKHSA Except from Dec/21-Jan/22, when weekly % change in test positivity changed dramatically on slightly different times scales for each province, this metric has tracked closely with weekly % change in reported cases, deaths and hospital admissions.
@netgaines @CircaLiz @BattlingBeaver @sillenojunior @Paparak2 @WHO @CIHI_ICIS @COVIDimmunityTF @HemaQuebec @CanadasLifeline @CMAJ @tmurphEpi @mcgillu @INSPQ @LisaBarrettID @BarbaraGoodall6 @GPatriquinMD @ONS @UKHSA But, from Dec/21 to early Jan/22 our infection estimate model is based on seroprevalence anyway, since QC survey data were not yet available, so sudden week to week changes in testing policy don't affect our estimates.
@netgaines @CircaLiz @BattlingBeaver @sillenojunior @Paparak2 @WHO @CIHI_ICIS @COVIDimmunityTF @HemaQuebec @CanadasLifeline @CMAJ @tmurphEpi @mcgillu @INSPQ @LisaBarrettID @BarbaraGoodall6 @GPatriquinMD @ONS @UKHSA From all of this, we get a weekly % change in test positivity for each province that is internally consistent with that province's testing policies.
@netgaines @CircaLiz @BattlingBeaver @sillenojunior @Paparak2 @WHO @CIHI_ICIS @COVIDimmunityTF @HemaQuebec @CanadasLifeline @CMAJ @tmurphEpi @mcgillu @INSPQ @LisaBarrettID @BarbaraGoodall6 @GPatriquinMD @ONS @UKHSA If weekly change in TPR (test positivity rate) was 1.00% in a given week in Quebec, but was 1.05% in Manitoba, then we would multiply QC survey-based infection estimates by 5% for Manitoba for the same week.
@netgaines @CircaLiz @BattlingBeaver @sillenojunior @Paparak2 @WHO @CIHI_ICIS @COVIDimmunityTF @HemaQuebec @CanadasLifeline @CMAJ @tmurphEpi @mcgillu @INSPQ @LisaBarrettID @BarbaraGoodall6 @GPatriquinMD @ONS @UKHSA There are benefits and drawbacks to this method.
A benefit is that TPR generally reflects the whole province.
Weekly changes in TPR are still one of the most sensitive predictors of increasing and decreasing infections in Canada.
A benefit is that TPR generally reflects the whole province.
Weekly changes in TPR are still one of the most sensitive predictors of increasing and decreasing infections in Canada.
@netgaines @CircaLiz @BattlingBeaver @sillenojunior @Paparak2 @WHO @CIHI_ICIS @COVIDimmunityTF @HemaQuebec @CanadasLifeline @CMAJ @tmurphEpi @mcgillu @INSPQ @LisaBarrettID @BarbaraGoodall6 @GPatriquinMD @ONS @UKHSA However, TPR now generally reflects only infections in people at higher risk of serious COVID-19 outcomes, since almost no one else can access PCR testing.
@netgaines @CircaLiz @BattlingBeaver @sillenojunior @Paparak2 @WHO @CIHI_ICIS @COVIDimmunityTF @HemaQuebec @CanadasLifeline @CMAJ @tmurphEpi @mcgillu @INSPQ @LisaBarrettID @BarbaraGoodall6 @GPatriquinMD @ONS @UKHSA When weekly seroprevalence data were available, we used to calculate weekly changes in seroprevalence in each province compare to weekly changes in seroprevalence in Eastern Canada (reflecting changes in Quebec and Ontario).
This provided info about infections in blood donors.
This provided info about infections in blood donors.
@netgaines @CircaLiz @BattlingBeaver @sillenojunior @Paparak2 @WHO @CIHI_ICIS @COVIDimmunityTF @HemaQuebec @CanadasLifeline @CMAJ @tmurphEpi @mcgillu @INSPQ @LisaBarrettID @BarbaraGoodall6 @GPatriquinMD @ONS @UKHSA Since blood donors are generally healthy and many younger people donate blood, age-adjusted seroprevalence estimates for each province provided a "window" on infections in a more general population than TPR.
But we can't use these data anymore (sadly).
But we can't use these data anymore (sadly).
@netgaines @CircaLiz @BattlingBeaver @sillenojunior @Paparak2 @WHO @CIHI_ICIS @COVIDimmunityTF @HemaQuebec @CanadasLifeline @CMAJ @tmurphEpi @mcgillu @INSPQ @LisaBarrettID @BarbaraGoodall6 @GPatriquinMD @ONS @UKHSA Another source of information about infections in the whole population is waste water.
We use waste water data from @GovCanHealth in our model, because it's collected and analyzed using methods that are standardized across provinces.
We use waste water data from @GovCanHealth in our model, because it's collected and analyzed using methods that are standardized across provinces.
@netgaines @CircaLiz @BattlingBeaver @sillenojunior @Paparak2 @WHO @CIHI_ICIS @COVIDimmunityTF @HemaQuebec @CanadasLifeline @CMAJ @tmurphEpi @mcgillu @INSPQ @LisaBarrettID @BarbaraGoodall6 @GPatriquinMD @ONS @UKHSA @GovCanHealth For each site in Canada for which PHAC waste water data are available, we calculate 5 week mid-aligned averages of the 7-day averages reported by PHAC (to reduce noise in the data).
Then we set upper and lower limits.
Then we set upper and lower limits.
@netgaines @CircaLiz @BattlingBeaver @sillenojunior @Paparak2 @WHO @CIHI_ICIS @COVIDimmunityTF @HemaQuebec @CanadasLifeline @CMAJ @tmurphEpi @mcgillu @INSPQ @LisaBarrettID @BarbaraGoodall6 @GPatriquinMD @ONS @UKHSA @GovCanHealth In UK surveillance data from 2022 to March of 2024, the highest and lowest weekly prevalence estimates are about 3.2-fold higher and lower than the median weekly prevalence for the same period.
@netgaines @CircaLiz @BattlingBeaver @sillenojunior @Paparak2 @WHO @CIHI_ICIS @COVIDimmunityTF @HemaQuebec @CanadasLifeline @CMAJ @tmurphEpi @mcgillu @INSPQ @LisaBarrettID @BarbaraGoodall6 @GPatriquinMD @ONS @UKHSA @GovCanHealth For QC survey-based surveillance data and waste water data for each province we set upper and lower limits of 3.2-fold above and below the average weekly median from March 2022 to the present.
@netgaines @CircaLiz @BattlingBeaver @sillenojunior @Paparak2 @WHO @CIHI_ICIS @COVIDimmunityTF @HemaQuebec @CanadasLifeline @CMAJ @tmurphEpi @mcgillu @INSPQ @LisaBarrettID @BarbaraGoodall6 @GPatriquinMD @ONS @UKHSA @GovCanHealth This is important for reducing the spikiness of waste water data, and establishing the same dynamic range as survey surveillance data.
And pardon me, that's 3.4-fold above and below the median, not 3.2-fold.
And pardon me, that's 3.4-fold above and below the median, not 3.2-fold.
@netgaines @CircaLiz @BattlingBeaver @sillenojunior @Paparak2 @WHO @CIHI_ICIS @COVIDimmunityTF @HemaQuebec @CanadasLifeline @CMAJ @tmurphEpi @mcgillu @INSPQ @LisaBarrettID @BarbaraGoodall6 @GPatriquinMD @ONS @UKHSA @GovCanHealth For clarity, we also calculate 5w averages for all other input data in the model, including survey surveillance and test positivity rates, so we're comparing apples to apples as much as possible.
And when we calculate the range for UK prevalence, we also use 5w averages.
And when we calculate the range for UK prevalence, we also use 5w averages.
@netgaines @CircaLiz @BattlingBeaver @sillenojunior @Paparak2 @WHO @CIHI_ICIS @COVIDimmunityTF @HemaQuebec @CanadasLifeline @CMAJ @tmurphEpi @mcgillu @INSPQ @LisaBarrettID @BarbaraGoodall6 @GPatriquinMD @ONS @UKHSA @GovCanHealth Once we've done this with waste water data, we can compare weekly % change in waste water for the waste water sites in each province (after weighting waste water sources within each province for the size of the population they serve) to weekly % change in waste water in QC.
@netgaines @CircaLiz @BattlingBeaver @sillenojunior @Paparak2 @WHO @CIHI_ICIS @COVIDimmunityTF @HemaQuebec @CanadasLifeline @CMAJ @tmurphEpi @mcgillu @INSPQ @LisaBarrettID @BarbaraGoodall6 @GPatriquinMD @ONS @UKHSA @GovCanHealth If the population-weighted average weekly % change in waste water signal for Saskatchewan is 5% less than the average weekly % change in waste water for Quebec, then we multiply QC survey-based infections by 0.95% (and adjust for differences in population sizes in each province).
@netgaines @CircaLiz @BattlingBeaver @sillenojunior @Paparak2 @WHO @CIHI_ICIS @COVIDimmunityTF @HemaQuebec @CanadasLifeline @CMAJ @tmurphEpi @mcgillu @INSPQ @LisaBarrettID @BarbaraGoodall6 @GPatriquinMD @ONS @UKHSA @GovCanHealth It's a little simpler than this.
Basically, we average the % weekly change in TPR in each province compared to QC, with the % weekly change in waste water in each province compared to QC, to get an average value that we use to adjust QC surveillance data for each province.
Basically, we average the % weekly change in TPR in each province compared to QC, with the % weekly change in waste water in each province compared to QC, to get an average value that we use to adjust QC surveillance data for each province.
@netgaines @CircaLiz @BattlingBeaver @sillenojunior @Paparak2 @WHO @CIHI_ICIS @COVIDimmunityTF @HemaQuebec @CanadasLifeline @CMAJ @tmurphEpi @mcgillu @INSPQ @LisaBarrettID @BarbaraGoodall6 @GPatriquinMD @ONS @UKHSA @GovCanHealth We used to also have weekly % change in seroprevalence. With a third input variable the data were smoother, because the effects of the "spikiness" of waste water data were reduced.
@netgaines @CircaLiz @BattlingBeaver @sillenojunior @Paparak2 @WHO @CIHI_ICIS @COVIDimmunityTF @HemaQuebec @CanadasLifeline @CMAJ @tmurphEpi @mcgillu @INSPQ @LisaBarrettID @BarbaraGoodall6 @GPatriquinMD @ONS @UKHSA @GovCanHealth What we've spent the last 6 months doing is trying different methods to smooth waste water data because our estimates were more herky-jerky without seroprevalence.
At one point we used the 25-75th percentile range of values for waste water, but the dynamic range was too small.
At one point we used the 25-75th percentile range of values for waste water, but the dynamic range was too small.
@netgaines @CircaLiz @BattlingBeaver @sillenojunior @Paparak2 @WHO @CIHI_ICIS @COVIDimmunityTF @HemaQuebec @CanadasLifeline @CMAJ @tmurphEpi @mcgillu @INSPQ @LisaBarrettID @BarbaraGoodall6 @GPatriquinMD @ONS @UKHSA @GovCanHealth Then we messed around with log-transforming waste water data to make them more linear (again dynamic range was too small), and a whole raft of ways to set upper and lower limits based on percentile ranges.
@netgaines @CircaLiz @BattlingBeaver @sillenojunior @Paparak2 @WHO @CIHI_ICIS @COVIDimmunityTF @HemaQuebec @CanadasLifeline @CMAJ @tmurphEpi @mcgillu @INSPQ @LisaBarrettID @BarbaraGoodall6 @GPatriquinMD @ONS @UKHSA @GovCanHealth After much gritting of teeth setting different types of limits and running the f'ing models over and over we arrived at our current method of setting the upper and lower limits of all input data sets based on the dynamic range above and below the median in UK data.
@netgaines @CircaLiz @BattlingBeaver @sillenojunior @Paparak2 @WHO @CIHI_ICIS @COVIDimmunityTF @HemaQuebec @CanadasLifeline @CMAJ @tmurphEpi @mcgillu @INSPQ @LisaBarrettID @BarbaraGoodall6 @GPatriquinMD @ONS @UKHSA @GovCanHealth How do we test whether these models are working well enough or not?
By comparing % excess mortality each week predicted by the model to actual % excess mortality (COVID-19-specific excess, after removing non-COVID sources of excess death).
By comparing % excess mortality each week predicted by the model to actual % excess mortality (COVID-19-specific excess, after removing non-COVID sources of excess death).
@netgaines @CircaLiz @BattlingBeaver @sillenojunior @Paparak2 @WHO @CIHI_ICIS @COVIDimmunityTF @HemaQuebec @CanadasLifeline @CMAJ @tmurphEpi @mcgillu @INSPQ @LisaBarrettID @BarbaraGoodall6 @GPatriquinMD @ONS @UKHSA @GovCanHealth If you ever want to see how the modelling battle is going, the data are updated live as we struggle. You can find them on p14 of the biweekly Canadian COVID-19 data report that accompanies our biweekly Forecast.
covid19resources.ca/covid-hazard-i…
covid19resources.ca/covid-hazard-i…

@netgaines @CircaLiz @BattlingBeaver @sillenojunior @Paparak2 @WHO @CIHI_ICIS @COVIDimmunityTF @HemaQuebec @CanadasLifeline @CMAJ @tmurphEpi @mcgillu @INSPQ @LisaBarrettID @BarbaraGoodall6 @GPatriquinMD @ONS @UKHSA @GovCanHealth When I'm looking at this page, there are a few things I'm always eyeballing.
First, does excess mortality estimated from our model (gold line) and from waste water (teal line) have a similar dynamic range as actual excess mortality (pink line)?
First, does excess mortality estimated from our model (gold line) and from waste water (teal line) have a similar dynamic range as actual excess mortality (pink line)?

@netgaines @CircaLiz @BattlingBeaver @sillenojunior @Paparak2 @WHO @CIHI_ICIS @COVIDimmunityTF @HemaQuebec @CanadasLifeline @CMAJ @tmurphEpi @mcgillu @INSPQ @LisaBarrettID @BarbaraGoodall6 @GPatriquinMD @ONS @UKHSA @GovCanHealth I compare Jul 9/22 (the week when PHAC waste water data first started including internal controls) to Sep 2/23 (the last date when we have excess mortality from StatsCan).
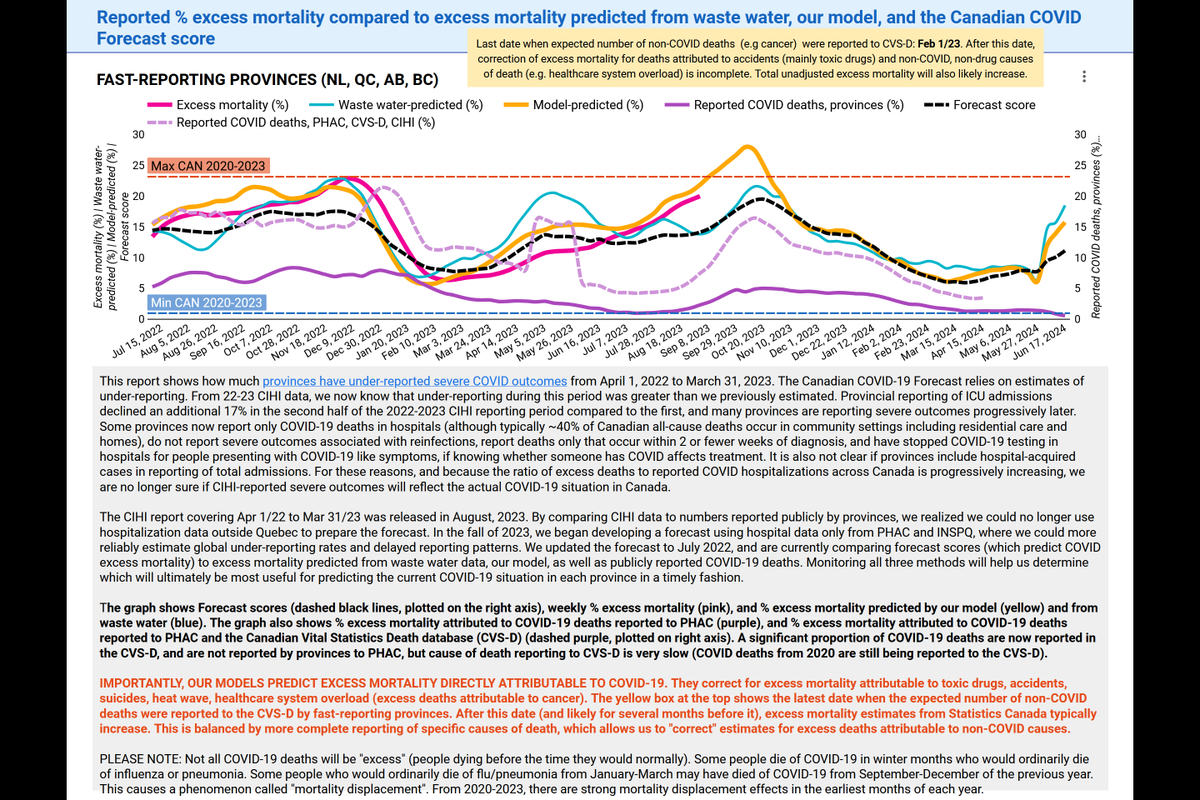
@netgaines @CircaLiz @BattlingBeaver @sillenojunior @Paparak2 @WHO @CIHI_ICIS @COVIDimmunityTF @HemaQuebec @CanadasLifeline @CMAJ @tmurphEpi @mcgillu @INSPQ @LisaBarrettID @BarbaraGoodall6 @GPatriquinMD @ONS @UKHSA @GovCanHealth We do this comparison for the Canadian provinces that report all-cause mortality fastest (NL, QC, AB, BC), to get a more complete picture of the range we'd expect.

@netgaines @CircaLiz @BattlingBeaver @sillenojunior @Paparak2 @WHO @CIHI_ICIS @COVIDimmunityTF @HemaQuebec @CanadasLifeline @CMAJ @tmurphEpi @mcgillu @INSPQ @LisaBarrettID @BarbaraGoodall6 @GPatriquinMD @ONS @UKHSA @GovCanHealth During this period, the highest % excess mortality peak was 3.4 times higher than the lowest % excess mortality trough (pink line).
I'll get into why this dynamic range is smaller than the dynamic range of infections a bit later.
I'll get into why this dynamic range is smaller than the dynamic range of infections a bit later.
@netgaines @CircaLiz @BattlingBeaver @sillenojunior @Paparak2 @WHO @CIHI_ICIS @COVIDimmunityTF @HemaQuebec @CanadasLifeline @CMAJ @tmurphEpi @mcgillu @INSPQ @LisaBarrettID @BarbaraGoodall6 @GPatriquinMD @ONS @UKHSA @GovCanHealth But first, let's look at the dynamic range of excess mortality predicted by our model (gold line) compared to actual excess mortality.
From Jul 9/22 to Sep 2/23 the dynamic range for our model is 3.8-fold--about 12% greater than excess mortality.
From Jul 9/22 to Sep 2/23 the dynamic range for our model is 3.8-fold--about 12% greater than excess mortality.

@netgaines @CircaLiz @BattlingBeaver @sillenojunior @Paparak2 @WHO @CIHI_ICIS @COVIDimmunityTF @HemaQuebec @CanadasLifeline @CMAJ @tmurphEpi @mcgillu @INSPQ @LisaBarrettID @BarbaraGoodall6 @GPatriquinMD @ONS @UKHSA @GovCanHealth There are still excess deaths coming in for Dec/22 so the model may be closer to actual excess deaths--it's pretty close, though.
The dynamic range of excess mortality predicted from waste water alone is 3.3-fold, about 3% less than the dynamic range of excess mortality itself.
The dynamic range of excess mortality predicted from waste water alone is 3.3-fold, about 3% less than the dynamic range of excess mortality itself.

@netgaines @CircaLiz @BattlingBeaver @sillenojunior @Paparak2 @WHO @CIHI_ICIS @COVIDimmunityTF @HemaQuebec @CanadasLifeline @CMAJ @tmurphEpi @mcgillu @INSPQ @LisaBarrettID @BarbaraGoodall6 @GPatriquinMD @ONS @UKHSA @GovCanHealth I'm particularly happy that the dynamic range of excess mortality predicted from waste water-estimated infections alone is really close to actual excess mortality.
@netgaines @CircaLiz @BattlingBeaver @sillenojunior @Paparak2 @WHO @CIHI_ICIS @COVIDimmunityTF @HemaQuebec @CanadasLifeline @CMAJ @tmurphEpi @mcgillu @INSPQ @LisaBarrettID @BarbaraGoodall6 @GPatriquinMD @ONS @UKHSA @GovCanHealth Why? Because if one day we lose weekly/biweekly QC survey data and weekly test positivity rate data for provinces from PHAC, then I think we're getting closer to doing a forecast using waste water alone.
@netgaines @CircaLiz @BattlingBeaver @sillenojunior @Paparak2 @WHO @CIHI_ICIS @COVIDimmunityTF @HemaQuebec @CanadasLifeline @CMAJ @tmurphEpi @mcgillu @INSPQ @LisaBarrettID @BarbaraGoodall6 @GPatriquinMD @ONS @UKHSA @GovCanHealth And I suspect we may lose weekly TPR data sooner rather than later, especially now that ON has announced it's downgrading notification requirements for COVID-19 so that fewer data must be reported to the CMOH (hi Kieran....you can call if you want) and by the CMOH to the public.
@netgaines @CircaLiz @BattlingBeaver @sillenojunior @Paparak2 @WHO @CIHI_ICIS @COVIDimmunityTF @HemaQuebec @CanadasLifeline @CMAJ @tmurphEpi @mcgillu @INSPQ @LisaBarrettID @BarbaraGoodall6 @GPatriquinMD @ONS @UKHSA @GovCanHealth So, I've been going around the clock (and the team of volunteers has too) to get ready for the day when we have nothing left but waste water to work with.
To say I (and everyone else) is absolutely ^@^%&WWYWR^E^E*&$^YA!!!!!!!!!!!!!! (f'ing) exhausted is an epic understatement.
To say I (and everyone else) is absolutely ^@^%&WWYWR^E^E*&$^YA!!!!!!!!!!!!!! (f'ing) exhausted is an epic understatement.
@netgaines @CircaLiz @BattlingBeaver @sillenojunior @Paparak2 @WHO @CIHI_ICIS @COVIDimmunityTF @HemaQuebec @CanadasLifeline @CMAJ @tmurphEpi @mcgillu @INSPQ @LisaBarrettID @BarbaraGoodall6 @GPatriquinMD @ONS @UKHSA @GovCanHealth We still have to tweak waste water predictions of COVID-19 excess mortality, but I think we're down to the last variables to incorporate, including the seasonality of mortality patterns in each province (thank you StatsCan, for everything you do and share) and vaccine protection.
@netgaines @CircaLiz @BattlingBeaver @sillenojunior @Paparak2 @WHO @CIHI_ICIS @COVIDimmunityTF @HemaQuebec @CanadasLifeline @CMAJ @tmurphEpi @mcgillu @INSPQ @LisaBarrettID @BarbaraGoodall6 @GPatriquinMD @ONS @UKHSA @GovCanHealth We have a LOT of Omicron data for Canada now. Excess mortality in particular became more predictable after 2022, once most of the Canadian population had been infected.
Once we can predict excess mortality accurately, we also know how many hospital and ICU admissions to expect.
Once we can predict excess mortality accurately, we also know how many hospital and ICU admissions to expect.
@netgaines @CircaLiz @BattlingBeaver @sillenojunior @Paparak2 @WHO @CIHI_ICIS @COVIDimmunityTF @HemaQuebec @CanadasLifeline @CMAJ @tmurphEpi @mcgillu @INSPQ @LisaBarrettID @BarbaraGoodall6 @GPatriquinMD @ONS @UKHSA @GovCanHealth I spend a LOT of time figuring out how to estimate and predict hospital and ICU admissions, and we have a pretty decent ballpark estimate for long COVID, based on estimated infection numbers.
We're not quite there yet, but we're finally really close.
It only took us 2 years...
We're not quite there yet, but we're finally really close.
It only took us 2 years...
@netgaines @CircaLiz @BattlingBeaver @sillenojunior @Paparak2 @WHO @CIHI_ICIS @COVIDimmunityTF @HemaQuebec @CanadasLifeline @CMAJ @tmurphEpi @mcgillu @INSPQ @LisaBarrettID @BarbaraGoodall6 @GPatriquinMD @ONS @UKHSA @GovCanHealth A critical part of this work has been figuring out how many deaths and hospital and ICU admissions have actually occurred in Canada, and how many per infection.
This is why we monitor Canadian COVID-19 data reporting like raccoons on trash cans.
This is why we monitor Canadian COVID-19 data reporting like raccoons on trash cans.
@netgaines @CircaLiz @BattlingBeaver @sillenojunior @Paparak2 @WHO @CIHI_ICIS @COVIDimmunityTF @HemaQuebec @CanadasLifeline @CMAJ @tmurphEpi @mcgillu @INSPQ @LisaBarrettID @BarbaraGoodall6 @GPatriquinMD @ONS @UKHSA @GovCanHealth If we know how much under-reporting is happening, and how this varies by season (which it does--Canadian COVID data reporting is beyond terrible in spring and especially summer), then we can take the little data that are still reported and work with it.
@netgaines @CircaLiz @BattlingBeaver @sillenojunior @Paparak2 @WHO @CIHI_ICIS @COVIDimmunityTF @HemaQuebec @CanadasLifeline @CMAJ @tmurphEpi @mcgillu @INSPQ @LisaBarrettID @BarbaraGoodall6 @GPatriquinMD @ONS @UKHSA @GovCanHealth This brings me to a big change in the Forecast this week (which I'll post later today).
It's me posting the Forecast thread today, not the irrepressible @BattlingBeaver , who is recovering from emergency appendectomy and can't sit upright long enough to do the biweekly thread.
It's me posting the Forecast thread today, not the irrepressible @BattlingBeaver , who is recovering from emergency appendectomy and can't sit upright long enough to do the biweekly thread.
@netgaines @CircaLiz @BattlingBeaver @sillenojunior @Paparak2 @WHO @CIHI_ICIS @COVIDimmunityTF @HemaQuebec @CanadasLifeline @CMAJ @tmurphEpi @mcgillu @INSPQ @LisaBarrettID @BarbaraGoodall6 @GPatriquinMD @ONS @UKHSA @GovCanHealth The forecast thread today will be shorter than usual--just the highlights. I've spent many hours on twitter already.
@netgaines @CircaLiz @BattlingBeaver @sillenojunior @Paparak2 @WHO @CIHI_ICIS @COVIDimmunityTF @HemaQuebec @CanadasLifeline @CMAJ @tmurphEpi @mcgillu @INSPQ @LisaBarrettID @BarbaraGoodall6 @GPatriquinMD @ONS @UKHSA @GovCanHealth But there have been two big changes in the Forecast this week, and the scores have gone up quite a bit compared to two weeks ago.
@netgaines @CircaLiz @BattlingBeaver @sillenojunior @Paparak2 @WHO @CIHI_ICIS @COVIDimmunityTF @HemaQuebec @CanadasLifeline @CMAJ @tmurphEpi @mcgillu @INSPQ @LisaBarrettID @BarbaraGoodall6 @GPatriquinMD @ONS @UKHSA @GovCanHealth Part of that is because infection severity is increasing, part of it is because the dynamic range of infection estimates 2 weeks ago was too high (our infection estimates 2 weeks ago were too low, as you probably noticed because it was a big drop from 4 weeks ago).
@netgaines @CircaLiz @BattlingBeaver @sillenojunior @Paparak2 @WHO @CIHI_ICIS @COVIDimmunityTF @HemaQuebec @CanadasLifeline @CMAJ @tmurphEpi @mcgillu @INSPQ @LisaBarrettID @BarbaraGoodall6 @GPatriquinMD @ONS @UKHSA @GovCanHealth But, one of the biggest changes is because new CVS-D data came out, and despite our best efforts, we were still under-estimating just how much provinces under-reported known COVID-19 deaths in the first few months of 2024.
So, Forecast scores have gone up...
So, Forecast scores have gone up...
@netgaines @CircaLiz @BattlingBeaver @sillenojunior @Paparak2 @WHO @CIHI_ICIS @COVIDimmunityTF @HemaQuebec @CanadasLifeline @CMAJ @tmurphEpi @mcgillu @INSPQ @LisaBarrettID @BarbaraGoodall6 @GPatriquinMD @ONS @UKHSA @GovCanHealth I'm not going to talk about how we estimate hospitalization under-reporting in today's thread, because I'm getting tired and losing steam.
But I do want to talk briefly about why excess mortality was still so high in 2023, and why I don't think this has changed in 2024.
But I do want to talk briefly about why excess mortality was still so high in 2023, and why I don't think this has changed in 2024.

@netgaines @CircaLiz @BattlingBeaver @sillenojunior @Paparak2 @WHO @CIHI_ICIS @COVIDimmunityTF @HemaQuebec @CanadasLifeline @CMAJ @tmurphEpi @mcgillu @INSPQ @LisaBarrettID @BarbaraGoodall6 @GPatriquinMD @ONS @UKHSA @GovCanHealth From our model, we estimate there were ~37% fewer SARS-CoV-2 infections in 2023 than 2022.
But, estimated COVID-19 excess mortality fell by only 11%. The decline is likely smaller, since there is still considerable outstanding mortality reporting for 2023.
But, estimated COVID-19 excess mortality fell by only 11%. The decline is likely smaller, since there is still considerable outstanding mortality reporting for 2023.
@netgaines @CircaLiz @BattlingBeaver @sillenojunior @Paparak2 @WHO @CIHI_ICIS @COVIDimmunityTF @HemaQuebec @CanadasLifeline @CMAJ @tmurphEpi @mcgillu @INSPQ @LisaBarrettID @BarbaraGoodall6 @GPatriquinMD @ONS @UKHSA @GovCanHealth Similarly, in the UK, where estimated SARS-CoV-2 infections fell from 2022 to 2023, annual excess deaths estimated by the Economist actually increased in 2023 compared to 2022.
Why?
Why?
@netgaines @CircaLiz @BattlingBeaver @sillenojunior @Paparak2 @WHO @CIHI_ICIS @COVIDimmunityTF @HemaQuebec @CanadasLifeline @CMAJ @tmurphEpi @mcgillu @INSPQ @LisaBarrettID @BarbaraGoodall6 @GPatriquinMD @ONS @UKHSA @GovCanHealth This is not a trivial question.
Let's look at how COVID-19 deaths in Canada in 2022 compared to other causes of death, recognizing that COVID-19 deaths in 2023 were likely similar to 2022.
Let's look at how COVID-19 deaths in Canada in 2022 compared to other causes of death, recognizing that COVID-19 deaths in 2023 were likely similar to 2022.
@netgaines @CircaLiz @BattlingBeaver @sillenojunior @Paparak2 @WHO @CIHI_ICIS @COVIDimmunityTF @HemaQuebec @CanadasLifeline @CMAJ @tmurphEpi @mcgillu @INSPQ @LisaBarrettID @BarbaraGoodall6 @GPatriquinMD @ONS @UKHSA @GovCanHealth We have these data courtesy again of StatsCan. 2023 cause of death data won't be out until ~Nov of 2024.
@netgaines @CircaLiz @BattlingBeaver @sillenojunior @Paparak2 @WHO @CIHI_ICIS @COVIDimmunityTF @HemaQuebec @CanadasLifeline @CMAJ @tmurphEpi @mcgillu @INSPQ @LisaBarrettID @BarbaraGoodall6 @GPatriquinMD @ONS @UKHSA @GovCanHealth To do this we're ONLY going to focus on COVID-19 deaths reported in the CVS-D. We know these COVID-19 deaths are probably nearly 2X higher than reported so far, but let's be conservative.
@netgaines @CircaLiz @BattlingBeaver @sillenojunior @Paparak2 @WHO @CIHI_ICIS @COVIDimmunityTF @HemaQuebec @CanadasLifeline @CMAJ @tmurphEpi @mcgillu @INSPQ @LisaBarrettID @BarbaraGoodall6 @GPatriquinMD @ONS @UKHSA @GovCanHealth First, let's look at reported COVID-19 deaths in 2022 compared to deaths attributed to other infectious diseases/infections.
There were 1.7 times more reported COVID-19 deaths than deaths from all other infections combined, ~3.7X more including C19 deaths not yet reported.
There were 1.7 times more reported COVID-19 deaths than deaths from all other infections combined, ~3.7X more including C19 deaths not yet reported.

@netgaines @CircaLiz @BattlingBeaver @sillenojunior @Paparak2 @WHO @CIHI_ICIS @COVIDimmunityTF @HemaQuebec @CanadasLifeline @CMAJ @tmurphEpi @mcgillu @INSPQ @LisaBarrettID @BarbaraGoodall6 @GPatriquinMD @ONS @UKHSA @GovCanHealth Now let's look at COVID-19 deaths compared to the top 25 specific causes of death in Canada in 2022.
My table is from a manuscript in prep and it's long and skinny, so you won't be able to see COVID-19 deaths in this screenshot.
Recall: 19,716 reported in CVS-D, ~41,511 actual.
My table is from a manuscript in prep and it's long and skinny, so you won't be able to see COVID-19 deaths in this screenshot.
Recall: 19,716 reported in CVS-D, ~41,511 actual.

@netgaines @CircaLiz @BattlingBeaver @sillenojunior @Paparak2 @WHO @CIHI_ICIS @COVIDimmunityTF @HemaQuebec @CanadasLifeline @CMAJ @tmurphEpi @mcgillu @INSPQ @LisaBarrettID @BarbaraGoodall6 @GPatriquinMD @ONS @UKHSA @GovCanHealth First toxic drug deaths in 2022.
A lot of these haven't come in to the CVS-D yet, but so far 6,693. That's mainly people younger than 65 BTW. And we're still fighting about harm reduction and safer supply.
A lot of these haven't come in to the CVS-D yet, but so far 6,693. That's mainly people younger than 65 BTW. And we're still fighting about harm reduction and safer supply.
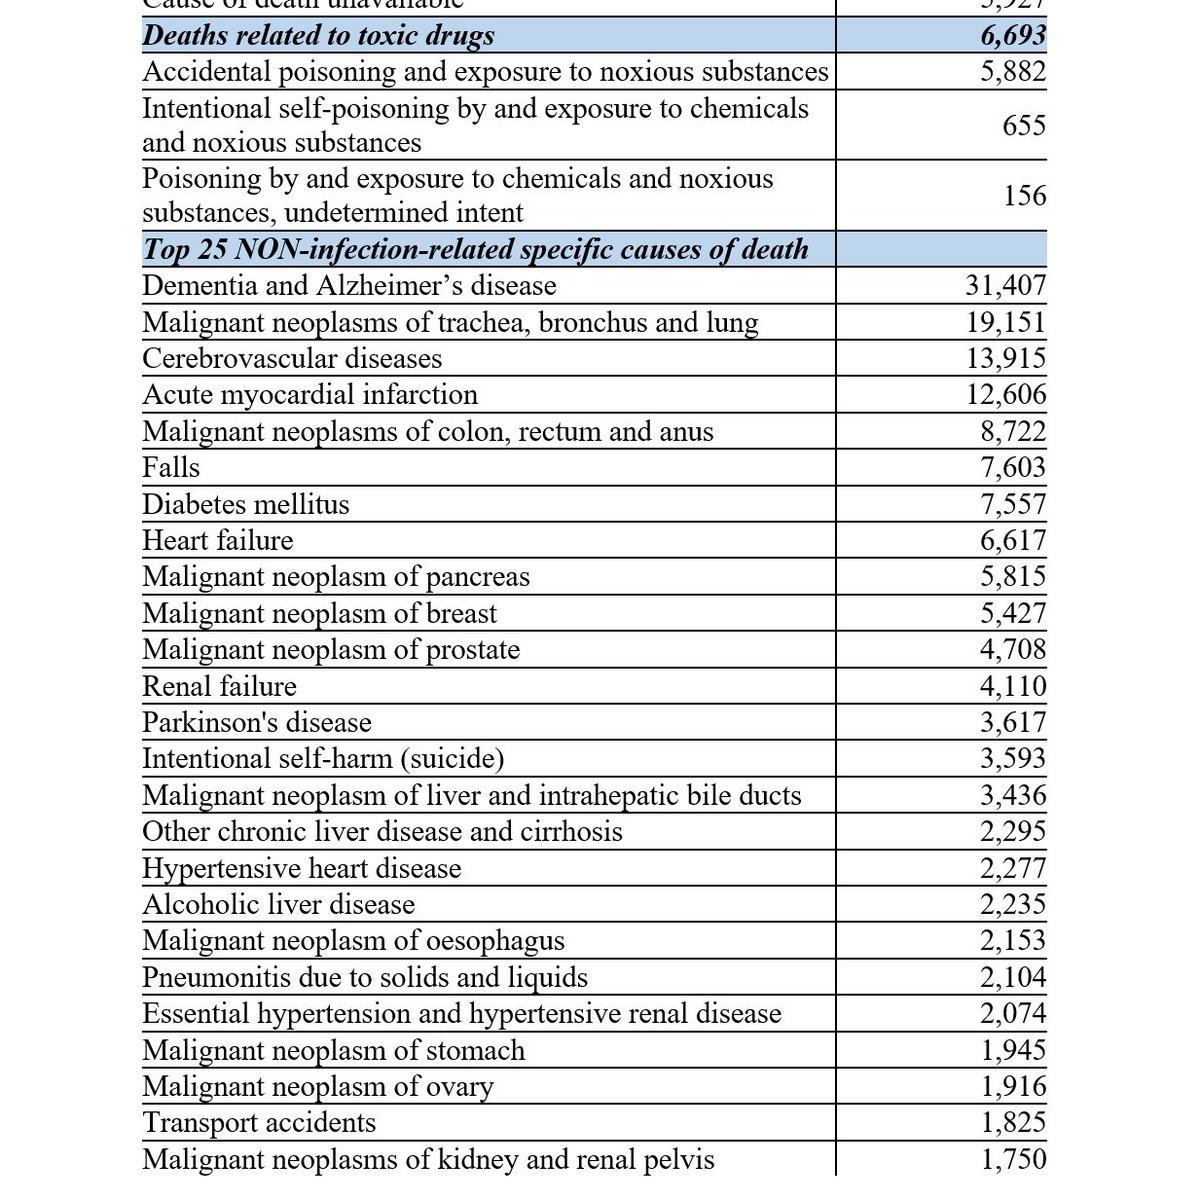
@netgaines @CircaLiz @BattlingBeaver @sillenojunior @Paparak2 @WHO @CIHI_ICIS @COVIDimmunityTF @HemaQuebec @CanadasLifeline @CMAJ @tmurphEpi @mcgillu @INSPQ @LisaBarrettID @BarbaraGoodall6 @GPatriquinMD @ONS @UKHSA @GovCanHealth BTW, COVID-19 and drug deaths are the main causes of death where reporting for 2022 is still really delayed.
We're seeing normal or slightly higher reported deaths than expected for the other top 25 causes of death, based on age-specific mortality rates and 2015-2021 trends.
We're seeing normal or slightly higher reported deaths than expected for the other top 25 causes of death, based on age-specific mortality rates and 2015-2021 trends.
@netgaines @CircaLiz @BattlingBeaver @sillenojunior @Paparak2 @WHO @CIHI_ICIS @COVIDimmunityTF @HemaQuebec @CanadasLifeline @CMAJ @tmurphEpi @mcgillu @INSPQ @LisaBarrettID @BarbaraGoodall6 @GPatriquinMD @ONS @UKHSA @GovCanHealth Top 25 causes of death in Canada in 2022:
COVID-19: reported in CVS-D 19,716, actual ~41,511
COVID-19 was the number 1 specific cause of death in Canada in 2022.
After COVID-19:
2. Dementia/Alzheimer's 31,407
3. Lung cancer 19,151
4. Strokes and related diseases 13,915
COVID-19: reported in CVS-D 19,716, actual ~41,511
COVID-19 was the number 1 specific cause of death in Canada in 2022.
After COVID-19:
2. Dementia/Alzheimer's 31,407
3. Lung cancer 19,151
4. Strokes and related diseases 13,915

@netgaines @CircaLiz @BattlingBeaver @sillenojunior @Paparak2 @WHO @CIHI_ICIS @COVIDimmunityTF @HemaQuebec @CanadasLifeline @CMAJ @tmurphEpi @mcgillu @INSPQ @LisaBarrettID @BarbaraGoodall6 @GPatriquinMD @ONS @UKHSA @GovCanHealth Top 25 causes of death in Canada in 2022:
1. COVID-19: reported in CVS-D 19,716, actual ~41,511
5. Heart attacks 12,606
6. Colon cancer 8,722
7. Falls 7,603
8. Diabetes 7,557
9. Heart failure 6,617
10. Pancreatic cancer 5,815
11. Breast cancer 5,427
12. Prostate cancer 4,708
1. COVID-19: reported in CVS-D 19,716, actual ~41,511
5. Heart attacks 12,606
6. Colon cancer 8,722
7. Falls 7,603
8. Diabetes 7,557
9. Heart failure 6,617
10. Pancreatic cancer 5,815
11. Breast cancer 5,427
12. Prostate cancer 4,708

@netgaines @CircaLiz @BattlingBeaver @sillenojunior @Paparak2 @WHO @CIHI_ICIS @COVIDimmunityTF @HemaQuebec @CanadasLifeline @CMAJ @tmurphEpi @mcgillu @INSPQ @LisaBarrettID @BarbaraGoodall6 @GPatriquinMD @ONS @UKHSA @GovCanHealth Top 25 causes of death in Canada in 2022:
1. COVID-19: reported in CVS-D 19,716, actual ~41,511
13. Kidney failure 4,110
14. Parkinson's 3,617
15. Suicide 3,593
16. Liver cancer 3,436
17. Non-alcoholic liver disease 2,295
18. Hypertensive heart disease 2,277
1. COVID-19: reported in CVS-D 19,716, actual ~41,511
13. Kidney failure 4,110
14. Parkinson's 3,617
15. Suicide 3,593
16. Liver cancer 3,436
17. Non-alcoholic liver disease 2,295
18. Hypertensive heart disease 2,277

@netgaines @CircaLiz @BattlingBeaver @sillenojunior @Paparak2 @WHO @CIHI_ICIS @COVIDimmunityTF @HemaQuebec @CanadasLifeline @CMAJ @tmurphEpi @mcgillu @INSPQ @LisaBarrettID @BarbaraGoodall6 @GPatriquinMD @ONS @UKHSA @GovCanHealth Top 25 causes of death in Canada in 2022:
1. COVID-19: reported in CVS-D 19,716, actual ~41,511
19. Alcoholic liver disease 2,235
20. Oesophageal cancer 2,153
21. Aspiration pneumonia 2,104
22. Hypertension and hypertensive kidney disease 2,074
23. Stomach cancer 1,945
1. COVID-19: reported in CVS-D 19,716, actual ~41,511
19. Alcoholic liver disease 2,235
20. Oesophageal cancer 2,153
21. Aspiration pneumonia 2,104
22. Hypertension and hypertensive kidney disease 2,074
23. Stomach cancer 1,945

@netgaines @CircaLiz @BattlingBeaver @sillenojunior @Paparak2 @WHO @CIHI_ICIS @COVIDimmunityTF @HemaQuebec @CanadasLifeline @CMAJ @tmurphEpi @mcgillu @INSPQ @LisaBarrettID @BarbaraGoodall6 @GPatriquinMD @ONS @UKHSA @GovCanHealth I won't finish the list, but for reference, there were about 11 times more reported COVID-19 deaths than deaths from transportation accidents, and about 23 times more total COVID-19 deaths (including those that haven't made it to the CVS-D) yet than transportation deaths.
@netgaines @CircaLiz @BattlingBeaver @sillenojunior @Paparak2 @WHO @CIHI_ICIS @COVIDimmunityTF @HemaQuebec @CanadasLifeline @CMAJ @tmurphEpi @mcgillu @INSPQ @LisaBarrettID @BarbaraGoodall6 @GPatriquinMD @ONS @UKHSA @GovCanHealth So, in 2022 COVID-19 was the number 1 cause of death in Canada.
Toxic drug deaths came in at least the 7th leading cause of death--probably closer to the 4th or 5th once drug death reporting is completed over the next few years.
Toxic drug deaths came in at least the 7th leading cause of death--probably closer to the 4th or 5th once drug death reporting is completed over the next few years.
@netgaines @CircaLiz @BattlingBeaver @sillenojunior @Paparak2 @WHO @CIHI_ICIS @COVIDimmunityTF @HemaQuebec @CanadasLifeline @CMAJ @tmurphEpi @mcgillu @INSPQ @LisaBarrettID @BarbaraGoodall6 @GPatriquinMD @ONS @UKHSA @GovCanHealth THIS is why so many people are still trying to advocate about COVID-19 and toxic drugs.
@netgaines @CircaLiz @BattlingBeaver @sillenojunior @Paparak2 @WHO @CIHI_ICIS @COVIDimmunityTF @HemaQuebec @CanadasLifeline @CMAJ @tmurphEpi @mcgillu @INSPQ @LisaBarrettID @BarbaraGoodall6 @GPatriquinMD @ONS @UKHSA @GovCanHealth COVID-19 and toxic drug deaths matter.
The lives of people who die from these COVID-19 and toxic drugs matter, even if public discourse around these deaths often dismisses them by saying they were people who were addicts, or who were old or had underlying health conditions.
The lives of people who die from these COVID-19 and toxic drugs matter, even if public discourse around these deaths often dismisses them by saying they were people who were addicts, or who were old or had underlying health conditions.
@netgaines @CircaLiz @BattlingBeaver @sillenojunior @Paparak2 @WHO @CIHI_ICIS @COVIDimmunityTF @HemaQuebec @CanadasLifeline @CMAJ @tmurphEpi @mcgillu @INSPQ @LisaBarrettID @BarbaraGoodall6 @GPatriquinMD @ONS @UKHSA @GovCanHealth My friends,
As most of us know, every extended family is touched by addiction. There but for the grace of god could be any of us, and many of us experience this ourselves and/or love people who do.
Every extended family has people at risk from COVID-19, or we ourselves are.
As most of us know, every extended family is touched by addiction. There but for the grace of god could be any of us, and many of us experience this ourselves and/or love people who do.
Every extended family has people at risk from COVID-19, or we ourselves are.
@netgaines @CircaLiz @BattlingBeaver @sillenojunior @Paparak2 @WHO @CIHI_ICIS @COVIDimmunityTF @HemaQuebec @CanadasLifeline @CMAJ @tmurphEpi @mcgillu @INSPQ @LisaBarrettID @BarbaraGoodall6 @GPatriquinMD @ONS @UKHSA @GovCanHealth Do we and loved ones go through gruelling chemotherapy to save the lives and gain a few more years of life for loved ones with cancer?
Yes, with few exceptions we do. These years are precious for ourselves and for the people we love.
Yes, with few exceptions we do. These years are precious for ourselves and for the people we love.
@netgaines @CircaLiz @BattlingBeaver @sillenojunior @Paparak2 @WHO @CIHI_ICIS @COVIDimmunityTF @HemaQuebec @CanadasLifeline @CMAJ @tmurphEpi @mcgillu @INSPQ @LisaBarrettID @BarbaraGoodall6 @GPatriquinMD @ONS @UKHSA @GovCanHealth Do we fear and try to prevent and treat heart attacks and strokes?
Of course we do.
It's one of the main reasons why people fear closing of emergency rooms.
Of course we do.
It's one of the main reasons why people fear closing of emergency rooms.
@netgaines @CircaLiz @BattlingBeaver @sillenojunior @Paparak2 @WHO @CIHI_ICIS @COVIDimmunityTF @HemaQuebec @CanadasLifeline @CMAJ @tmurphEpi @mcgillu @INSPQ @LisaBarrettID @BarbaraGoodall6 @GPatriquinMD @ONS @UKHSA @GovCanHealth Do we care about and try to prevent falls and transportation accidents and suicide?
Yes we do.
Do we mourn when people die from these causes.
Of course. They are deeply tragic and many are preventable.
Yes we do.
Do we mourn when people die from these causes.
Of course. They are deeply tragic and many are preventable.
@netgaines @CircaLiz @BattlingBeaver @sillenojunior @Paparak2 @WHO @CIHI_ICIS @COVIDimmunityTF @HemaQuebec @CanadasLifeline @CMAJ @tmurphEpi @mcgillu @INSPQ @LisaBarrettID @BarbaraGoodall6 @GPatriquinMD @ONS @UKHSA @GovCanHealth Now look at how many people in Canada are dying from toxic drugs and COVID-19 compared to these other causes and ask if COVID-19 and drug deaths matter less to those who die and those who love them.
They don't.
These deaths do and will touch most of us personally.
They matter.
They don't.
These deaths do and will touch most of us personally.
They matter.
@netgaines @CircaLiz @BattlingBeaver @sillenojunior @Paparak2 @WHO @CIHI_ICIS @COVIDimmunityTF @HemaQuebec @CanadasLifeline @CMAJ @tmurphEpi @mcgillu @INSPQ @LisaBarrettID @BarbaraGoodall6 @GPatriquinMD @ONS @UKHSA @GovCanHealth OK, my last point, since I've been going for something like 7 hours now, is about COVID-19 vaccines.
Quite a few tweets up in this thread I talked about why the dynamic range of excess mortality in Canada is not as broad as the dynamic range of infections.
Quite a few tweets up in this thread I talked about why the dynamic range of excess mortality in Canada is not as broad as the dynamic range of infections.
@netgaines @CircaLiz @BattlingBeaver @sillenojunior @Paparak2 @WHO @CIHI_ICIS @COVIDimmunityTF @HemaQuebec @CanadasLifeline @CMAJ @tmurphEpi @mcgillu @INSPQ @LisaBarrettID @BarbaraGoodall6 @GPatriquinMD @ONS @UKHSA @GovCanHealth I also talked about how Canadian excess deaths in 2023 declined much less than infections compared to 2022, and that it's possible based on UK excess mortality data that 2023 excess deaths actually increased in Canada.
@netgaines @CircaLiz @BattlingBeaver @sillenojunior @Paparak2 @WHO @CIHI_ICIS @COVIDimmunityTF @HemaQuebec @CanadasLifeline @CMAJ @tmurphEpi @mcgillu @INSPQ @LisaBarrettID @BarbaraGoodall6 @GPatriquinMD @ONS @UKHSA @GovCanHealth Why?
Part of it is likely due to plummeting protection from vaccination.
The graph here shows the % of the population in Canada 40 and older with vaccine protection against serious SARS-CoV-2 infection outcomes (hospitalization and death) over time: red line, left axis.
Part of it is likely due to plummeting protection from vaccination.
The graph here shows the % of the population in Canada 40 and older with vaccine protection against serious SARS-CoV-2 infection outcomes (hospitalization and death) over time: red line, left axis.

@netgaines @CircaLiz @BattlingBeaver @sillenojunior @Paparak2 @WHO @CIHI_ICIS @COVIDimmunityTF @HemaQuebec @CanadasLifeline @CMAJ @tmurphEpi @mcgillu @INSPQ @LisaBarrettID @BarbaraGoodall6 @GPatriquinMD @ONS @UKHSA @GovCanHealth The black line shows the estimated SARS-CoV-2 infection fatality rate for Canada, based on estimated weekly infections and deaths.
Unfortunately it's plotted on a log scale (right axis). I have to change this to multiple linear scale graphs. Trying to pack in too much data.
Unfortunately it's plotted on a log scale (right axis). I have to change this to multiple linear scale graphs. Trying to pack in too much data.

@netgaines @CircaLiz @BattlingBeaver @sillenojunior @Paparak2 @WHO @CIHI_ICIS @COVIDimmunityTF @HemaQuebec @CanadasLifeline @CMAJ @tmurphEpi @mcgillu @INSPQ @LisaBarrettID @BarbaraGoodall6 @GPatriquinMD @ONS @UKHSA @GovCanHealth Shitty graph-making aside, what I want you to look at is how infection fatality rates have increased from 2022 to 2023.
You can see this increase better in the annualized graph shown here (look at the darker blue line).
You can see this increase better in the annualized graph shown here (look at the darker blue line).

@netgaines @CircaLiz @BattlingBeaver @sillenojunior @Paparak2 @WHO @CIHI_ICIS @COVIDimmunityTF @HemaQuebec @CanadasLifeline @CMAJ @tmurphEpi @mcgillu @INSPQ @LisaBarrettID @BarbaraGoodall6 @GPatriquinMD @ONS @UKHSA @GovCanHealth As vaccine protection has declined, SARS-CoV-2 infection fatality rates are increasing, to the point that by the end of December 2023 they were approaching the Omicron infection fatality rates expected for Canada's population age structure if no one had been vaccinated.

@netgaines @CircaLiz @BattlingBeaver @sillenojunior @Paparak2 @WHO @CIHI_ICIS @COVIDimmunityTF @HemaQuebec @CanadasLifeline @CMAJ @tmurphEpi @mcgillu @INSPQ @LisaBarrettID @BarbaraGoodall6 @GPatriquinMD @ONS @UKHSA @GovCanHealth I don't know about other caregivers out there who advocate for loved ones in homes, but my mom only gets one COVID-19 vaccine annually now, at the same time as her flu shot.
She's entirely bed bound, so I can't take her to a clinic myself anymore.
She's entirely bed bound, so I can't take her to a clinic myself anymore.
@netgaines @CircaLiz @BattlingBeaver @sillenojunior @Paparak2 @WHO @CIHI_ICIS @COVIDimmunityTF @HemaQuebec @CanadasLifeline @CMAJ @tmurphEpi @mcgillu @INSPQ @LisaBarrettID @BarbaraGoodall6 @GPatriquinMD @ONS @UKHSA @GovCanHealth How much of the continuing COVID-19 excess mortality we're seeing is related to low vaccine uptake, and anemic efforts to vaccinate those at greatest risk, or communicate to those at elevated risk that they need vaccines every 6 months?
@netgaines @CircaLiz @BattlingBeaver @sillenojunior @Paparak2 @WHO @CIHI_ICIS @COVIDimmunityTF @HemaQuebec @CanadasLifeline @CMAJ @tmurphEpi @mcgillu @INSPQ @LisaBarrettID @BarbaraGoodall6 @GPatriquinMD @ONS @UKHSA @GovCanHealth I'll leave you with one last graph, showing % people 40+ with vaccine protection against COVID-19 vs percentage of COVID-19 deaths that are actually publicly reported by provinces.
It's "just" an association, but the strength of that correlation should give policy-makers pause..
It's "just" an association, but the strength of that correlation should give policy-makers pause..

@netgaines @CircaLiz @BattlingBeaver @sillenojunior @Paparak2 @WHO @CIHI_ICIS @COVIDimmunityTF @HemaQuebec @CanadasLifeline @CMAJ @tmurphEpi @mcgillu @INSPQ @LisaBarrettID @BarbaraGoodall6 @GPatriquinMD @ONS @UKHSA @GovCanHealth I have meandered all over. Sorry about that, and thank you for your patience if you're still reading.
I'm going to take a wee nap before the Forecast thread later today.
I'm going to take a wee nap before the Forecast thread later today.
@netgaines @CircaLiz @BattlingBeaver @sillenojunior @Paparak2 @WHO @CIHI_ICIS @COVIDimmunityTF @HemaQuebec @CanadasLifeline @CMAJ @tmurphEpi @mcgillu @INSPQ @LisaBarrettID @BarbaraGoodall6 @GPatriquinMD @ONS @UKHSA @GovCanHealth I know there aren't a lot of Canadian scientists still active on Twitter who can influence provincial policy, but I'm hoping thoughtful, data-driven people who provide respected expert guidance such as @skepticalIDdoc will read and think carefully.
It matters that you do.
It matters that you do.
@netgaines @CircaLiz @BattlingBeaver @sillenojunior @Paparak2 @WHO @CIHI_ICIS @COVIDimmunityTF @HemaQuebec @CanadasLifeline @CMAJ @tmurphEpi @mcgillu @INSPQ @LisaBarrettID @BarbaraGoodall6 @GPatriquinMD @ONS @UKHSA @GovCanHealth @skepticalIDdoc Love to all.
Take care of each other. You matter. Your life matters. The lives of those we love matter.
All of them.
Take care of each other. You matter. Your life matters. The lives of those we love matter.
All of them.
@elizajody @netgaines @CircaLiz @BattlingBeaver @sillenojunior @Paparak2 @WHO @CIHI_ICIS @COVIDimmunityTF @HemaQuebec @CanadasLifeline @CMAJ @tmurphEpi @mcgillu @INSPQ @LisaBarrettID @BarbaraGoodall6 @GPatriquinMD @ONS @UKHSA @GovCanHealth And sorry it wasn't clear!
@catameep @BattlingBeaver @GovCanHealth But....we focus only on COVID-19 deaths that are excess/untimely, so we subtract deaths that are greater than excess mortality in any given week.
It might be good to show the estimated total incidental and non-incidental COVID-19 deaths so people understand this better.
It might be good to show the estimated total incidental and non-incidental COVID-19 deaths so people understand this better.
@catameep @BattlingBeaver @GovCanHealth As for the sawtooth pattern of excess mortality, this is a function of Canada's seasonal mortality patterns. Other countries in the Northern hemisphere show similar patterns depending on how cold they get.
@catameep @BattlingBeaver @GovCanHealth COVID-19 deaths in fall and winter are less likely to be counted as excess because there are more deaths from flu/pneumonia at that time of year.
@catameep @BattlingBeaver @GovCanHealth Basically some people are dying of COVID-19 instead of flu/pneumonia at that time of year--they're deaths of people who would have died of other causes at about the same time, so they're not excess/untimely.
I hope that helps better explain the data.
I hope that helps better explain the data.
@catameep @BattlingBeaver @GovCanHealth Your comment also made me think that it would be a good idea to show the total with and from COVID-19 deaths for Canada, so people can see that the pattern reflects infection waves.
It's really important that people understand the data, and your comment helps with this.
It's really important that people understand the data, and your comment helps with this.
• • •
Missing some Tweet in this thread? You can try to
force a refresh