A massive housing bubble has developed, and is about to pop, in the South.
The number of new homes for sale in the Southern Region (FL, GA, TN, TX, etc.) has spiked up to nearly 300,000.
This is the highest level of all-time. Even higher than the previous bubble peak in August 2006.
Before the massive crash.
Many people want you think "this time is different" in the housing market.
It isn't.

1) For a visual representation of what we mean by "South", check this map. This comes from the US Census Bureau regional delineations.
South includes basically everything south of DC, extending west to Texas.
Includes most of the big homebuilding states like Texas, Florida, and Tennessee.
South includes basically everything south of DC, extending west to Texas.
Includes most of the big homebuilding states like Texas, Florida, and Tennessee.

2) The builders in the South have gone absolutely crazy, and continue to pull single-family permits at an extremely high rate.
Many are adopting a mid-2000s perspective of "build it and they will come".
However, the demand has dropped off precipitously. With new home sales in the South falling down below pre-pandemic levels.
Many are adopting a mid-2000s perspective of "build it and they will come".
However, the demand has dropped off precipitously. With new home sales in the South falling down below pre-pandemic levels.
3) The result is that the "Months of Supply" on builder lots in the South has spiked to almost 9 months.
This is one of the highest levels on record.
Similar to the spike that occurred in late 2022. And now approaching the highs last seen in 2008, directly preceding the biggest housing crash of all-time.
This is all data from the US Census Bureau.
This is one of the highest levels on record.
Similar to the spike that occurred in late 2022. And now approaching the highs last seen in 2008, directly preceding the biggest housing crash of all-time.
This is all data from the US Census Bureau.

4) It's going to get worse, though.
The South is where all the investors speculatively purchased homes during the pandemic.
Many investors purchased in builder communities.
Now many of those investors are being forced to sell. Especially those who expanded their portfolios aggressively at the peak of the bubble in 2021-2022.
The South is where all the investors speculatively purchased homes during the pandemic.
Many investors purchased in builder communities.
Now many of those investors are being forced to sell. Especially those who expanded their portfolios aggressively at the peak of the bubble in 2021-2022.
5) The South is also where home prices are the most overvalued compared to their long-term norms, according to data on Reventure App.
Home prices in states like Tennessee, Georgia, and Florida are 30% overvalued.
The recipe is there for a major housing downturn in the South. And it might already be happening in certain states.
Home prices in states like Tennessee, Georgia, and Florida are 30% overvalued.
The recipe is there for a major housing downturn in the South. And it might already be happening in certain states.

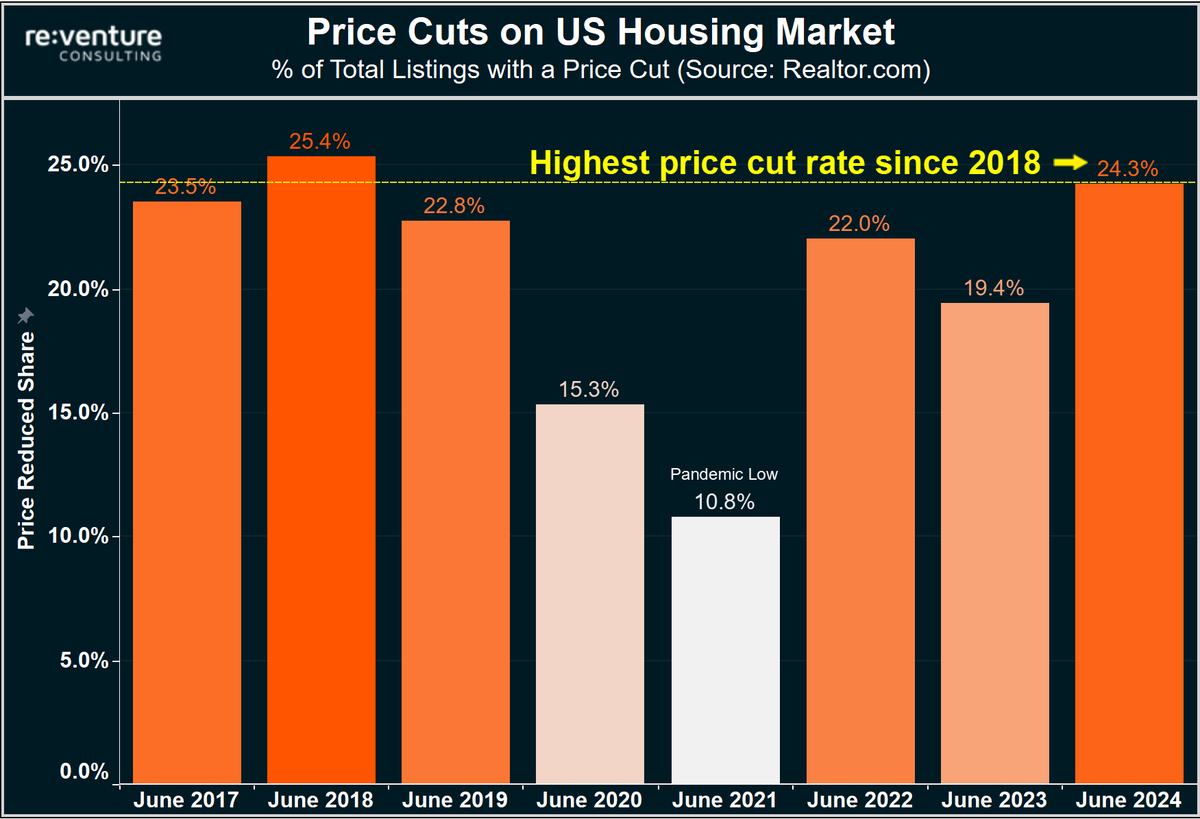
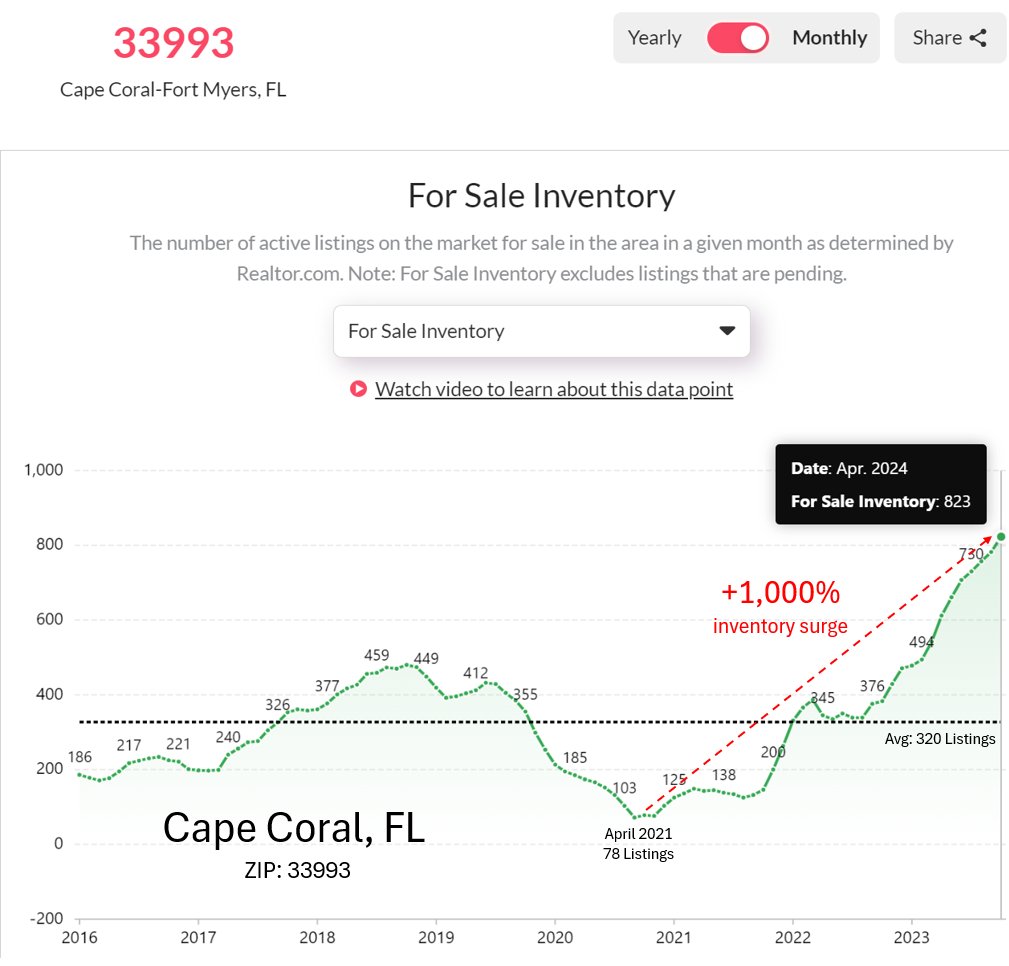
6) Active inventory on the Florida housing market, for instance, is currently spiking.
As are price cuts.
A key indicator of a market downturn.
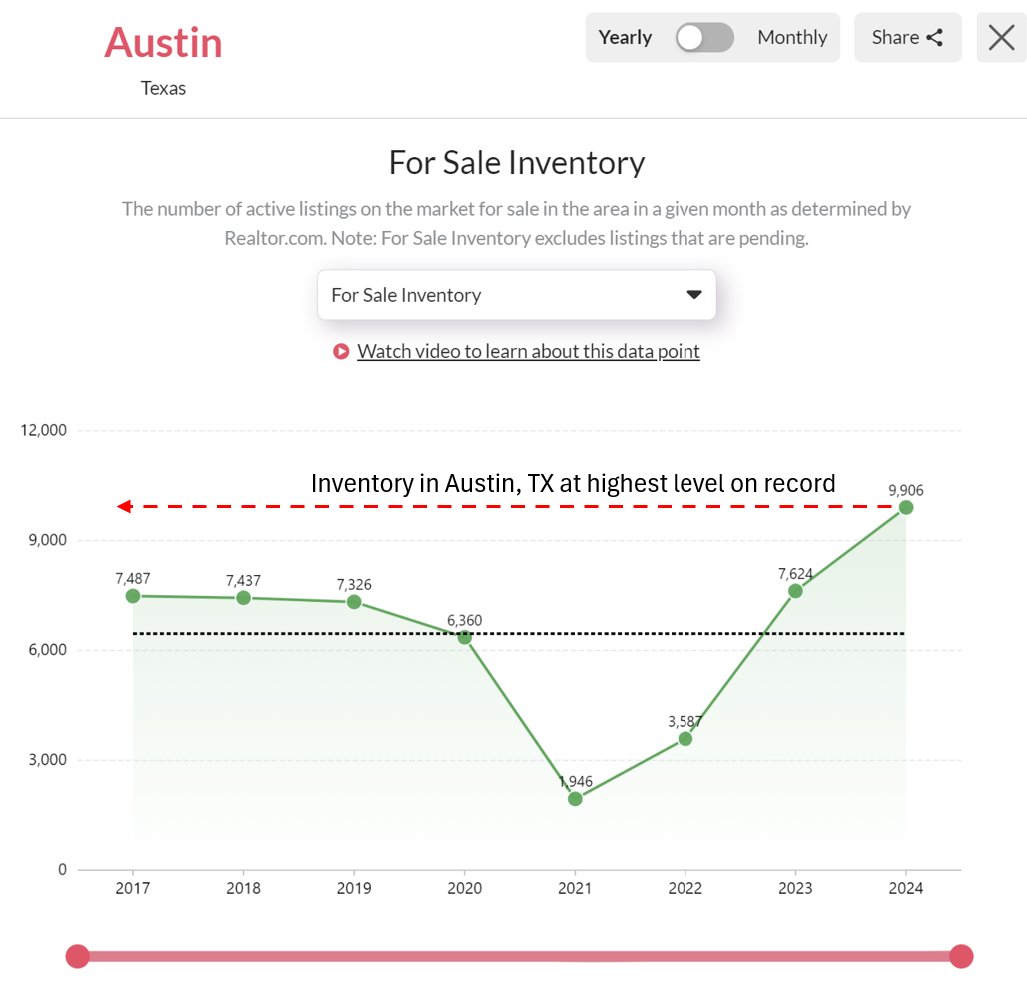
The same thing is happening in Texas.
And to a lesser extent in Tennessee, Georgia, and South Carolina (depending on the city).
As are price cuts.
A key indicator of a market downturn.
The same thing is happening in Texas.
And to a lesser extent in Tennessee, Georgia, and South Carolina (depending on the city).
7) Here are some inventory charts for those Southern states. You can clearly see the market is shifting, and shifting fast.


8) But prices remain near record highs. They've only come down by a little bit in most of these states.
Indicating that buyers are still priced out of the market. And won't be rushing back to buy until there's more substantial relief on both home prices and mortgage rates.
Indicating that buyers are still priced out of the market. And won't be rushing back to buy until there's more substantial relief on both home prices and mortgage rates.
9) The big wildcard here is the R word: Recession.
if a Recession rears it's head, all bets are off in terms of the housing market in the South.
So much of the employment in the region is driven by construction, remote workers, and through tourism.
Any type of meaningful economic downturn will have an outsized impact on the Southern economy. Which would have an outsized impact on the housing market.
10) I know this sounds very bearish on Southern real estate.
But ultimately it's pretty simple. Home builders and investors rampantly speculated in this housing market the last 3-4 years.
And prices went far above what locals can afford. And created a bubble.
Now that bubble is - slowly - popping. And it could start to pop pretty fast if a Recession is thrown into the mix.
11) Make sure to pay attention to inventory and price cut levels in your local housing market. Those are two of the most important data points in terms of understanding the trends.
You can access them at .
You'll want to see how your area compares to nearby areas in terms of inventory/price cuts.
But, most importantly - how your local area is trending against its own historical norms.reventure.app
You can access them at .
You'll want to see how your area compares to nearby areas in terms of inventory/price cuts.
But, most importantly - how your local area is trending against its own historical norms.reventure.app
12) One more thing...we won't see a housing crash in the Northeast and Midwest.
Home building there is at very low levels. As is speculative inventory activity.
Prices in these regions are also less overvalued. And inventory is much lower.
Perhaps there's a housing correction eventually in Northeast/Midwest. But for now - these markets are holding strong.
Home building there is at very low levels. As is speculative inventory activity.
Prices in these regions are also less overvalued. And inventory is much lower.
Perhaps there's a housing correction eventually in Northeast/Midwest. But for now - these markets are holding strong.

• • •
Missing some Tweet in this thread? You can try to
force a refresh