Tomer Burg Profile picture
Jul 8 5 tweets 3 min read Read on X
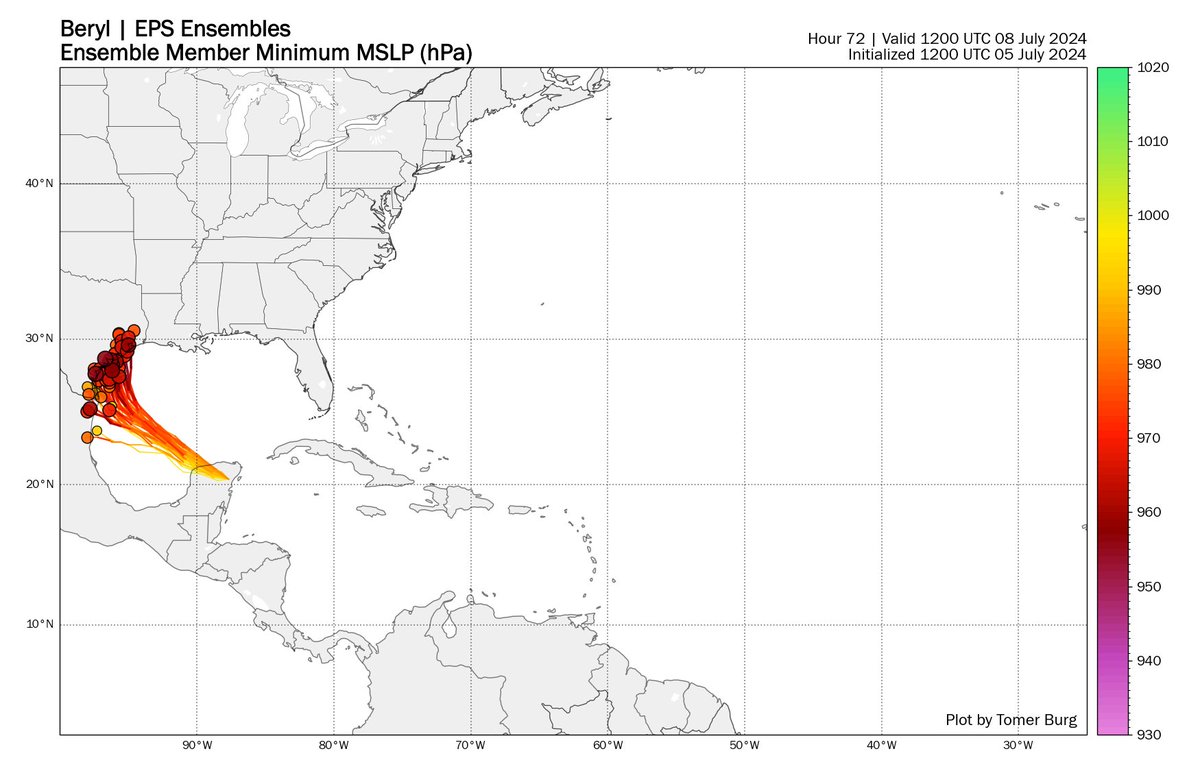
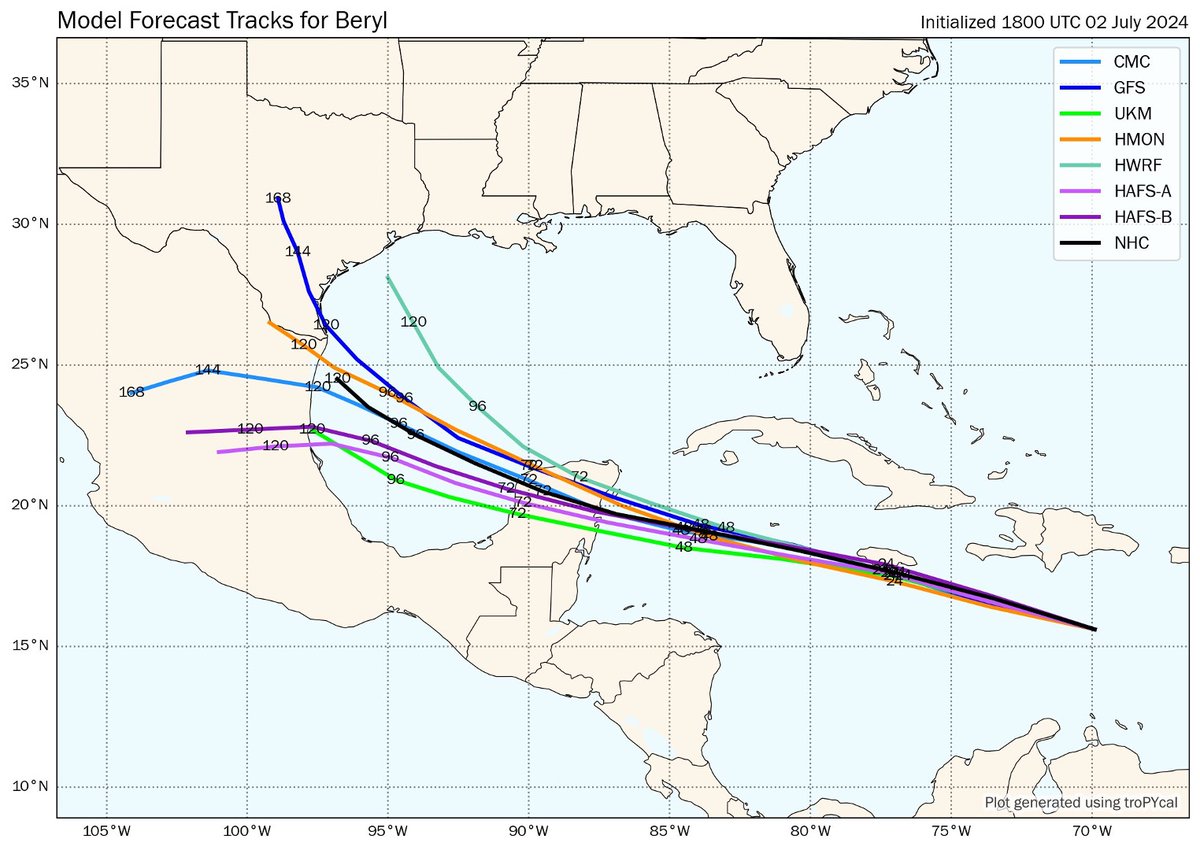
Here's a look at the multi-model ensemble forecast track for Beryl over the last 12 days.

There was a clear picture of a long-track Caribbean storm, but with larger errors for its ultimate Gulf landfall location - ensemble tracks ranged from the Bay of Campeche to New Orleans.
Coarse global ensembles were consistently too weak & too far south with Beryl once it passed west of Jamaica, accordingly depicting its Gulf landfall too far south.

Short-term observations vs. forecasts made it easier to rule out the outliers:

Image
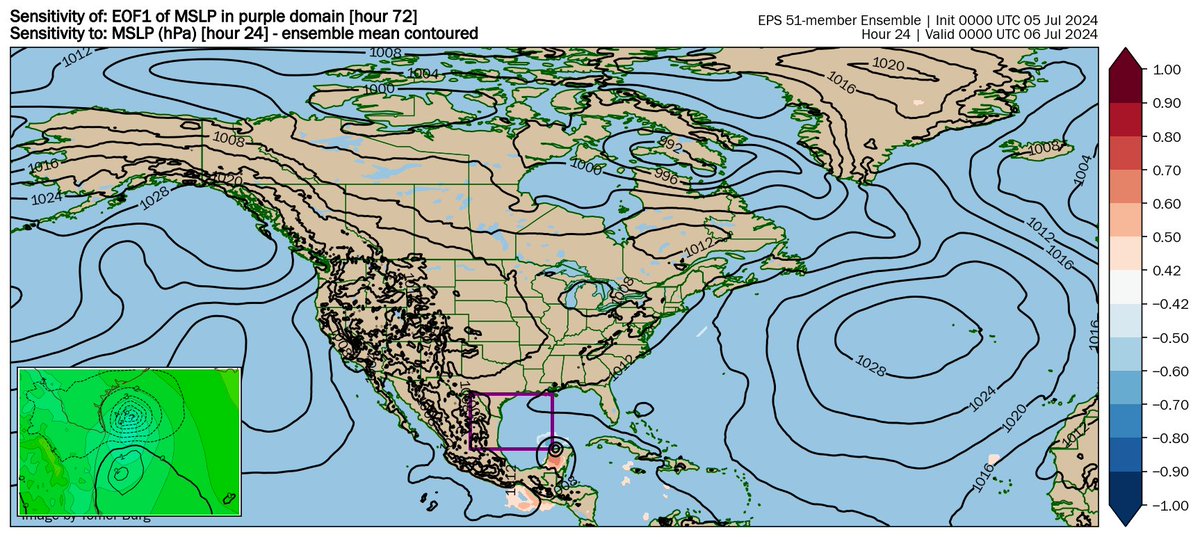
Intensity errors were quite large in the Gulf - Beryl was disrupted by dry air more than most models anticipated, and accordingly many ensembles & hurricane models incorrectly showed a major hurricane landfall.

Some others, like the GFS/HAFS, were far too weak in the Gulf. Image
The ICON particularly received attention for being consistently east of & stronger than most models, which were too weak & too far south.

The ICON, however, was still too strong & too slow/far east vs. verification:
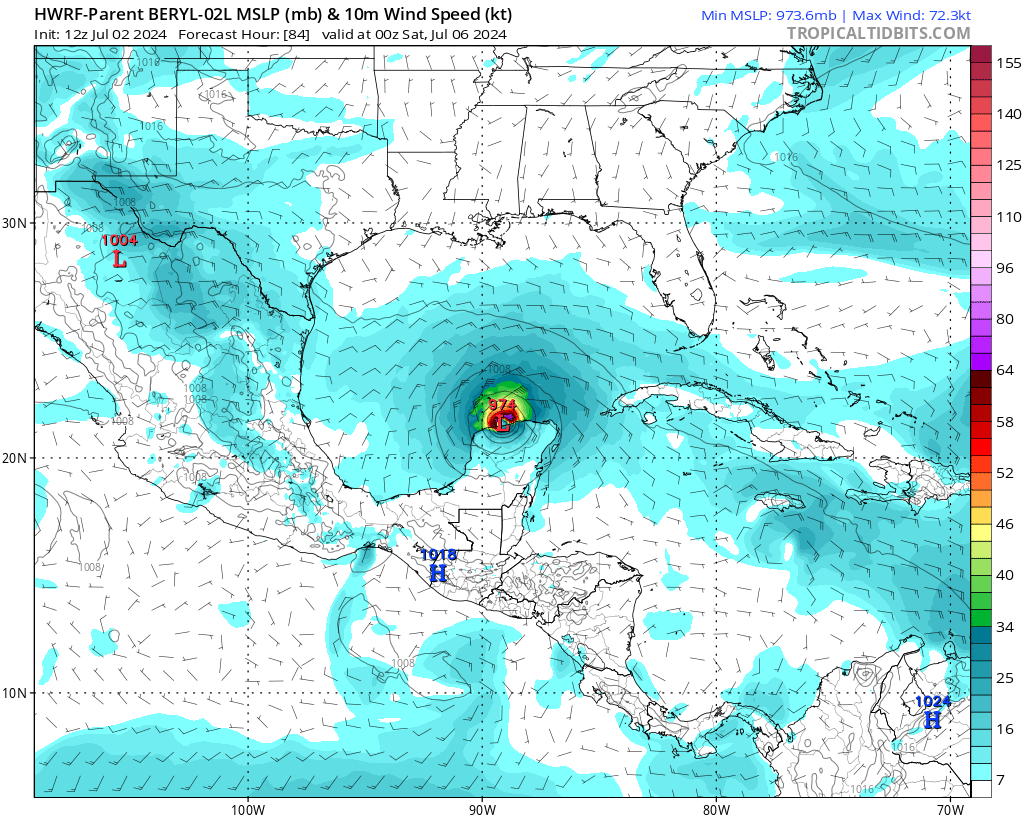
Some models can also be right for the wrong reason.

The 7/2 12z cycle of the HWRF did much better than other hurricane/global models with Beryl's track and right turn... but had Beryl emerging into the Gulf intact with 974 hPa min MSLP. Verification was 998 hPa.
Image
Image

• • •

Missing some Tweet in this thread? You can try to force a refresh
 

Keep Current with Tomer Burg

Tomer Burg Profile picture

Stay in touch and get notified when new unrolls are available from this author!

Read all threads

This Thread may be Removed Anytime!

PDF

Twitter may remove this content at anytime! Save it as PDF for later use!

Try unrolling a thread yourself!

how to unroll video
  1. Follow @ThreadReaderApp to mention us!

  2. From a Twitter thread mention us with a keyword "unroll"
@threadreaderapp unroll

Practice here first or read more on our help page!

More from @burgwx

Jul 5
Last night's run of the EPS ensemble shows a clear correlation between latitude and intensity for Hurricane Beryl - that is, stronger members are farther north, and weaker members are farther south.

Let's dive into this variability a bit more with ensemble sensitivity analysis: Image
First we'll start with the leading mode of variability (EOF1) in the forecast MSLP field.

Not surprisingly, given the map in my previous post, it is expected that the leading mode of variability is a combination of amplitude & location variability: Image
EOF1 suggests the primary sensitivity to Beryl's intensity & track near Texas is actually its own short-term track - that is, Beryl emerging farther north in the Gulf will also track more northward, end up stronger & spend more time over water, than if it emerges farther south. Image
Read 7 tweets
Mar 16
This is going to be a bit of a long thread, but there’s a lot of ground to cover here that can’t possibly be reasonably fit into 240 characters without losing nuance/context.

The first: we’ve seen a “silent revolution” in weather forecast skill over the last few decades.
I call this a “silent revolution” because there wasn’t a *single* dramatic moment beyond which weather forecast skill instantly improved.

Thid improvement came from many areas: satellites, models, parameterizations, data assimilation, and computing resources.
1. Satellites — we don’t have ground observations at every point on earth, especially in remote areas & oceans. Satellites help fill in that gap by providing invaluable observations where we otherwise don’t have them.

We’ve had more & better quality satellites with the years.
Read 17 tweets
Aug 31, 2023
Not that there's enough tropical cyclone activity in the main Atlantic basin... but there's a low but non-zero probability of tropical transition west of the Iberian Peninsula worth noting, where SSTs are around 2C above normal. Image
The biggest source of synoptic-scale uncertainty is where an anomalously deep upper-level low will track, as the farther west it cuts off and stalls off Spain/Portugal, the warmer sea surface temperatures are where an eventual surface cyclone will develop. Image
SSTs in this area are ~22-23C, which despite being below 26C can support a non-tropical low acquiring subtropical characteristics especially if associated with steep tropospheric lapse rates.

@AliciaMBentley's maps show this with negative coupling index over this low. Image
Read 4 tweets
Aug 17, 2023
Forecast confidence is increasing in a very unusual scenario where Tropical Storm Hilary impacts southwest California, particularly the San Diego & Los Angeles metros, with direct impacts.

I'll go more in-depth into the driving factors & potential impacts for CA in this thread. https://t.co/hHU4fIHMd0
Image
Starting with the short-term, Hilary will spend the next 2-3 days in a warm, moist & low vertical wind shear environment, which is *very* conducive for rapid intensification (RI) as shown by the SHIPS statistical model. Hilary is likely to become a very powerful hurricane. Image
Typically, hurricanes quickly dissipate once passing west of Baja California as they encounter much cooler sea surface temperatures & a stable airmass.

Hilary will also traverse this cool region & weaken... but what happens next is a *very* substantial anomaly from the norm. Image
Read 13 tweets
Aug 15, 2023
If you follow real-time weather models, you've likely seen some very extreme solutions modeled for next week.

I'll keep this thread hype & clickbait free while discussing legitimate scenarios for next week, between a heatwave & potential tropical cyclone approaching California. Image
A notable feature & a precursor to potential CA tropical cyclone impacts is a massive ridge over the Plains.

While 500mb heights may challenge modern records (1950-present), surface temperatures appear unlikely to be nearly as record-breaking. The next post will cover why...
Image
Image
1. The EPS has tended to run a bit hot with 500mb ridges this summer, and it may be slightly overdone here.

2. The GFS/GEFS (right) suffer from a surface hot bias, related to it drying out the boundary layer too much. The 110F+ readings shown by it are well overdone.
Image
Image
Read 8 tweets
Jun 14, 2023
Expanding on my thoughts yesterday, I'm increasingly concerned about another round of major fires across Ontario & Quebec, with the potential for the resulting smoke to affect the Northeast US again.

Confidence is increasing in a near-record ridge for June early-mid next week: ImageImage
This ridge will be accompanied by the potential for a multi-day episode of temperatures near/above 90F across interior Quebec & Ontario into the southern Hudson Bay.

Naturally, given the absence of forcing for ascent, below normal precipitation is expected in this region. ImageImage
At this time, a rex block configuration is expected with a cutoff low likely near the Mid Atlantic.

This opens up 2 main pathways for the smoke plumes: east into the open Atlantic, and south/southwest into the Northeast/Ohio Valley/Great Lakes. Image
Read 4 tweets

Did Thread Reader help you today?

Support us! We are indie developers!


This site is made by just two indie developers on a laptop doing marketing, support and development! Read more about the story.

Become a Premium Member ($3/month or $30/year) and get exclusive features!

Become Premium

Don't want to be a Premium member but still want to support us?

Make a small donation by buying us coffee ($5) or help with server cost ($10)

Donate via Paypal

Or Donate anonymously using crypto!

Ethereum

0xfe58350B80634f60Fa6Dc149a72b4DFbc17D341E copy

Bitcoin

3ATGMxNzCUFzxpMCHL5sWSt4DVtS8UqXpi copy

Thank you for your support!

Follow Us!

:(