Tomer Burg Profile picture
Senior meteorological scientist at @WindBorneWx & web developer
Oct 8 6 tweets 3 min read
[Thread] Following along with the NE US weekend forecast & wondering why models are all over the place with the nor'easter?

Here's a good place to start: notice how a potent cutoff low in the 12z ECMWF is completely missing in the following 18z ECMWF run - only 96 hours out! Your next thought might be to look at AI weather models, since those have certain advantages over NWP models.

But even they are experiencing the same whiplash - notice how the AIFS over the last few runs keeps alternating between cutoff & no cutoff low in the Great Lakes:
Jan 22 12 tweets 6 min read
It's no exaggeration to say today brought a truly historical weather event to the Gulf Coast - lots of places all the way down to the water got over 6-8 inches of snow, shattering records going as far back as 1895 in some places.

Let's review what caused this historic event 🧵 Snowstorms are rare in the Deep South, but they have happened on rare occasions, such as December 1989 & February 1973.

To get a major snowstorm that far south, you need the perfect combination of lots of cold air making it far south & upper-level forcing to get a storm to form.
Jan 7 18 tweets 6 min read
Many of you have likely seen maps like this floating around over the last 2 days, showing a major blizzard affecting the Mid Atlantic & Northeast.

But why do some models show a major blizzard, while others show practically nothing? Let's take a deeper look: Image 
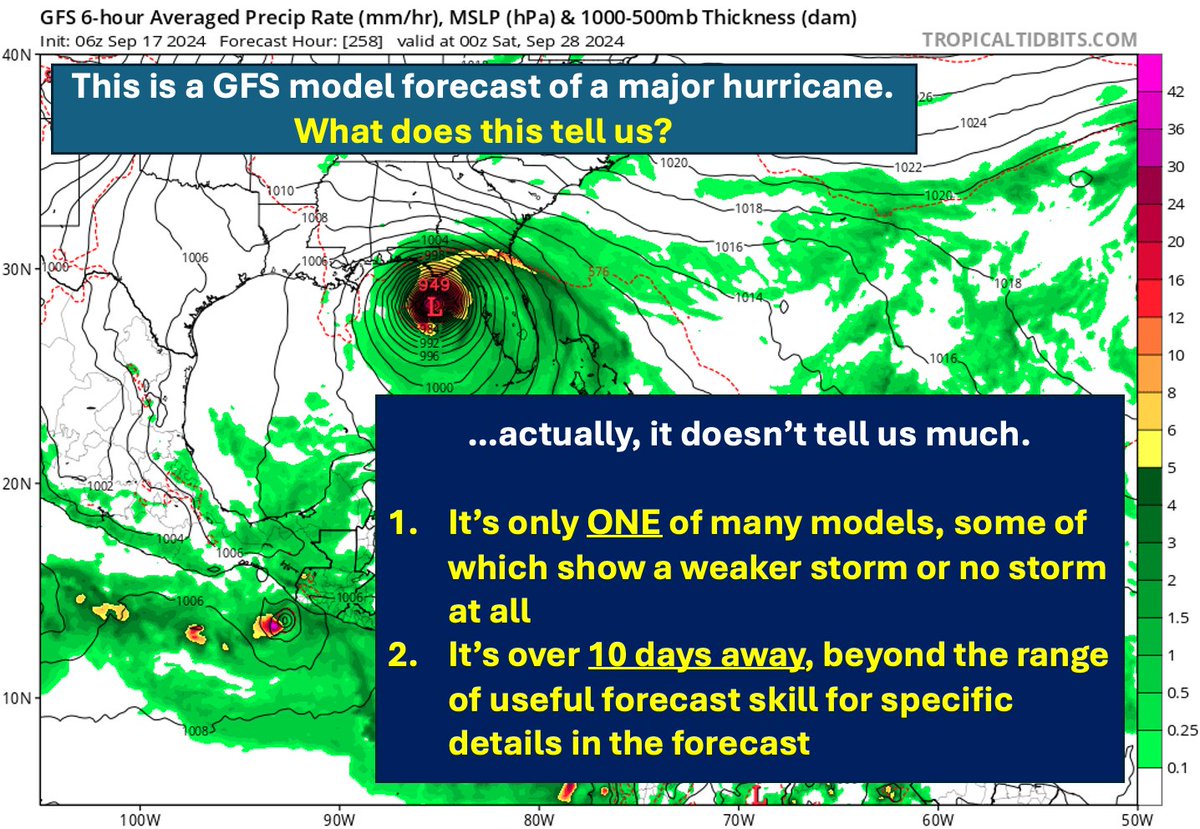
First, consider how we're only ~5 days out from the possible storm, and there's still lots of uncertainty.

5 days out from today's storm, we already knew a major snowstorm would happen.

Some situations are inherently more predictable than others - it varies by each case.
Jan 5 6 tweets 3 min read
Quick meteorology lesson - if you're not a meteorologist or experienced with weather, it might seem odd how a big storm "seemingly came out of nowhere" - but this isn't what's happening at all.

The atmosphere is a 3-dimensional field - there's a lot more than just radar! Let's look at 7pm CST last night (00 UTC), when there was only freezing drizzle & a little bit of snow (left).

But if we look at the 500 hPa surface, about 5km above the ground (right), we see a deep trough over the Rockies: Image
Image
Dec 16, 2024 8 tweets 3 min read
[Thread] Latest models have abandoned a major Mid Atlantic snowstorm for next weekend, and it's easy to see why:

1. Insufficient ridge amplification upstream of 12/20 shortwave to force it farther south and neutral/negatively tilted early enough for cyclogenesis near the coast 2. Antecedent 12/19 trough is too progressive/weak to serve as an effective transient 50/50 low with strong downstream confluence over New England

3. By the time the Pacific trough forces more significant ridge amplification over the Rockies, the ridge axis is too far east Image
Nov 15, 2024 6 tweets 2 min read
[Thread] Weather forecasting isn’t perfect — as is anything that involves predicting the future — but it’s truly under-appreciated just *how* much it’s improved.

Over a week (!!) ago, weather models correctly identified the trough & ridge placement over North America: Some details in the weather forecast are naturally harder to predict farther out than others, but it doesn’t mean we don’t have skill.

We can’t say for sure if the high temperature a week from now will be 49 or 50, but we do know it will substantially cool down in the East US.
Nov 12, 2024 7 tweets 3 min read
[Thread] While it's too far away for specific details, confidence is increasing in another tropical cyclone forming in the western Caribbean, and the Greater Antilles & Southeast US should monitor this potential.

I annotated the big picture key players in this map: Image 
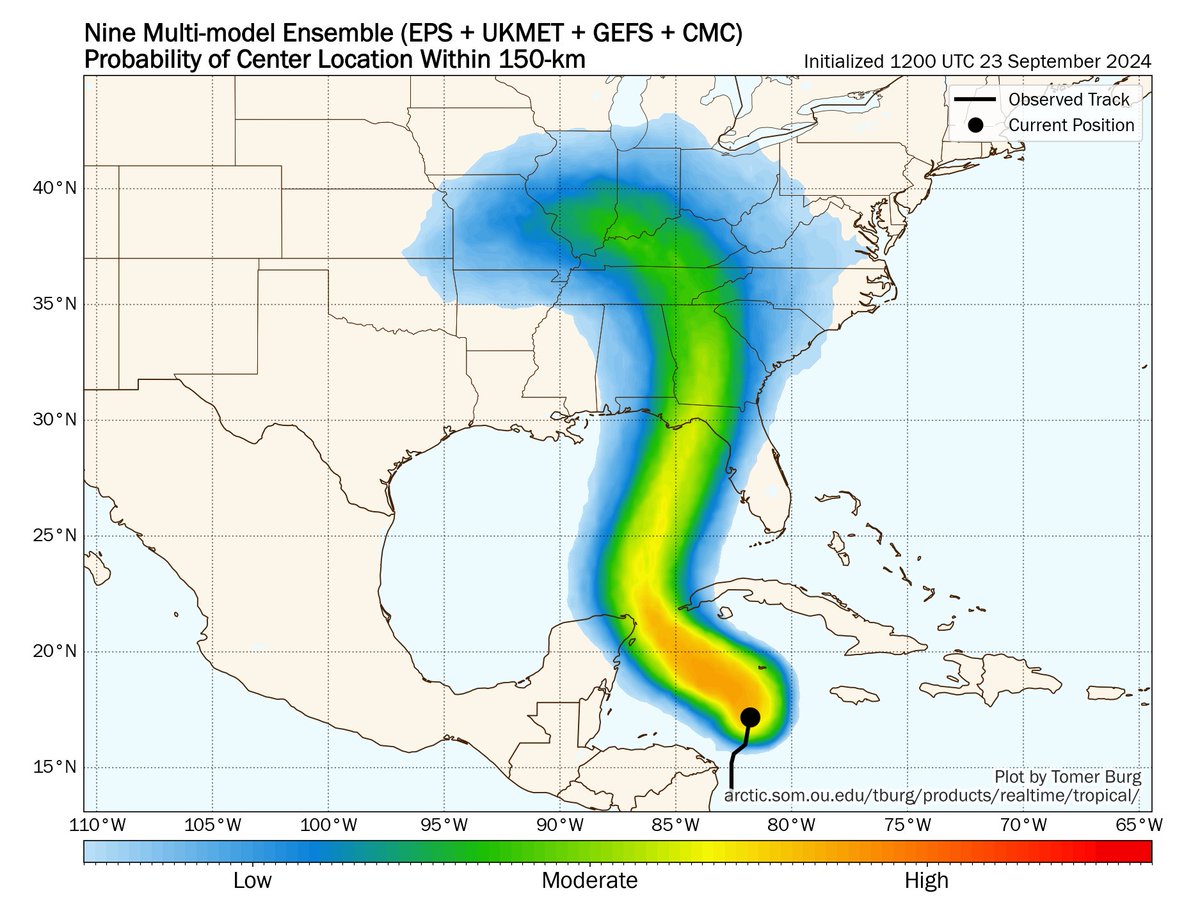
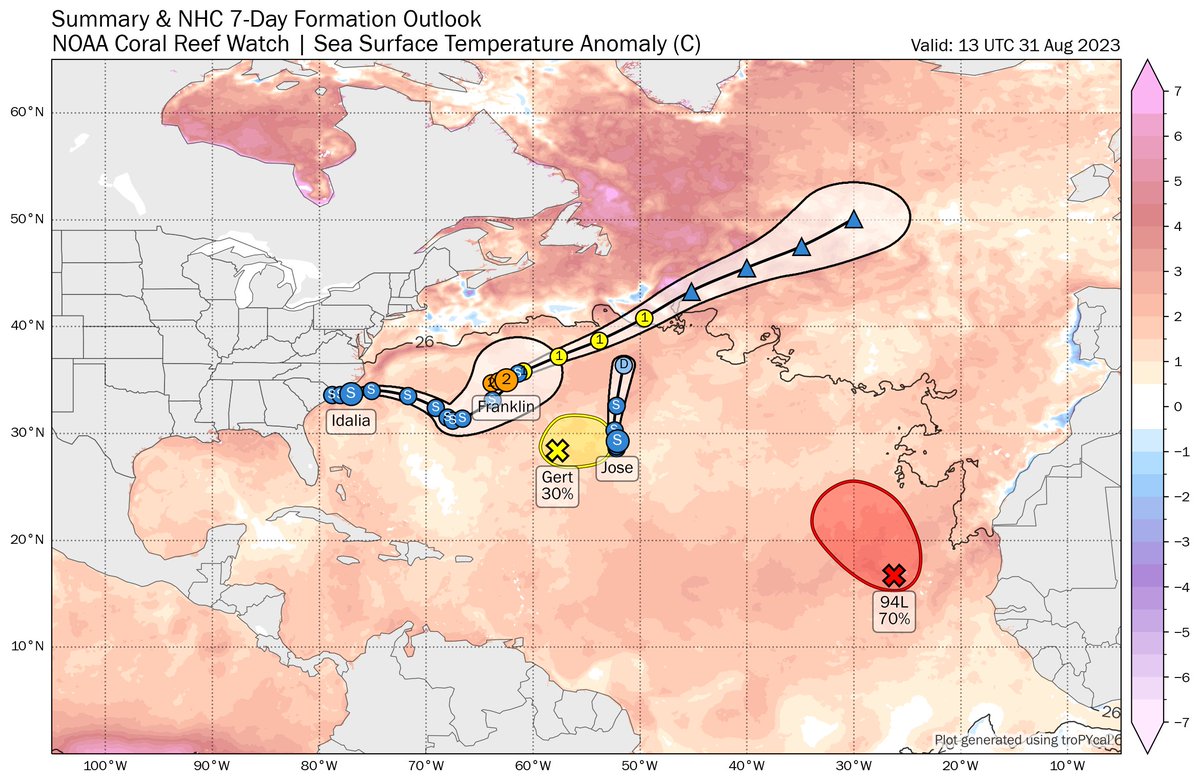
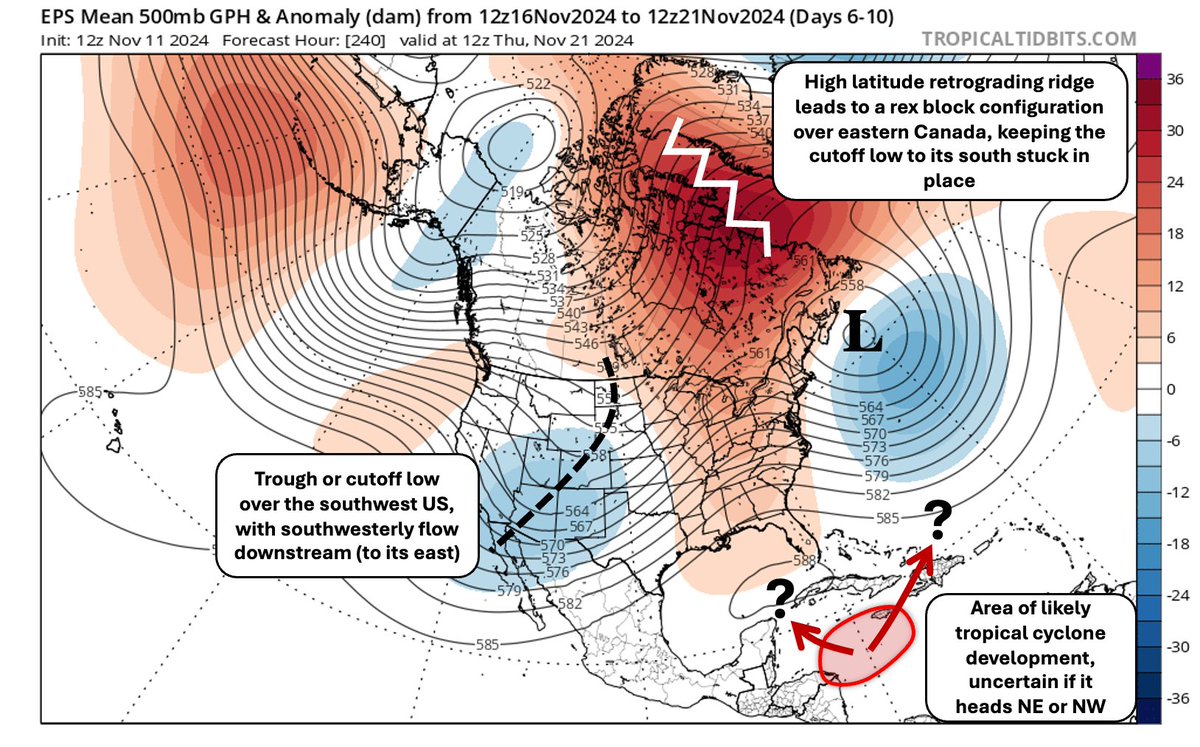
There is still the possibility a storm doesn't develop. But if one does, as is increasingly likely, how quickly it develops & where it forms will influence whether it quickly gets picked up by a trough and steered into the ocean, or keeps brewing in the western Caribbean: Image
Oct 6, 2024 13 tweets 5 min read
[Sun 10/6 morning Milton discussion]

Observations are indicating Milton is on the verge of a potentially exceptional rapid intensification phase, and could rapidly grow into a small but powerful category 4 or 5 hurricane.

Interests in western Florida should take this seriously. Image 
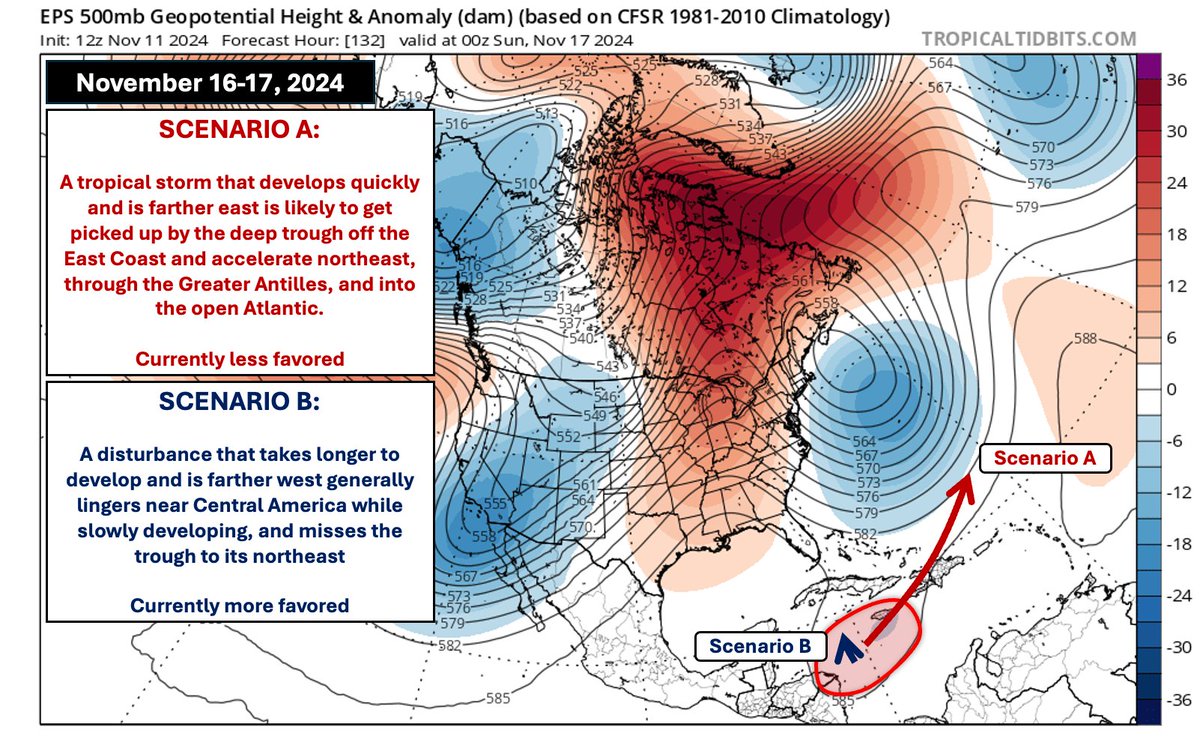
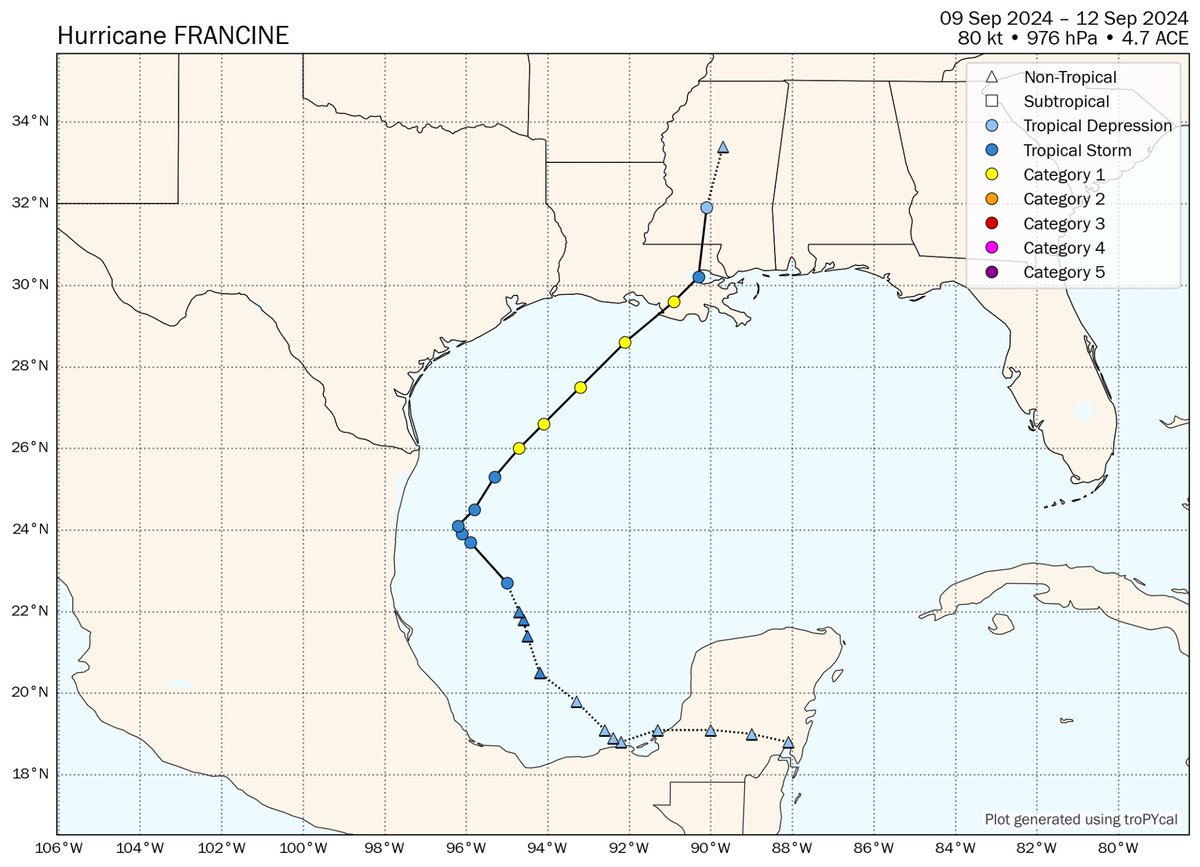
To make a good forecast, we need to start off with a good analysis of the current conditions.

Tropical Storm Milton is rapidly organizing this morning, with a strong burst of deep convection persisting over its center - something Helene failed to do so early in its lifespan.
Sep 28, 2024 4 tweets 2 min read
I wanted to do a bit of a retrospective look at my Helene posts.

Generally, the forecast & model consensus did well, highlighting the region near Tallahassee for landfall & showing a left turn inland.

The biggest hazard, however, was the catastrophic inland flooding.
Image From a science POV, I tend to focus on the technical aspects of the track & intensity forecasts, as this does matter for landfall locations.

But as is often emphasized, destructive impacts such as storm surge & flooding can extend far from the storm center and well inland.
Sep 27, 2024 6 tweets 3 min read
With a lot of focus on Helene's unusual inland impacts, I thought I'd delve a bit into the meteorology of what makes this such an unusual hurricane long past landfall.

Currently, Helene is being quickly steered northward between a ridge to the east & cutoff low to its northwest: Helene is currently situated near the right entrance quadrant of a strong jet streak associated with the cutoff low (right).

Strong upper-level divergence (left, purple contours), especially north & west of Helene's center, is associated with synoptic forcing for ascent.
Image
Image
Sep 24, 2024 4 tweets 2 min read
Brief overview of overnight model guidance for PTC 9

The EPS are generally split into 2 camps, one where PTC 9 remains weak/disorganized and ends up farther west near the Yucatan, and another where PTC 9 develops a core in the Caribbean, is stronger, & turns north farther east: Image The result of this difference is a sensitivity to not just track, but timing — stronger members are faster and farther east, while weaker members are slower and farther west.

This ties into increased timing uncertainty from the overnight runs, especially at hour 72/84:
Image
Image
Sep 23, 2024 11 tweets 4 min read
[Evening discussion for PTC #9/future Helene]

This discussion will start with a brief overview of the forecast track & timing of the storm, but will mostly focus on its potential intensity, as the intensity forecast is a rather challenging one. Image 
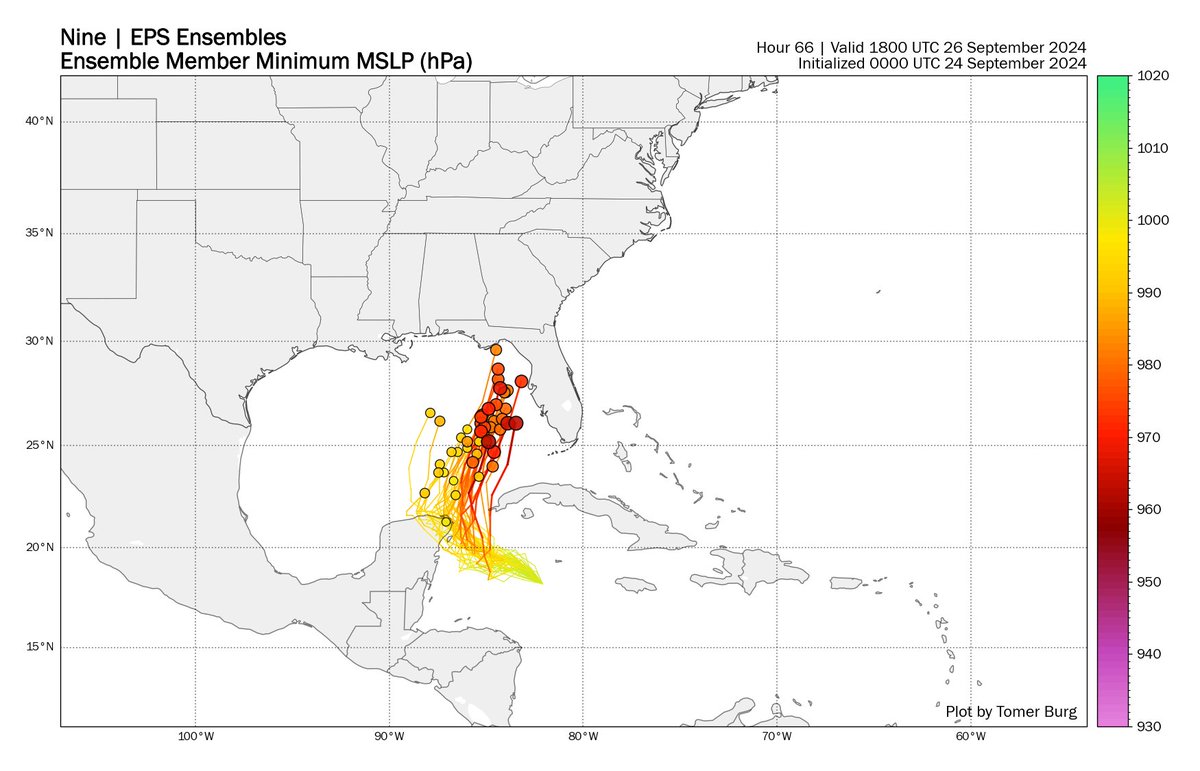
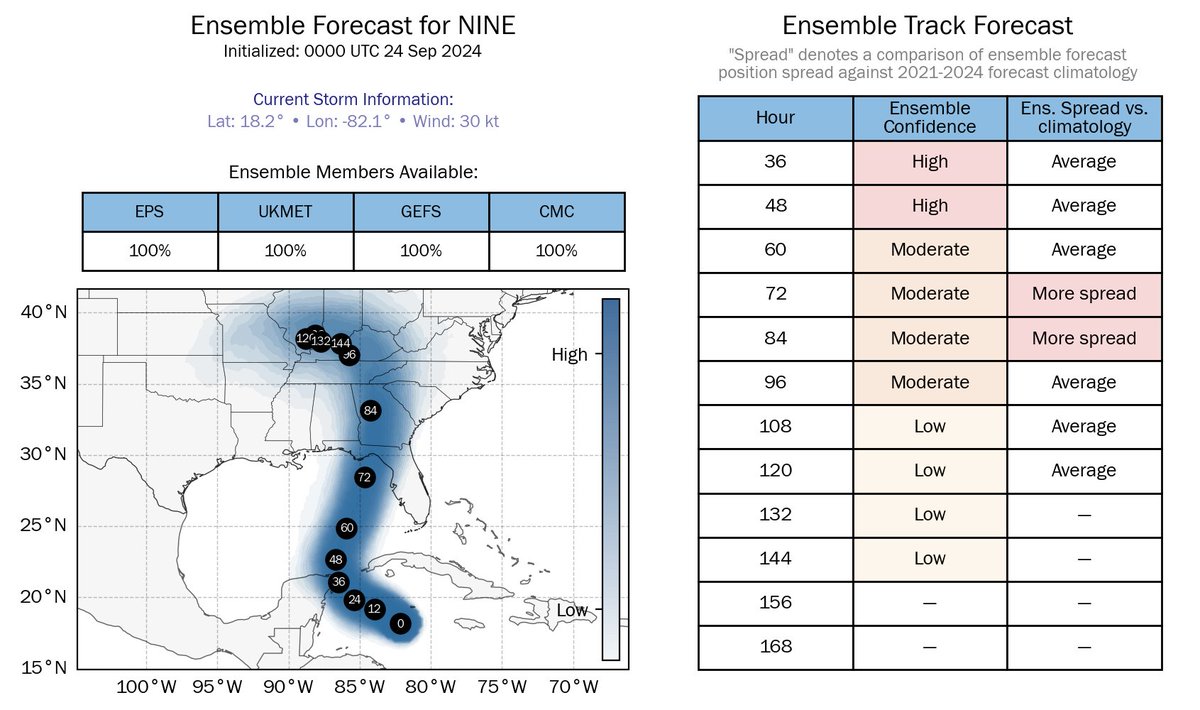
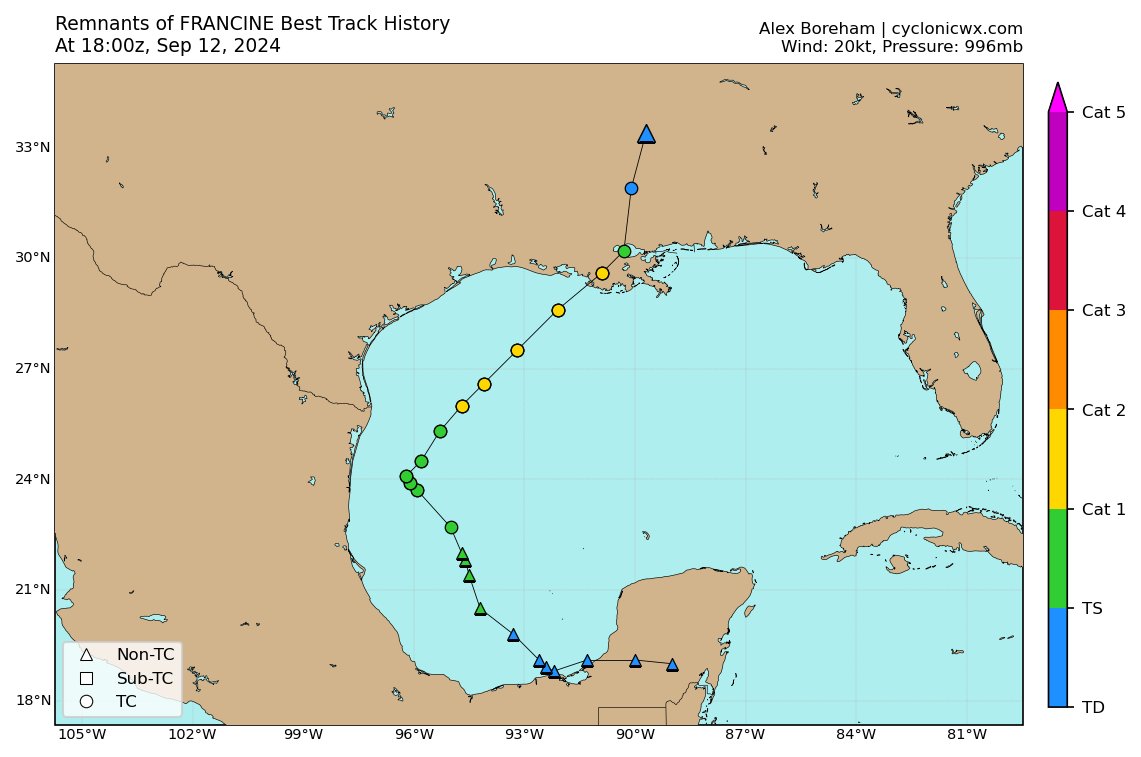
Model guidance gradually came into better focus regarding PTC 9's track, though there are some slight eastward shifts - the current consensus favors a track near Tallahassee.

There's still some across-track variability - potential landfall locations range Tampa to Panama City. Image
Sep 18, 2024 5 tweets 2 min read
There’s been plenty of talk about a potential tropical cyclone in the Caribbean & Gulf next week. While there is a legitimate signal for a storm, the details are less clear.

Some of you may have seen scary looking GFS maps, but likely without context. So, let’s add that context: Image At extended ranges when deterministic models (like the GFS, ECMWF) can significantly change from run to run, we like to look at ensembles to give a better sense of the range of possibilities.

Indeed, we see everything from a major hurricane, to a weaker storm, to no storm: Image
Sep 12, 2024 10 tweets 4 min read
(Slightly technical thread)

It may seem confusing to some that even though NHC stated Francine peaked as a category 2 hurricane, its Best Track file & plots made from it such as my site & @cyclonicwx only show a category 1 peak.

There is a logical explanation for this:
Image
Image
Hurricane data for the Atlantic & East Pacific basins is archived in the HURDATv2 dataset.

But HURDATv2 doesn’t include the current year, and is only updated in the spring of the following year. Right now, HURDATv2 only goes through 2023.
Jul 11, 2024 5 tweets 2 min read
A quick comment on Beryl - in hindsight we know a lot more about what actually happened, but before its landfall in the Yucatan there was still ample uncertainty regarding its peak intensity in the Gulf.

Much of that came down to how intact its core would emerge in the Gulf. Adding to the uncertainty was a brief - but significant - burst of intensification not long before Beryl's landfall in the Yucatan, which was not depicted by most models, but then followed by a more rapid weakening episode leading up to landfall. Image
Jul 8, 2024 5 tweets 3 min read
Here's a look at the multi-model ensemble forecast track for Beryl over the last 12 days.

There was a clear picture of a long-track Caribbean storm, but with larger errors for its ultimate Gulf landfall location - ensemble tracks ranged from the Bay of Campeche to New Orleans. Coarse global ensembles were consistently too weak & too far south with Beryl once it passed west of Jamaica, accordingly depicting its Gulf landfall too far south.

Short-term observations vs. forecasts made it easier to rule out the outliers:

Image
Jul 5, 2024 7 tweets 3 min read
Last night's run of the EPS ensemble shows a clear correlation between latitude and intensity for Hurricane Beryl - that is, stronger members are farther north, and weaker members are farther south.

Let's dive into this variability a bit more with ensemble sensitivity analysis: Image First we'll start with the leading mode of variability (EOF1) in the forecast MSLP field.

Not surprisingly, given the map in my previous post, it is expected that the leading mode of variability is a combination of amplitude & location variability: Image
Mar 16, 2024 17 tweets 3 min read
This is going to be a bit of a long thread, but there’s a lot of ground to cover here that can’t possibly be reasonably fit into 240 characters without losing nuance/context.

The first: we’ve seen a “silent revolution” in weather forecast skill over the last few decades. I call this a “silent revolution” because there wasn’t a *single* dramatic moment beyond which weather forecast skill instantly improved.

Thid improvement came from many areas: satellites, models, parameterizations, data assimilation, and computing resources.
Aug 31, 2023 4 tweets 2 min read
Not that there's enough tropical cyclone activity in the main Atlantic basin... but there's a low but non-zero probability of tropical transition west of the Iberian Peninsula worth noting, where SSTs are around 2C above normal. Image The biggest source of synoptic-scale uncertainty is where an anomalously deep upper-level low will track, as the farther west it cuts off and stalls off Spain/Portugal, the warmer sea surface temperatures are where an eventual surface cyclone will develop. Image
Aug 17, 2023 13 tweets 5 min read
Forecast confidence is increasing in a very unusual scenario where Tropical Storm Hilary impacts southwest California, particularly the San Diego & Los Angeles metros, with direct impacts.

I'll go more in-depth into the driving factors & potential impacts for CA in this thread. https://t.co/hHU4fIHMd0
Image 
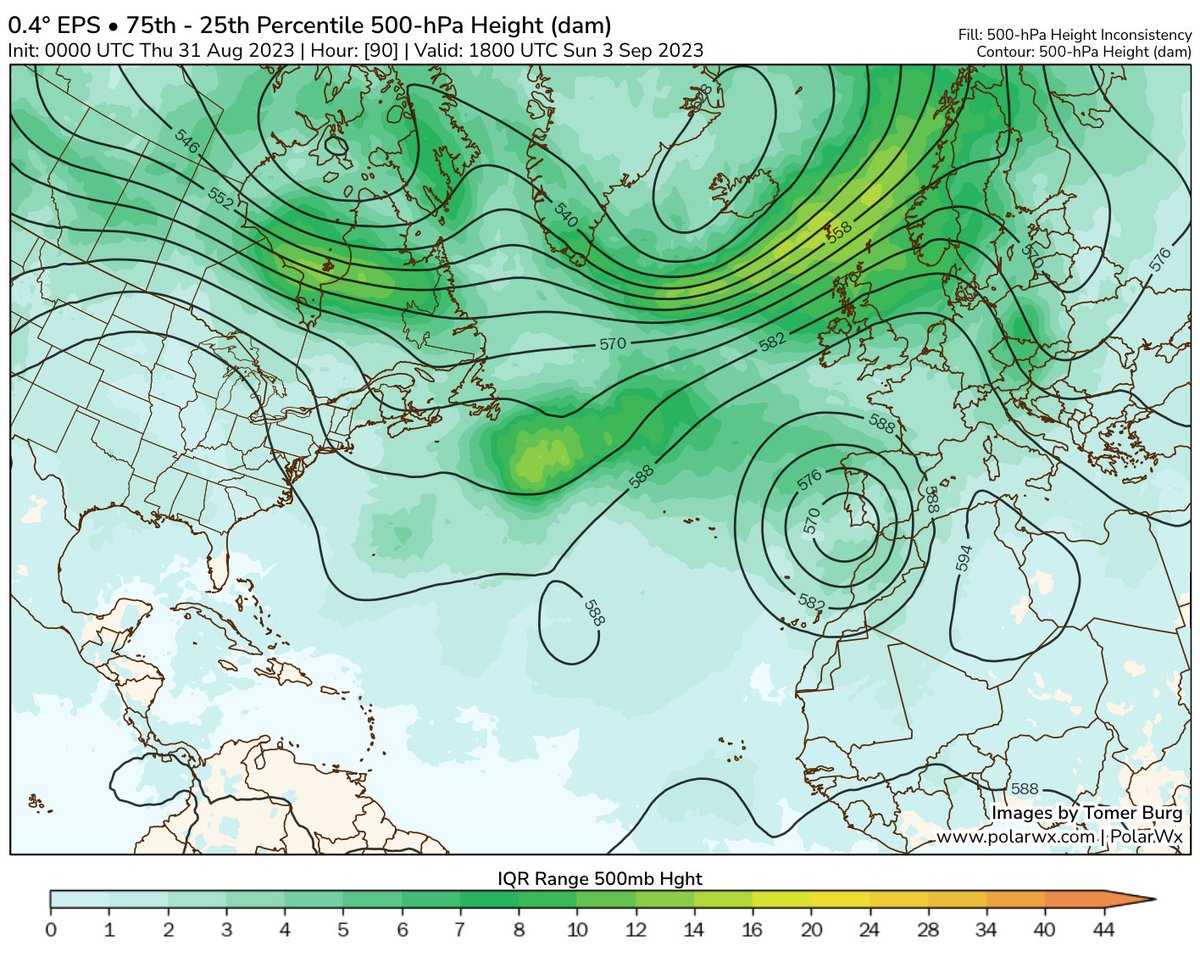
Starting with the short-term, Hilary will spend the next 2-3 days in a warm, moist & low vertical wind shear environment, which is *very* conducive for rapid intensification (RI) as shown by the SHIPS statistical model. Hilary is likely to become a very powerful hurricane. Image
Aug 15, 2023 8 tweets 4 min read
If you follow real-time weather models, you've likely seen some very extreme solutions modeled for next week.

I'll keep this thread hype & clickbait free while discussing legitimate scenarios for next week, between a heatwave & potential tropical cyclone approaching California. Image 
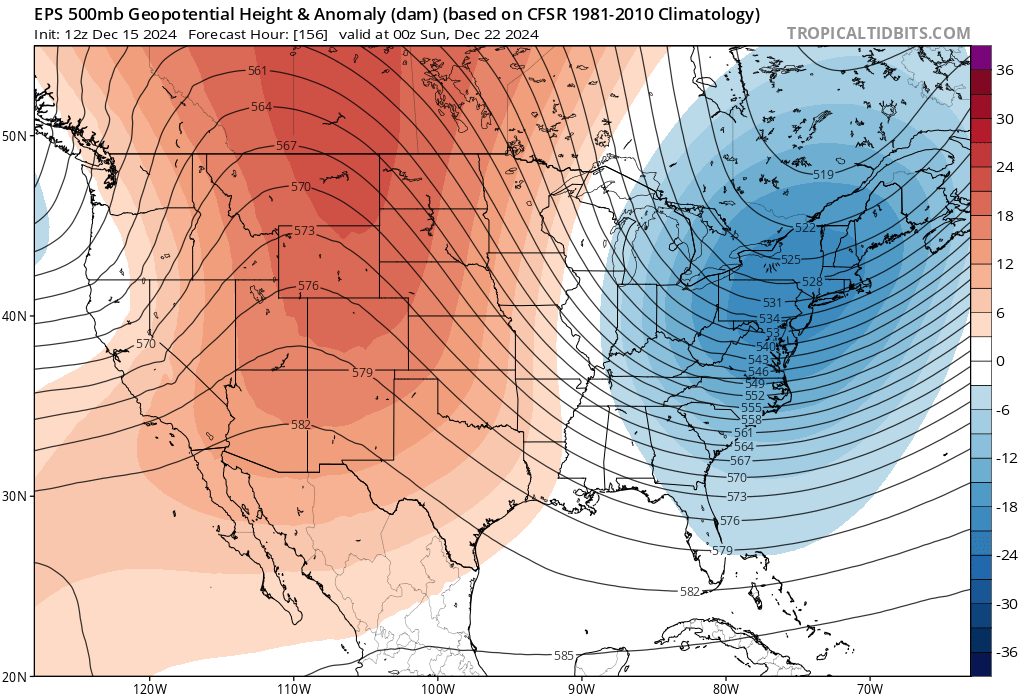
A notable feature & a precursor to potential CA tropical cyclone impacts is a massive ridge over the Plains.

While 500mb heights may challenge modern records (1950-present), surface temperatures appear unlikely to be nearly as record-breaking. The next post will cover why...
Image
Image