CyFi Profile picture
Jul 15 5 tweets 3 min read Read on X
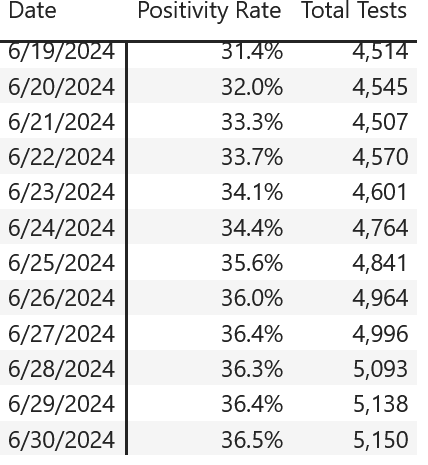
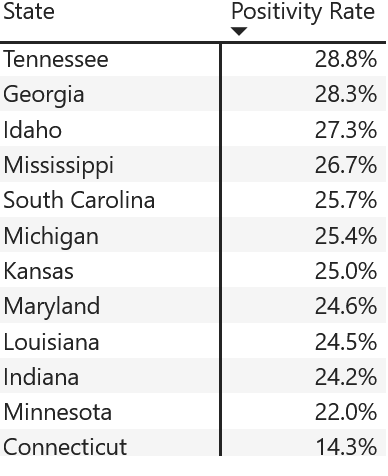
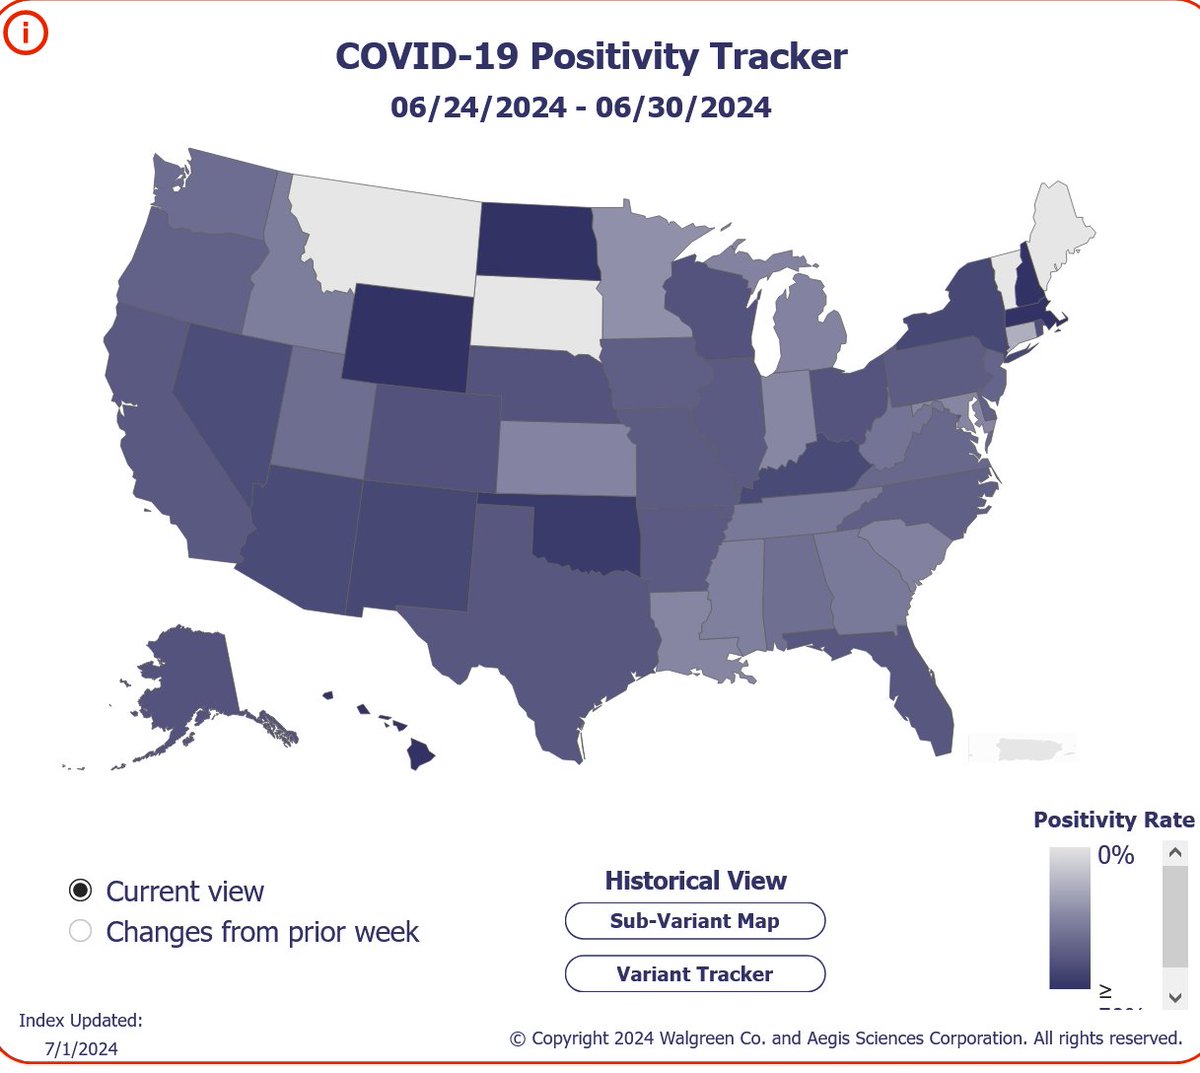
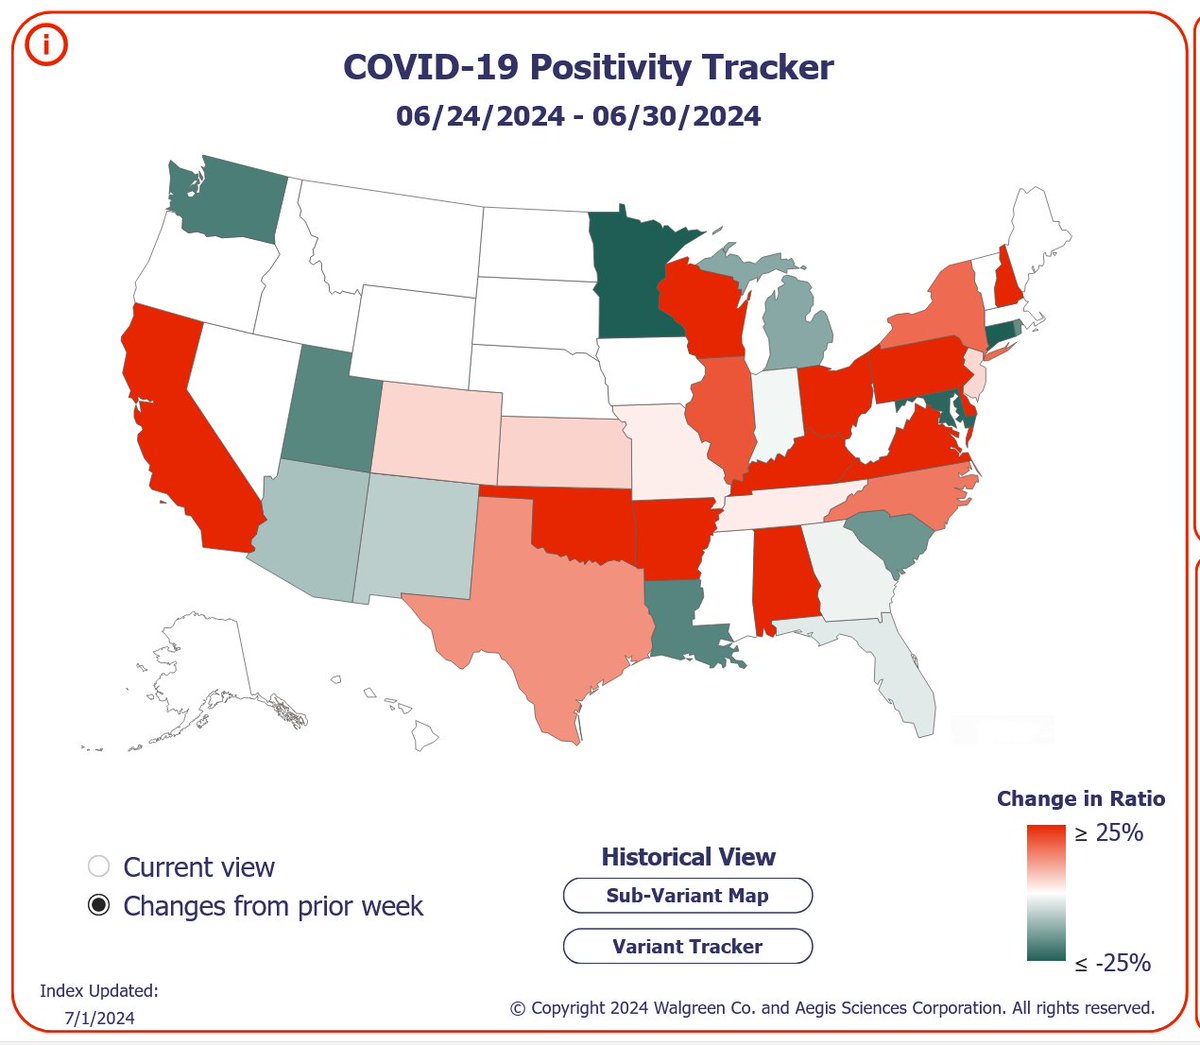
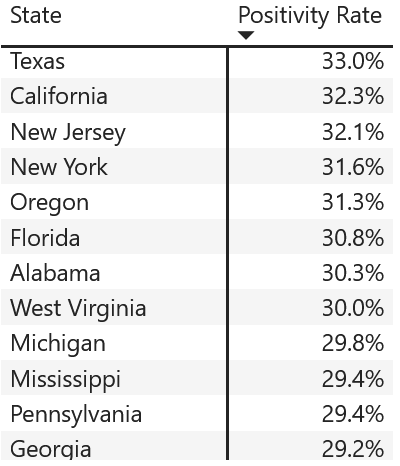
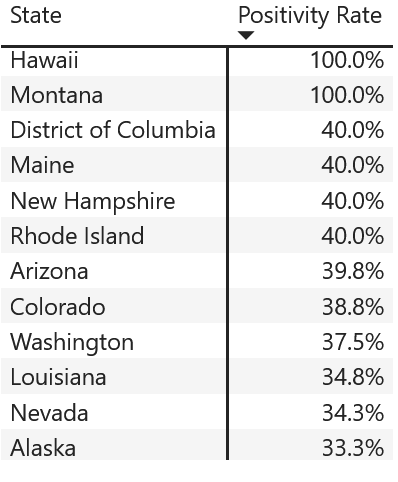
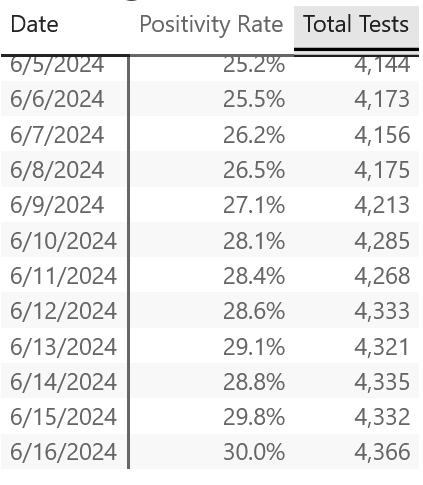
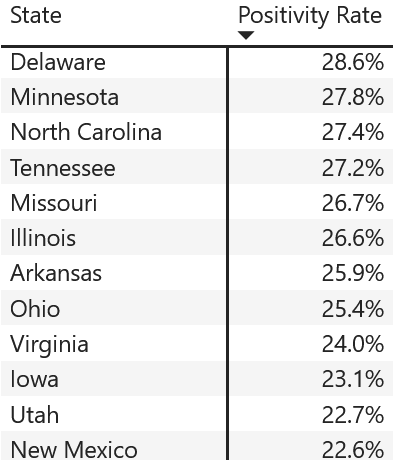
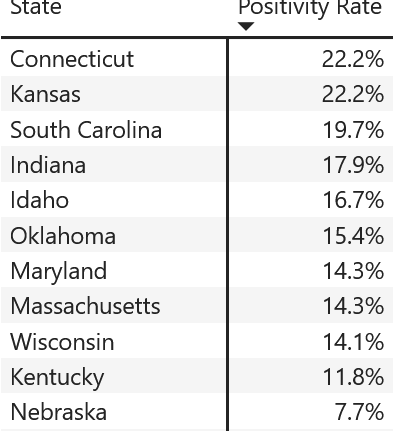
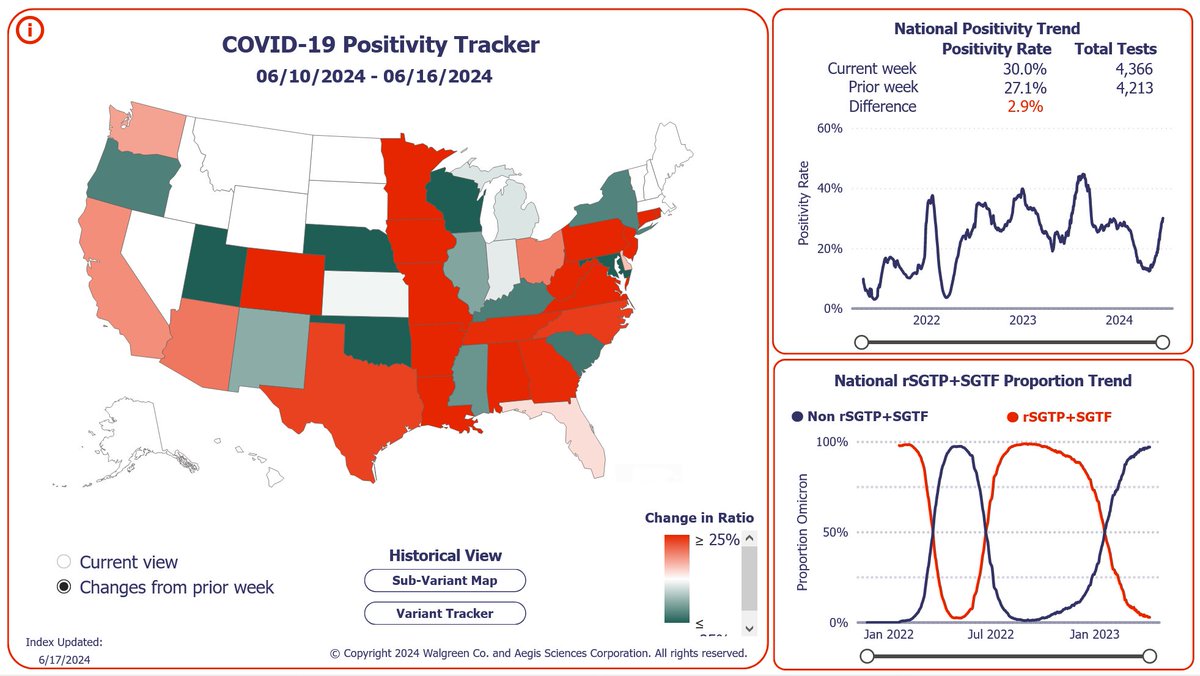
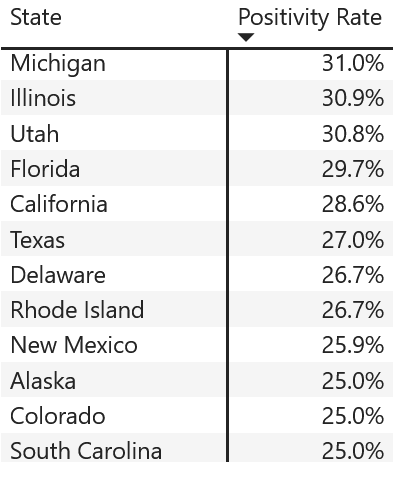
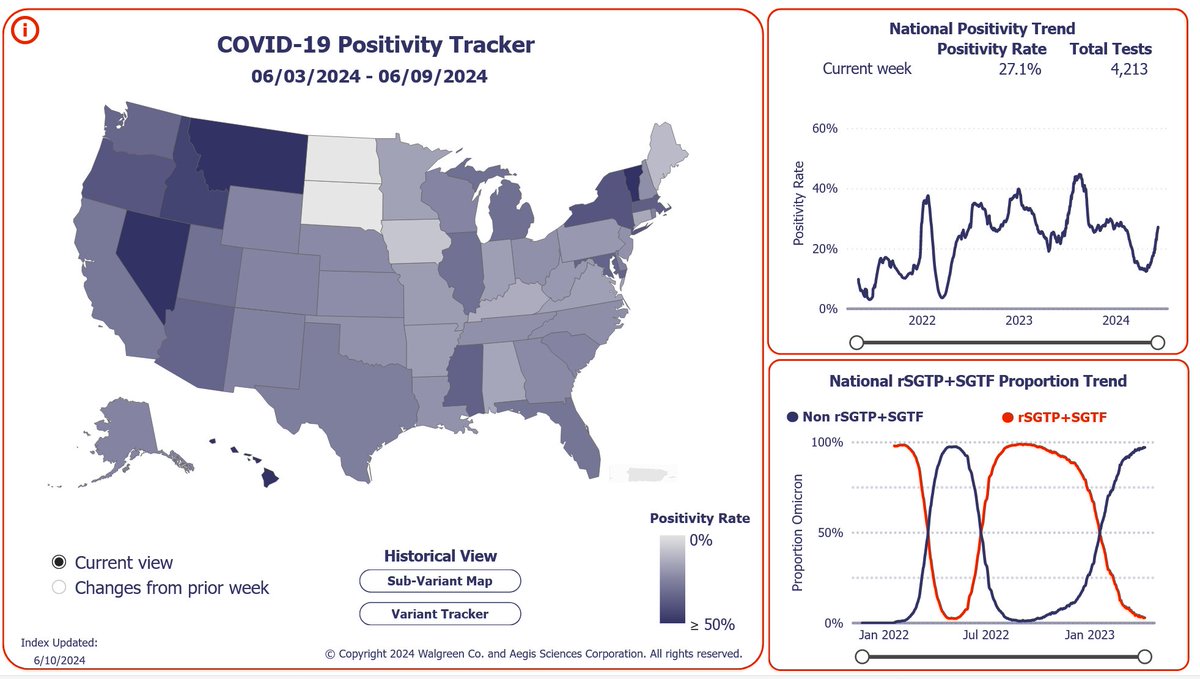
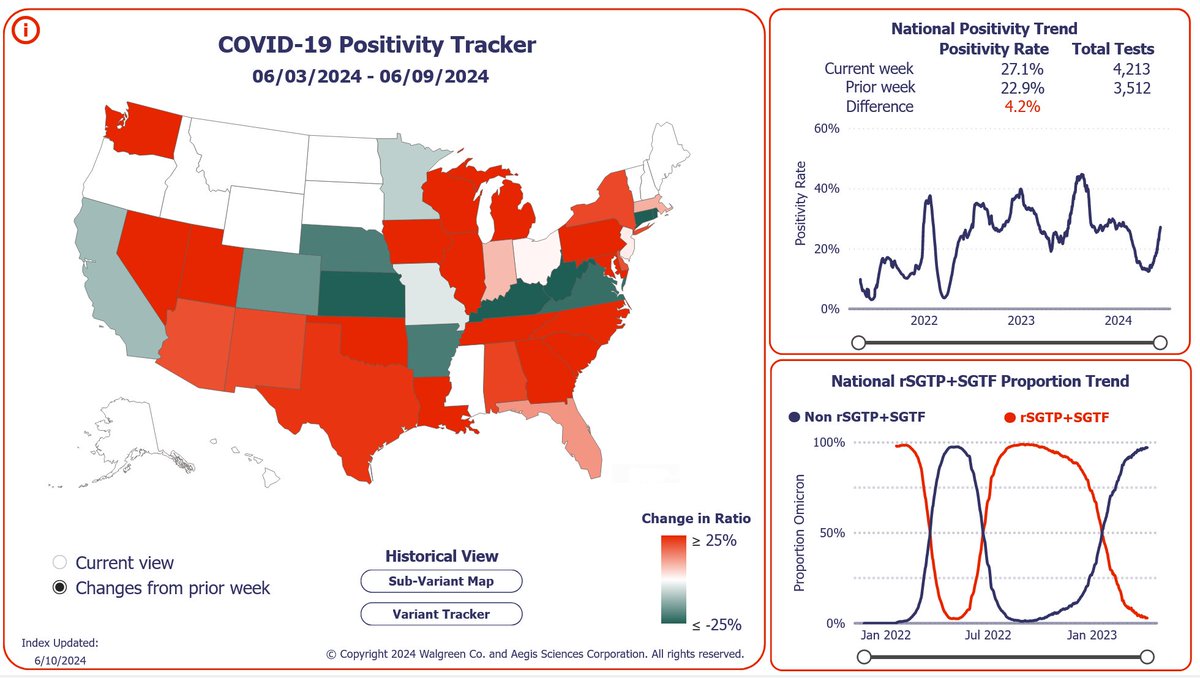
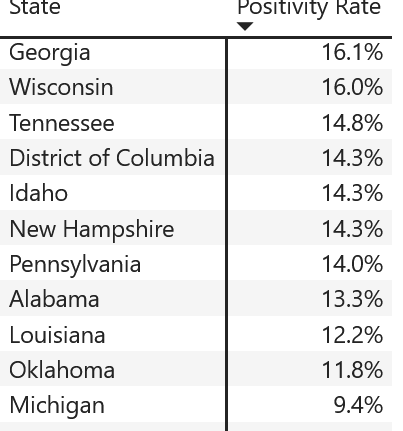
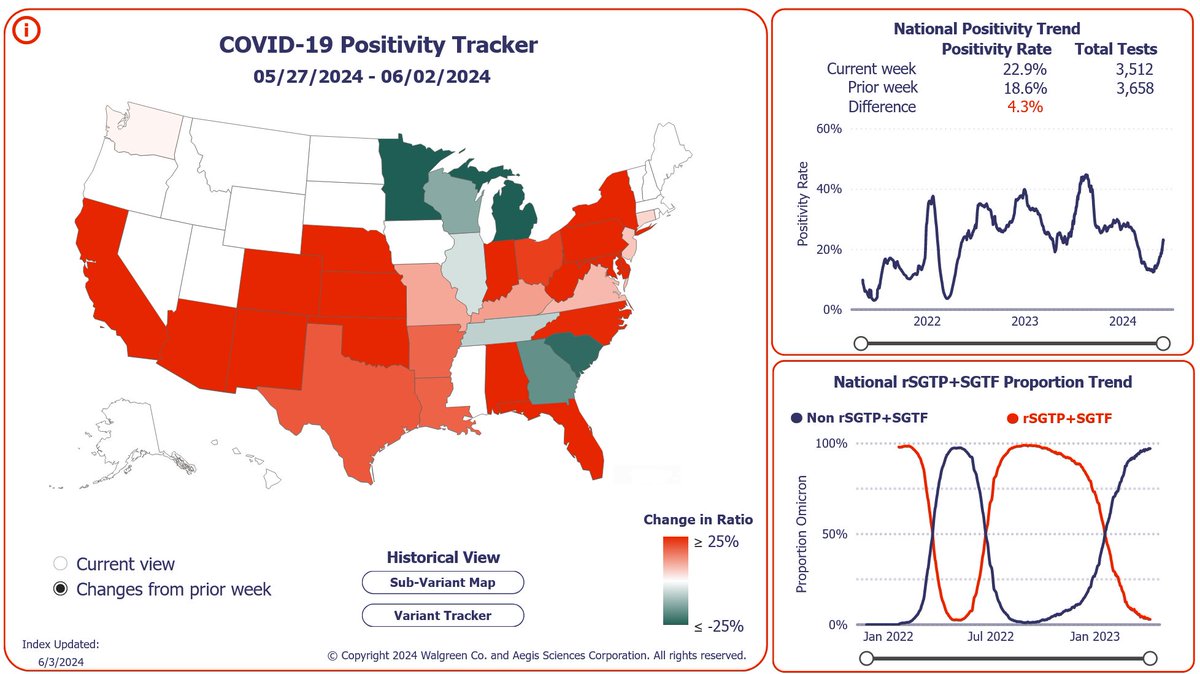
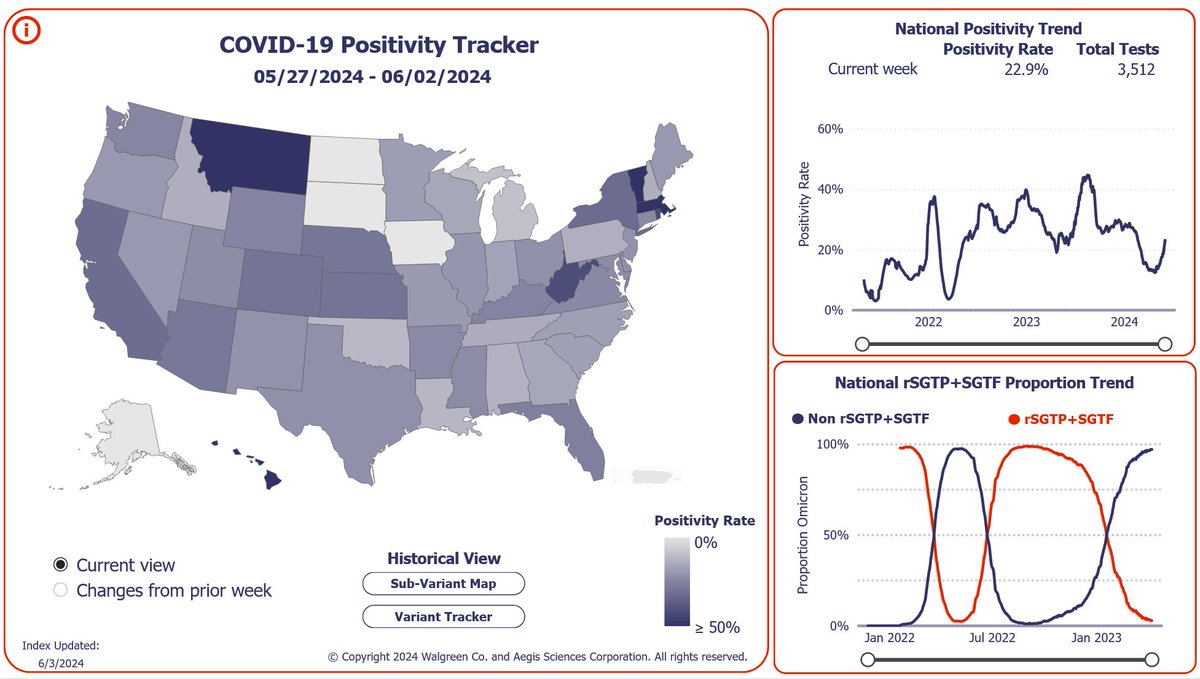
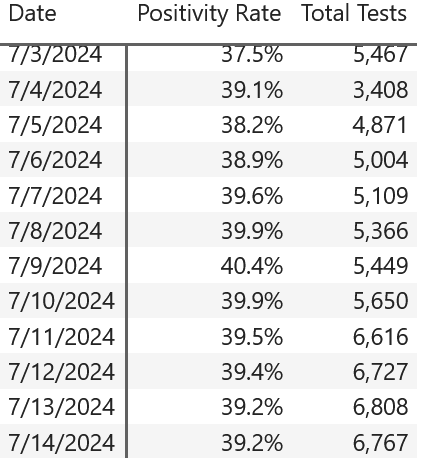
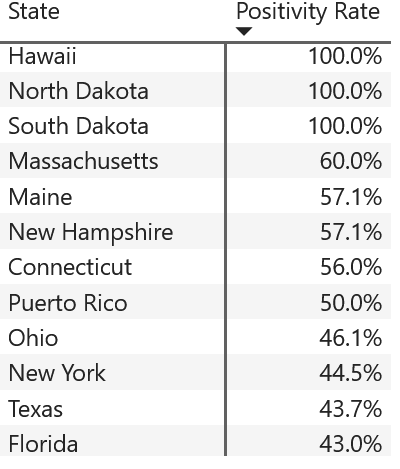
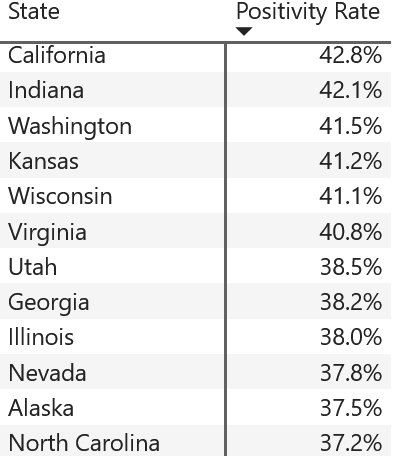
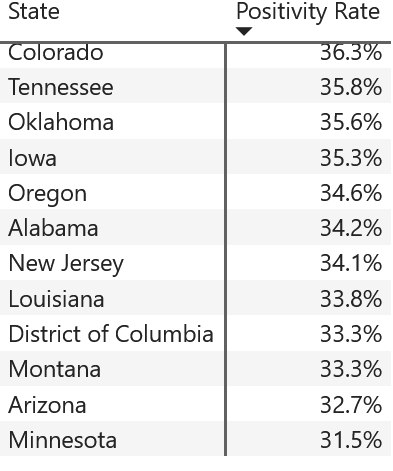
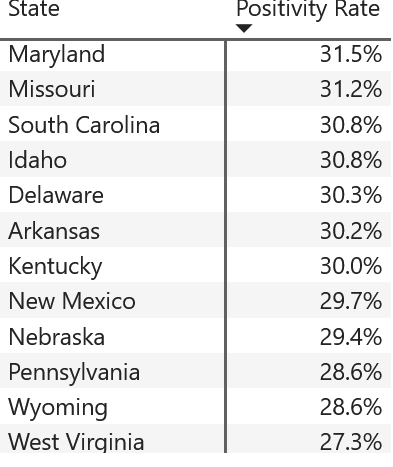
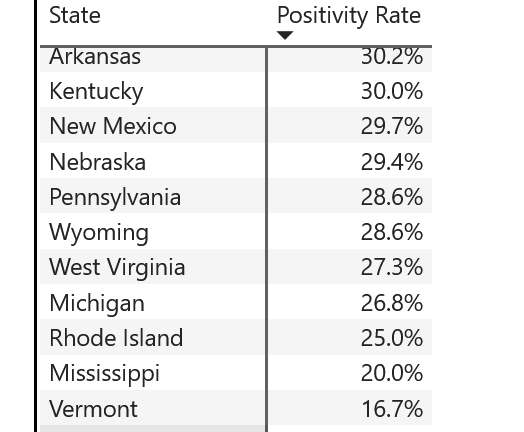
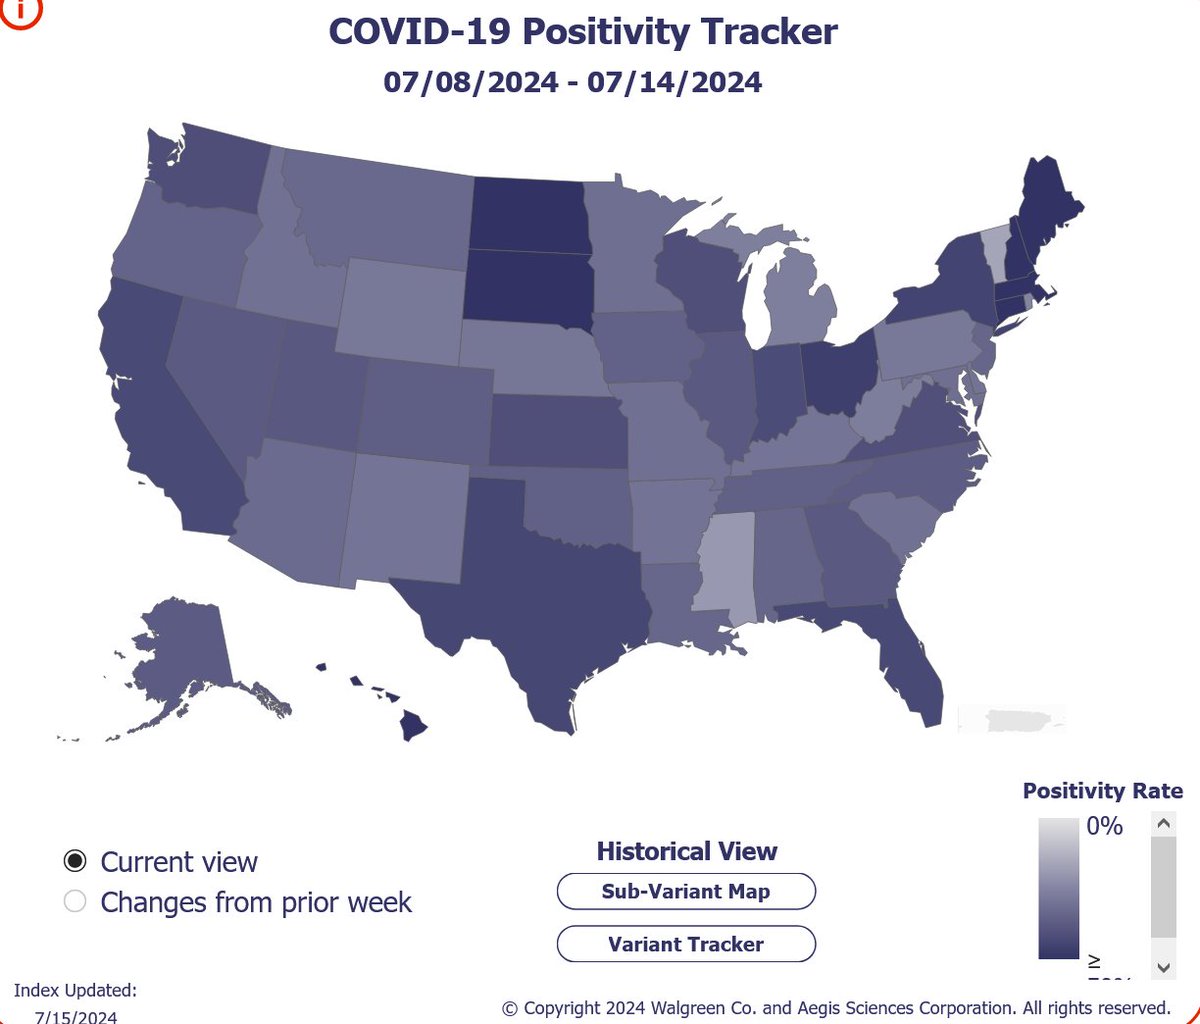
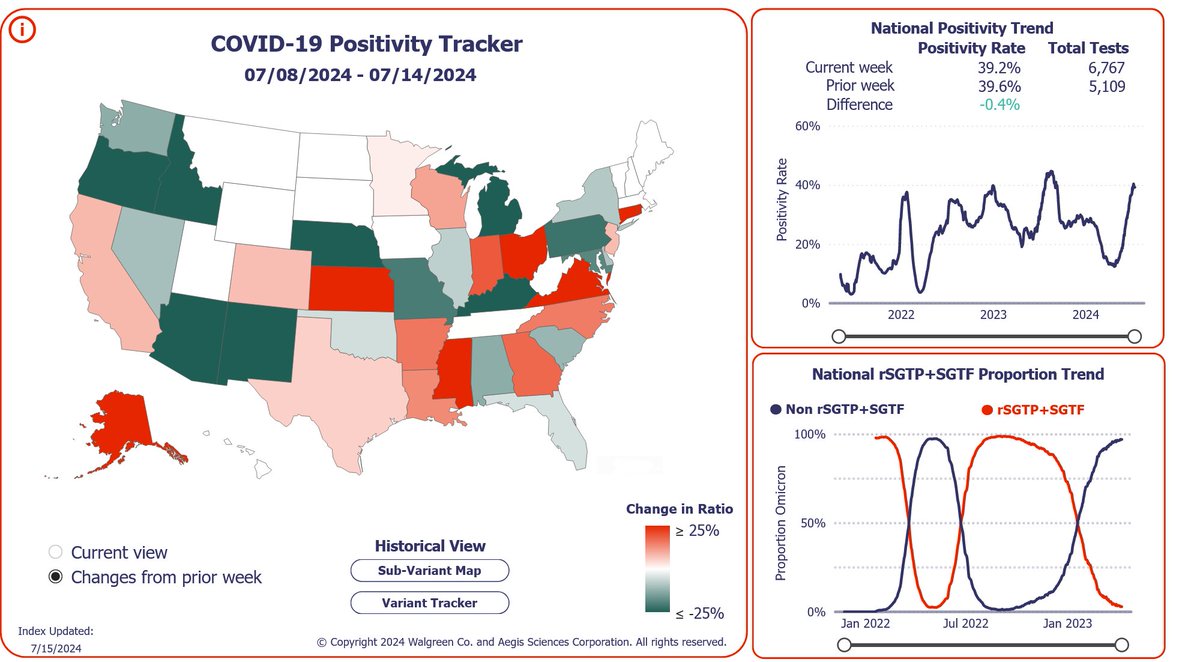
UPDATE: WALGREENS COVID TESTING DATA IS SHOWING THE LARGEST 1 DAY INCREASE IN TESTING SINCE JANUARY 8, 2024 (EXCLUDING HOLIDAY PERIODS) PRIOR TO THE INCREASE, POSITIVITY HIT 40.4% IN THIS WEEKS DATA, THE HIGHEST SINCE SEPTEMBER 6, 2023. AS OF YESTERDAY, POSITIVITY IS 39.2%, THE FIRST DECREASE AFTER 10 WEEKS OF INCREASES. TESTING IS THE HIGHEST SINCE APRIL 1, THE HIGHEST SINCE THE SUMMER WAVE BEGAN.Image
Image
Image
Image
2/Image
Image
Image
Image

• • •

Missing some Tweet in this thread? You can try to force a refresh
 

Keep Current with CyFi

CyFi Profile picture

Stay in touch and get notified when new unrolls are available from this author!

Read all threads

This Thread may be Removed Anytime!

PDF

Twitter may remove this content at anytime! Save it as PDF for later use!

Try unrolling a thread yourself!

how to unroll video
  1. Follow @ThreadReaderApp to mention us!

  2. From a Twitter thread mention us with a keyword "unroll"
@threadreaderapp unroll

Practice here first or read more on our help page!

More from @CyFi10

Jul 1
UPDATE: The Walgreens Covid positivity rate has increased for the 9th week in a row to 36.5%, the highest since September 13, 2023.Image
Image
Image
Image
States in white are either no change, or the testing level is not statistically significant.Image
Image
Image
Read 5 tweets
Jun 17
UPDATE: The US Walgreens Covid positivity rate is now the highest since September 2023! 🧵Image
Image
Image
Image
Plenty of red. See the line chart of rising positivity in the top right.Image
Image
Image
Read 4 tweets
Jun 10
UPDATE: Walgreens Covid positivity tracker is showing a 27.1% positive rate which is the highest since February 3! 🧵Image
Image
Image
Image
2/ Testing at Walgreens has been in a long term falling trend, however testing is at the highest level since April 25.Image
Image
Image
Read 5 tweets
Jun 3
UPDATE: Walgreens Covid positivity tracker is showing a significant increase in positivity. Positivity is the highest since February 22! 🧵


Image
Image
Image
Image
Lots of red this week. States in white had a low number of tests.Image
Image
Read 4 tweets
May 24
UPDATE: ILI activity from the CDC is updated. As you can see, the off season is significantly higher than they were before 2020 as seen on this graph. This is evidence people are getting sick more often than they were before 2020. The years shown are 2023-2024 and 2014-2019. Image
Here is the same graph from the previous tweet showing 2019 to present. Only 2022 was worse than it is now. Image
Read 4 tweets
Mar 23
This makes sense now.
Image
Image
Sources. I

Imagine being associated with a firm that is anti tobacco regulation in 2024.


greenpeace.org/usa/fighting-c…
usrtk.org/industry-pr/am…
Guess what he was doing in 2019? Scroll up this thread.
Read 5 tweets

Did Thread Reader help you today?

Support us! We are indie developers!


This site is made by just two indie developers on a laptop doing marketing, support and development! Read more about the story.

Become a Premium Member ($3/month or $30/year) and get exclusive features!

Become Premium

Don't want to be a Premium member but still want to support us?

Make a small donation by buying us coffee ($5) or help with server cost ($10)

Donate via Paypal

Or Donate anonymously using crypto!

Ethereum

0xfe58350B80634f60Fa6Dc149a72b4DFbc17D341E copy

Bitcoin

3ATGMxNzCUFzxpMCHL5sWSt4DVtS8UqXpi copy

Thank you for your support!

Follow Us!

:(