CyFi Profile picture
Pandemic updates || insight | breaking news || macroeconomics | geopolitics | markets | disasters | conflicts | science | climate | technology | OSINT
Feb 3 5 tweets 3 min read
ICYMI: The CDC on Friday reported extraordinary data with the most VERY HIGH states I have ever seen on the ARI map.
Influenza-Like-Illness is the highest since 2018, and the 2nd highest for the entire dataset going back to 1998 on a year over year basis.
South Carolina is in especially bad shape.Image
Image
Image
Image
last week
Jan 24 12 tweets 5 min read
NEW: The CDC reports COVID is rising in 9 states, echoing the Walgreens report on Monday.

The CDC reports FLU positivity of 25%, a new season high, and the 14th consecutive increase.Image
Image
Image
Image
2/
Covid positivity by HHS region here
Jan 13 7 tweets 3 min read
BREAKING: ILI activity, which includes FLU, COVID, and other pathogens, HIT AN ALL TIME PANDEMIC HIGH for the week ending January 4.

The CDC reports an increase in flu positivity for the week ending January 4 to 18.6%.

This release was delayed from Friday, and just released today.Image
Image
Image
Image
2/
2025 was worse than every year going back to 1998 except for 2000. Image
Jan 13 6 tweets 3 min read
BREAKING: Walgreens reports the highest amount of COVID testing since September on Jan 8.

As of Jan 12, US COVID positivity is 13.2%, the lowest since November 30.

Walgreens reports the largest 1 week drop in Positivity since October 31.
THREAD:
1/Image
Image
Image
Image
2/
Source: walgreens.com/healthcare-sol…Image
Image
Image
Dec 27, 2024 23 tweets 10 min read
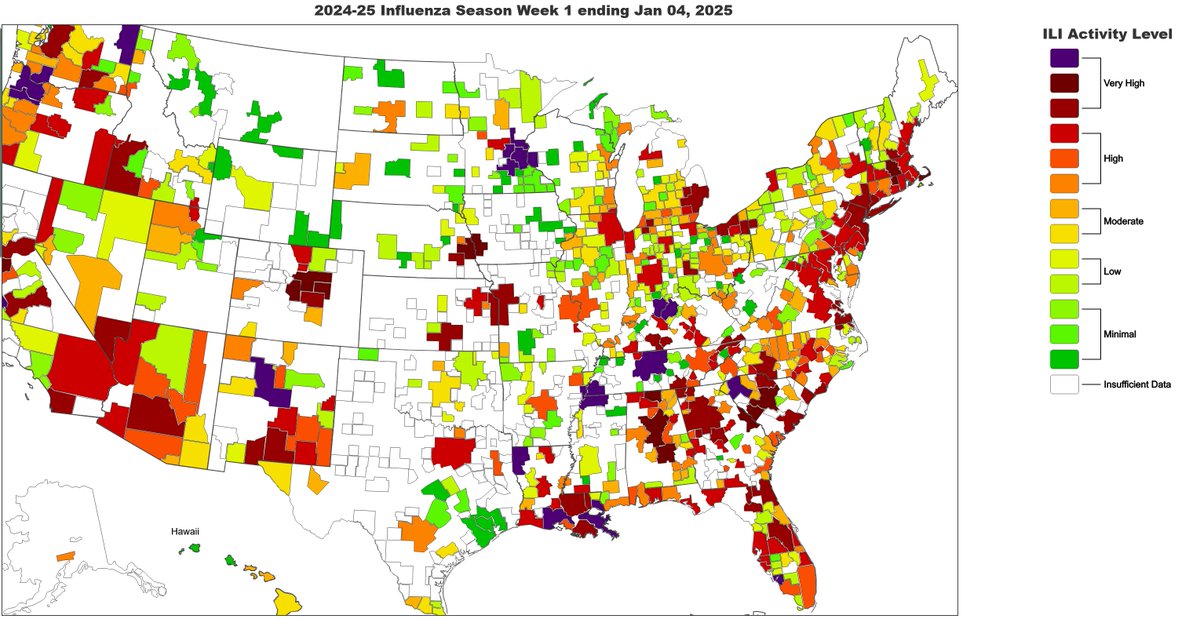
BREAKING: The CDC releases Influenza-Like-Illness map with several jurisdictions PURPLE, including Los Angeles county, Orange county, Portland, Oregon region, Nashville, TN region, Louisiana, and Birmingham, AL regionImage
Image
Image
Image
Last week
Oct 4, 2024 14 tweets 5 min read
CDC UPDATE: ILI ACTIVITY REPORT LISTED BELOW.
🚨SIGNIFICANTLY WORSE THAN PRE-COVD.
TREND IS TRACKING WITH THE DELTA WAVE.

FLU POSITIVITY IS ONLY 0.543, SO THE EXCESS IS ALL COVID
🧵 Image Last week was revised upward, which happens nearly every week.
2/
Sep 27, 2024 4 tweets 2 min read
BREAKING: The CDC releases updated virus positivity rates, and ILI activity data with a 6 day lag.

Covid positivity is down in all HHS regions except 10 (WA, AK, OR, ID) which saw a small increase.
SARS-CoV-2 positivity is shown ih the 4th image.
THREAD 1/Image
Image
Image
Image
ILI activity is 141% higher than 2008, a year with comparable Flu positivity to present.

Flu positivity is the lowest since 2020. Image
Sep 3, 2024 6 tweets 3 min read
COVID UPDATE: The Walgreens Covid index is indicating a NEW Summer 2023-2024 testing RECORD HIGH of 14.3k tests on August 28, with testing at the highest rate since Summer 2022!

The positivity rate is ~11x higher than the pandemic all time record low of June 18, 2021.

The positivity rate is has declined for the 4th week in a row, and is the lowest since June 20th. 🧵Image
Image
Image
Image
Not shown: IDAHO 17.9% positivity rate
States in white not statistically significant OR no change.
2/Image
Image
Image
Aug 20, 2024 7 tweets 3 min read
BREAKING: Walgeens Covid data is showing a NEW Summer season 2023-2024 testing RECORD high, the highest since 2022 Summer when tests were highly subsidized.
Colorado hit a 2024 RECORD positivity high on Aug 16.
Positivity data is showing a steady dropping pattern for the 2nd week in a row.
Positivity is the lowest since July 2, and has dropped 3.5% from the August 6 high.
Testing is the highest since March 4.
🧵Image
Image
Image
Image
2/Image
Image
Image
Aug 16, 2024 9 tweets 3 min read
UPDATE: For the first time during this Summer Covid wave, ILI (influenza like illness) activity EXCEEDS 2022 year over year as reported in this week's CDC report.

ILI activity for the week ending Aug 3 in 2024 is 112% worse than 2019.
For the week ending Aug 10 it is 100% worse now than in 2019.

The CDC revised upward by ~5.7% LAST weeks ILI activity! This is the highest upward revision I have reported since began tracking ILI this year.

Last week I reported ages 25+ were more adversely affected more than ages 0-24.

This is hard evidence that the population as a whole are MUCH worse off now than the same period in 2019.
🧵Image 2/ The latest week is below Image
Aug 13, 2024 6 tweets 3 min read
BREAKING: Walgreens Covid data is showing a new summer 2023-2024 testing record high on August 11 of over 12k tests, the highest during summer since 2022. Data is updated to Monday, August 12 showing a positive rate of 38.3% the lowest since July 5. NEW data shown below. 🧵Image
Image
Image
Image
Walgreens updated data to Monday today.Image
Image
Image
Image
Aug 12, 2024 9 tweets 3 min read
BREAKING: Walgreens Covid data is reporting a NEW PANDEMIC ALL TIME RECORD POSITIVITY HIGH of 40.5% on August 6 when excluding weeks with under 9k tests.
A new summer testing high was reached with 11.2k tests done, and testing is still trending higher. This is the highest testing rate during summer since 2022! Data shows the latest positivity rate of 39.4% as of August 8.Image
Image
Image
Image
Not shown: Idaho 21.4%Image
Image
Image
Aug 5, 2024 7 tweets 3 min read
UPDATE: As of August 4, Walgreens is reporting COVID testing positivity of 40.2% which is ONLY .3% lower than the 40.5% hit on July 18 *AND* TESTING HIT A NEW SUMMER HIGH OF OVER 10.5K! The peak may still be yet to come according to this report. 🧵Image
Image
Image
Image
2/Image
Image
Image
Jul 15, 2024 5 tweets 3 min read
UPDATE: WALGREENS COVID TESTING DATA IS SHOWING THE LARGEST 1 DAY INCREASE IN TESTING SINCE JANUARY 8, 2024 (EXCLUDING HOLIDAY PERIODS) PRIOR TO THE INCREASE, POSITIVITY HIT 40.4% IN THIS WEEKS DATA, THE HIGHEST SINCE SEPTEMBER 6, 2023. AS OF YESTERDAY, POSITIVITY IS 39.2%, THE FIRST DECREASE AFTER 10 WEEKS OF INCREASES. TESTING IS THE HIGHEST SINCE APRIL 1, THE HIGHEST SINCE THE SUMMER WAVE BEGAN.Image
Image
Image
Image
2/Image
Image
Image
Image
Jul 1, 2024 5 tweets 3 min read
UPDATE: The Walgreens Covid positivity rate has increased for the 9th week in a row to 36.5%, the highest since September 13, 2023.Image
Image
Image
Image
States in white are either no change, or the testing level is not statistically significant.Image
Image
Image
Jun 17, 2024 4 tweets 2 min read
UPDATE: The US Walgreens Covid positivity rate is now the highest since September 2023! 🧵Image
Image
Image
Image
Plenty of red. See the line chart of rising positivity in the top right.Image
Image
Image
Jun 10, 2024 5 tweets 3 min read
UPDATE: Walgreens Covid positivity tracker is showing a 27.1% positive rate which is the highest since February 3! 🧵Image
Image
Image
Image
2/ Testing at Walgreens has been in a long term falling trend, however testing is at the highest level since April 25.Image
Image
Image
Jun 3, 2024 4 tweets 2 min read
UPDATE: Walgreens Covid positivity tracker is showing a significant increase in positivity. Positivity is the highest since February 22! 🧵


Image
Image
Image
Image
Lots of red this week. States in white had a low number of tests.Image
Image
May 24, 2024 4 tweets 2 min read
UPDATE: ILI activity from the CDC is updated. As you can see, the off season is significantly higher than they were before 2020 as seen on this graph. This is evidence people are getting sick more often than they were before 2020. The years shown are 2023-2024 and 2014-2019. Image Here is the same graph from the previous tweet showing 2019 to present. Only 2022 was worse than it is now. Image
Mar 23, 2024 5 tweets 2 min read
This makes sense now.
Image
Image
Sources. I

Imagine being associated with a firm that is anti tobacco regulation in 2024.


greenpeace.org/usa/fighting-c…
usrtk.org/industry-pr/am…