Every quarter I spend a few days combing through onchain data to compile Ethereum's financial performance so that you don't have to.
A 🧵on the L2 sector performance in Q2:
Active users: L2s now have 6x that of the L1 (up from 3x last qtr)
Data: @tokenterminal
A 🧵on the L2 sector performance in Q2:
Active users: L2s now have 6x that of the L1 (up from 3x last qtr)
Data: @tokenterminal

Active addresses/users on L2 only:
@arbitrum averaging more than Ethereum now.
@base in the number 2 spot.
Data: @tokenterminal
@arbitrum averaging more than Ethereum now.
@base in the number 2 spot.
Data: @tokenterminal

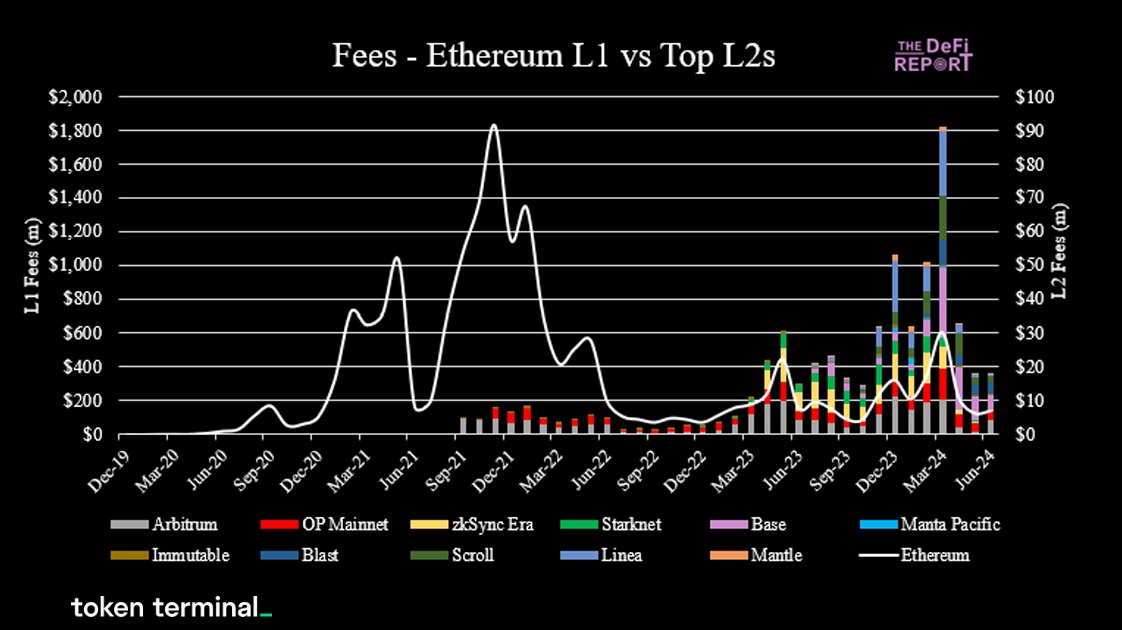
Fees: ETH vs L2s
ETH Fees dropped $679m in Q2 due to EIP4844 👀
Activity on L2s increased, but with fees dropping due to tech upgrades, sequencer revenues were flat for the qtr.
Data: @tokenterminal
ETH Fees dropped $679m in Q2 due to EIP4844 👀
Activity on L2s increased, but with fees dropping due to tech upgrades, sequencer revenues were flat for the qtr.
Data: @tokenterminal
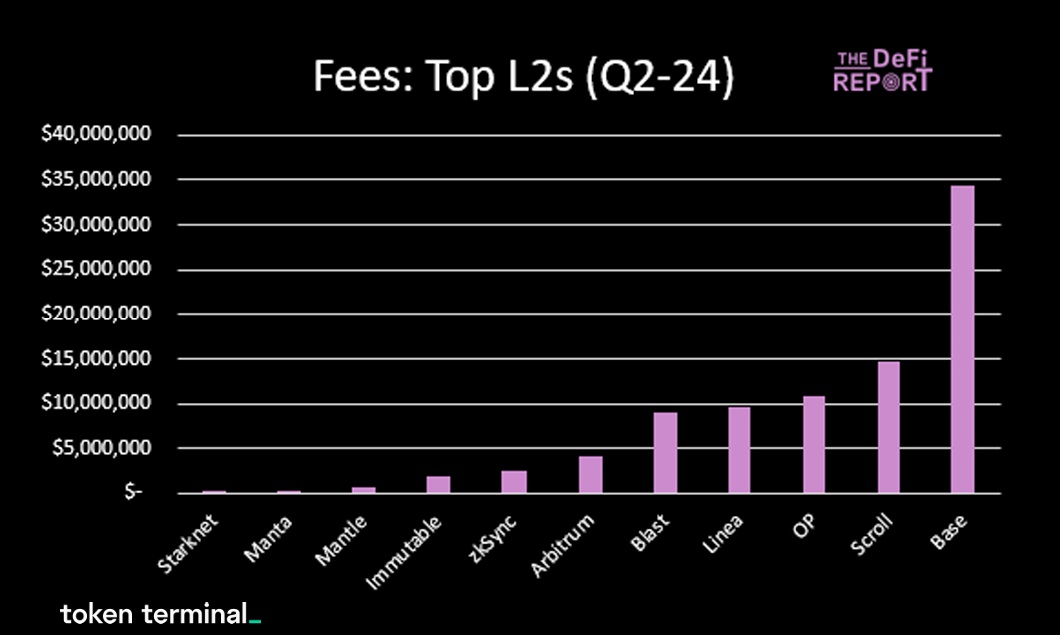
Fees - L2s only.
@base dominating the field here. Note that @arbitrum was #1 in tx, but #6 in fees -- due to cost/tx significantly lower than Base during the qtr.
Data: @tokenterminal
@base dominating the field here. Note that @arbitrum was #1 in tx, but #6 in fees -- due to cost/tx significantly lower than Base during the qtr.
Data: @tokenterminal
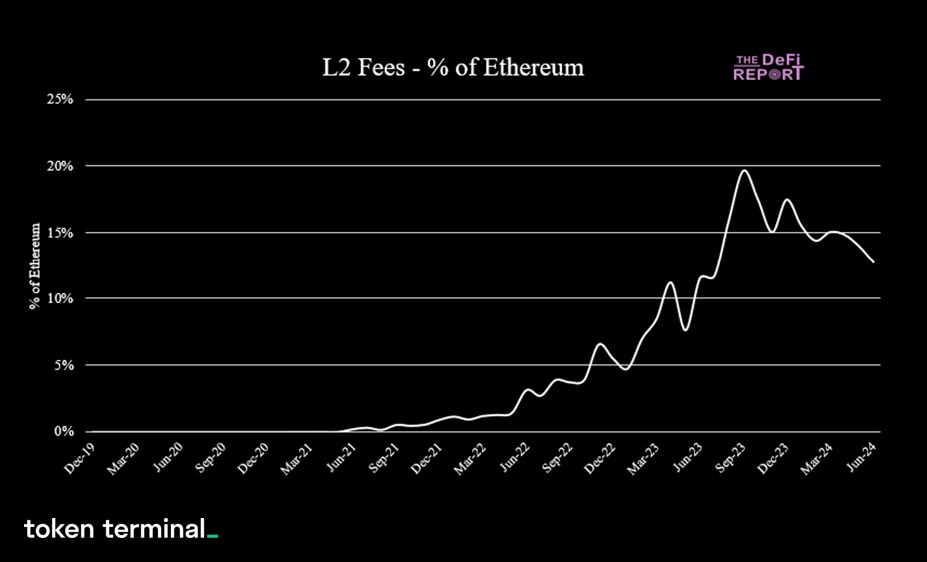
Fees - L2s as a % of Ethereum: 13% in Q2
This is down from a peak of nearly 20% in Q4 of last year. Largely due to EIP4844.
Data: @tokenterminal
This is down from a peak of nearly 20% in Q4 of last year. Largely due to EIP4844.
Data: @tokenterminal
The combined daily cost of revenue for the top L2s:
Fell off a cliff.
Once again, EIP4844 telling the story in Q2.
Data: @tokenterminal
Fell off a cliff.
Once again, EIP4844 telling the story in Q2.
Data: @tokenterminal

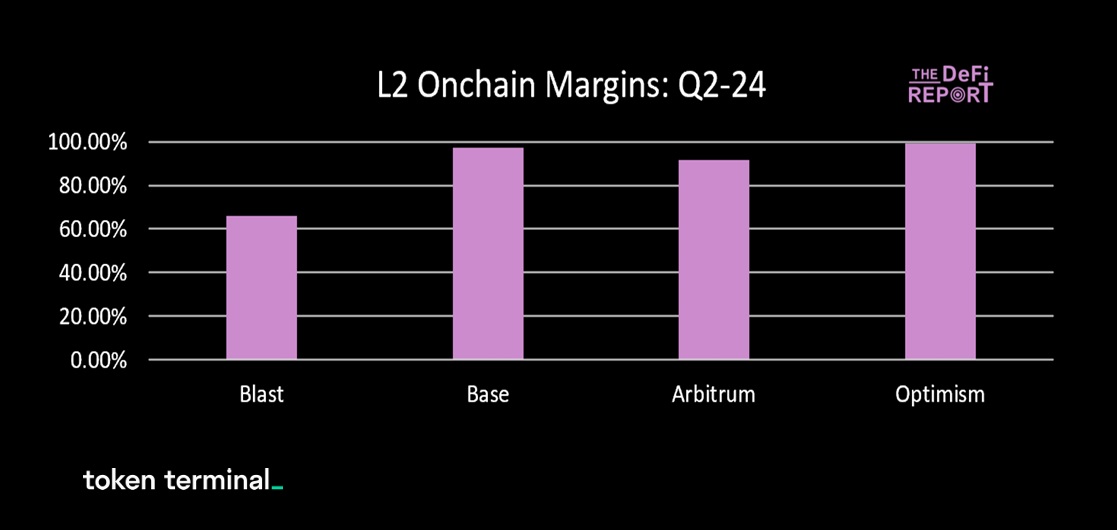
Onchain margins:
Improved dramatically in Q2.
@Optimism was 99%.
@base = 97% (does not include payments to OP)
@arbitrum 92%
@blast 66% (improved to 96% upon implementation of blobs in late May)
The catalyst? EIP4844
Data: @tokenterminal
Improved dramatically in Q2.
@Optimism was 99%.
@base = 97% (does not include payments to OP)
@arbitrum 92%
@blast 66% (improved to 96% upon implementation of blobs in late May)
The catalyst? EIP4844
Data: @tokenterminal
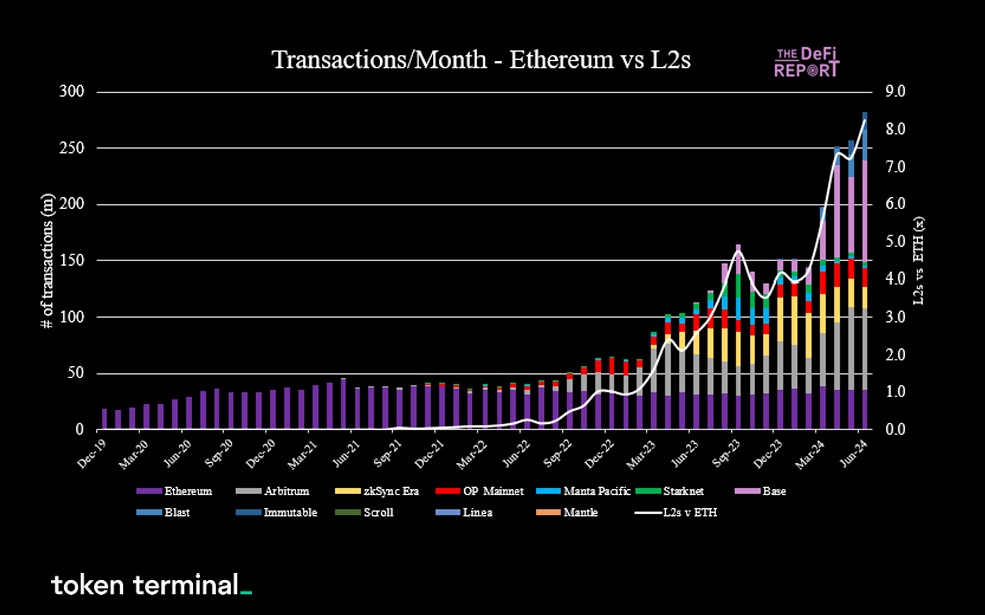
Transactions: ETH vs L2s
L2s are now nearly 9x that of ETH L1 (up from 4x last qtr).
Data: @tokenterminal
L2s are now nearly 9x that of ETH L1 (up from 4x last qtr).
Data: @tokenterminal
Transactions: L2s only
@base leading the pack with @arbitrum in the #2 spot.
Data: @tokenterminal
@base leading the pack with @arbitrum in the #2 spot.
Data: @tokenterminal

Cost per transaction:
@arbitrum was cheapest in Q2 at just over 2 cents/tx.
Data: @tokenterminal
@arbitrum was cheapest in Q2 at just over 2 cents/tx.
Data: @tokenterminal

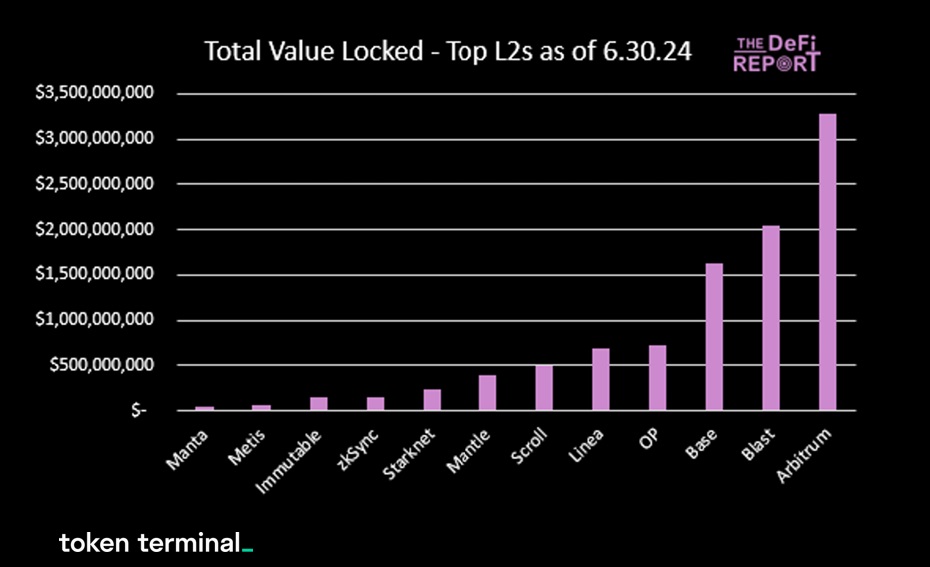
Total Value Locked:
@arbitrum leading the pack once again with over $3.3b as of 6/30. Notable to see @blast in the #2 spot ahead of @base
Data: @tokenterminal
@arbitrum leading the pack once again with over $3.3b as of 6/30. Notable to see @blast in the #2 spot ahead of @base
Data: @tokenterminal
Contracts deployed: ETH vs L2s
L2s combined for 10x that of ETH L1 during Q2
Data: @tokenterminal
L2s combined for 10x that of ETH L1 during Q2
Data: @tokenterminal

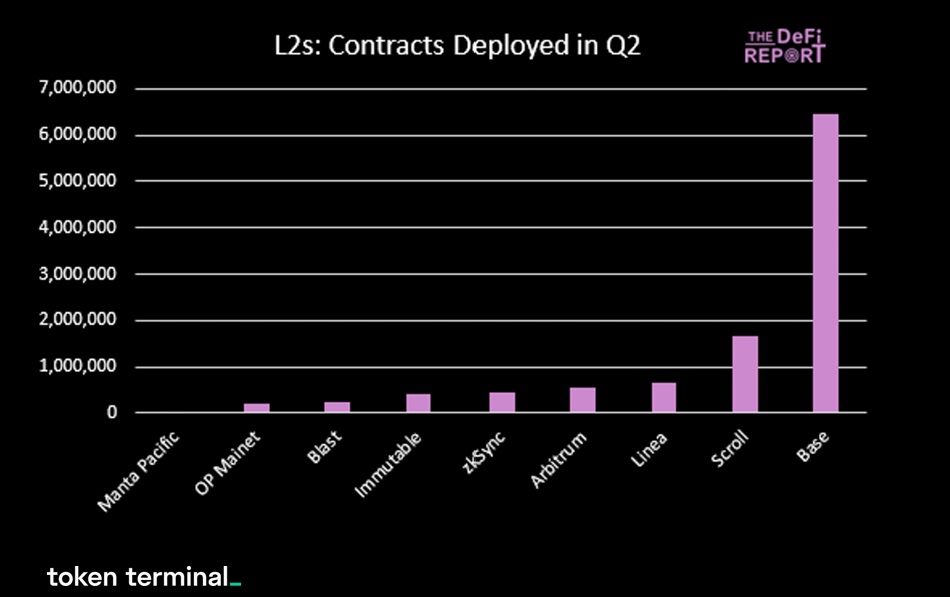
Contracts deployed, L2s only:
@base dominating the field.
Data: @tokenterminal
@base dominating the field.
Data: @tokenterminal
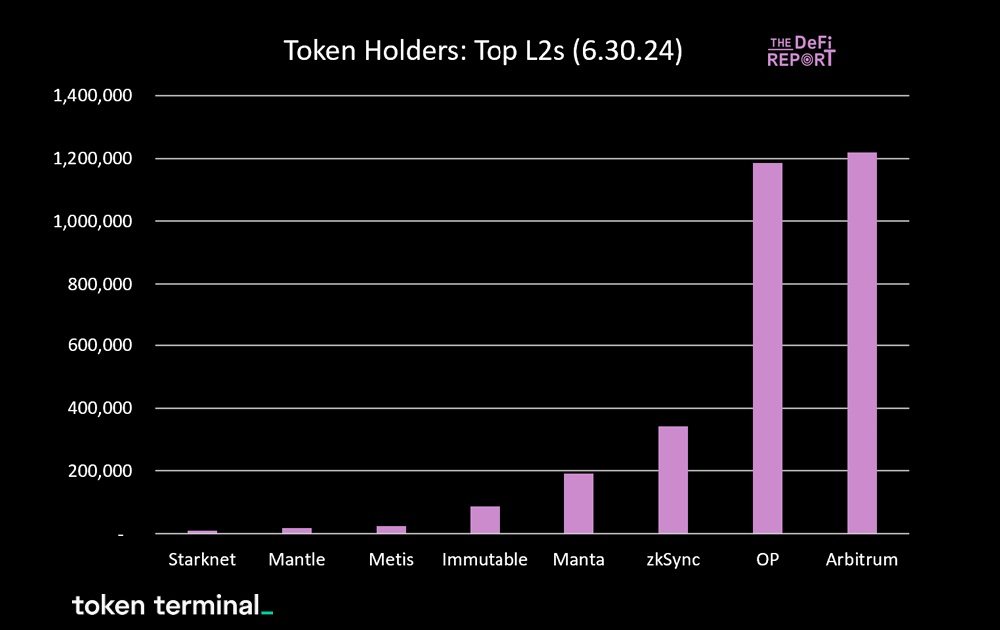
Token holders:
@arbitrum and @Optimism leading the pack with approximately 1.2m holders.
For reference, ETH L1 had over 123m as of 6/30.
Data: @tokenterminal
@arbitrum and @Optimism leading the pack with approximately 1.2m holders.
For reference, ETH L1 had over 123m as of 6/30.
Data: @tokenterminal
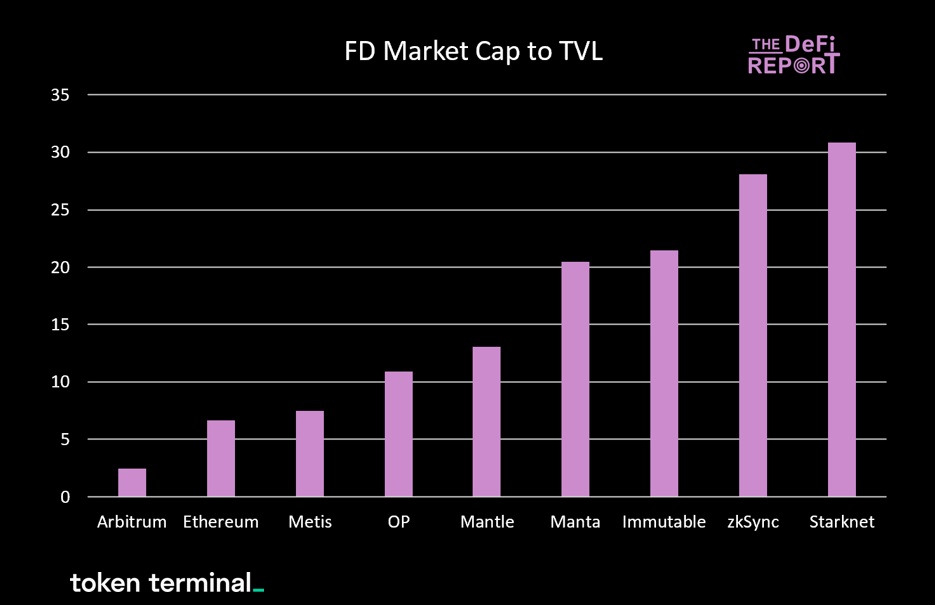
Valuation: FD Market cap to TVL
@arbitrum providing the best value in the market.
@arbitrum providing the best value in the market.
Want more?
If you'd like to access all 77 charts covering ETH's Q2 performance, including:
- Operating performance
- Token economics
- Stablecoins
- RWAs
- DeFi
- Onchain P&L
- Valuation
- Correlations
- ETH vs SOL
access here:
thedefireport.io/ethereum-inves…
If you'd like to access all 77 charts covering ETH's Q2 performance, including:
- Operating performance
- Token economics
- Stablecoins
- RWAs
- DeFi
- Onchain P&L
- Valuation
- Correlations
- ETH vs SOL
access here:
thedefireport.io/ethereum-inves…
https://x.com/JustDeauIt/status/1813634431804211426
• • •
Missing some Tweet in this thread? You can try to
force a refresh