Founder @ The DeFi Report | Research, Market Insights and Onchain Data: https://t.co/xa8A2CcHq8
The Signal Podcast: https://t.co/zKz8yH5y3r
Nov 5 • 7 tweets • 4 min read
Ethereum's Roadmap is under fire.
But have we truly grasped the *economic* ripples that every proposal sets in motion?
Each pivot, upgrade, and idea impacts more than just the blockchain itself.
It shapes the experiences, challenges, and fortunes of:
1. Developers 2. Users 3. Validators 4. Service Providers 5. And Investors
That’s why I created a dashboard on @tokenterminal breaking it all down.
Past. Present. And Future.
A 🧵with some insights from the dashboard + a link at the end for those looking to go deeper 👇
Starting with EIP1559 in August of '21:
$12.4b has been “burned” or bought back since it’s implementation.
1/7
Shifting to ETH 2.0 and the move to Proof of Stake in Sept. '22:
Annual issuance dropped 88% overnight.
Impact on Validators:
1. Now compensated with tips from users (fees paid in excess of the base fee for block inclusion) + new issuance.
2. Compensation from new issuance was reduced by 88% overnight (from roughly 13.5k ETH/day to 1.7k ETH/day).
3. Overhead costs (energy) reduced by 99.9%.
4. Compensation from fees + new issuance is now determined by the validator's portion of ETH staked pro-rata to the amount of ETH staked on the network.
[see dashboard for impact on ETH holders]
2/7
Oct 31 • 7 tweets • 4 min read
So many bad takes on the timeline regarding Ethereum vs Solana right now.
It's about time we cut through the noise with a data-driven approach.
That's why I created an absolute banger of a dashboard comparing the economics of the two networks across:
1. Go-To-Market Strategy 2. Value Accrual 3. Total Economic Value 4. Cost to Produce $1 Fee Revenue 5. Network Fundamentals 6. Performance & Valuation
It's both quantitative and qualitative.
A quick 🧵with some takeaways + a link to the dashboard via @tokenterminal at the end 👇
Takeaway #1: It's now about 50% cheaper to transact on Arbitrum than Solana. In fact, it's cheaper to transact on half of the top L2s.
1/7
Shifting to Total Network Fees:
Takeaways:
1. Ethereum + the top L2s have done nearly $20b in all-time fees
2. 97.5% has come from the L1 ($479m from the top L2s)
3. Solana has produced $495m in all-time fees, with 87% of that coming this year.
4. The trend is the friend of Solana, which has produced 41% of Ethereum's top-line network fees over the last 90 days (not including MEV)
5. Why am I including L2s? Because they create demand for ETH + settle transactions down to the L1. We'll stop including them if those two economic ties are severed.
2/7
Sep 6 • 7 tweets • 3 min read
. @Uniswap did 81% of @coinbase trading volume in Q2.
It did 65% of @RobinhoodApp's volume.
Meanwhile, Uniswap has just 3% of Coinbase's workforce and 4% of Robinhoods.
A 🧵on @Uniswap's market share within crypto across 6 different KPIs using @tokenterminal new dashboard feature.
___
Starting with Fees - Uniswap currently controls a 55% market share. Notably, the protocol generated $45m for Uniswap Labs via it's interface fee over the last 6 months.
That's 9% of what was paid to Uniswap LPs ($503m) over the same period.
*please note all data excludes Solana DEXs (coming soon)
1/7
In terms of active users, @Uniswap currently has a 60% market share — twice as high as one year ago.
Uniswap had over 9 million active users in August. For reference, Coinbase has 8 million monthly active users. Robinhood has 13.7m.
Data: @tokenterminal
2/7
Jul 25 • 8 tweets • 4 min read
1/8 A quick 🧵on stablecoin activity on @ethereum & L2s
Starting with all-time transfer volume:
@circle the clear leader with over $10t of all-time volume on the L1. USDC volume was up 14% on the qtr and 37% on the year.
USDT saw zero growth in Q2 and was up 37% on the year.
DAI was the big winner in Q2 in terms of volume -- with 39% market share and $843b of value transferred.
Data: @artemis__xyz2/8 Shifting to volume on L2s:
@circle dominating all time volume on L2s as well with 3.8x the volume of USDT.
USDC volumes were up 41% in Q1 and 127% on the year.
USDT saw 12% growth in Q2 and 74% for the year at the L2 level.
*DAI volume was down 30% on the qtr and 25% on the year on L2s.
Data: @artemis__xyz
Jul 17 • 16 tweets • 5 min read
Every quarter I spend a few days combing through onchain data to compile Ethereum's financial performance so that you don't have to.
A 🧵on the L2 sector performance in Q2:
Active users: L2s now have 6x that of the L1 (up from 3x last qtr)
Data: @tokenterminal
Active addresses/users on L2 only:
@arbitrum averaging more than Ethereum now.
@base in the number 2 spot.
Data: @tokenterminal
Apr 18 • 12 tweets • 4 min read
Every qtr I spend a week writing The Ethereum Investment Framework while combing through hundreds of KPIs throughout the Ethereum Ecosystem.
10 insights from the Q1 update which was published yesterday.
Shout out to @artemis__xyz for supplying the data.
A 🧵
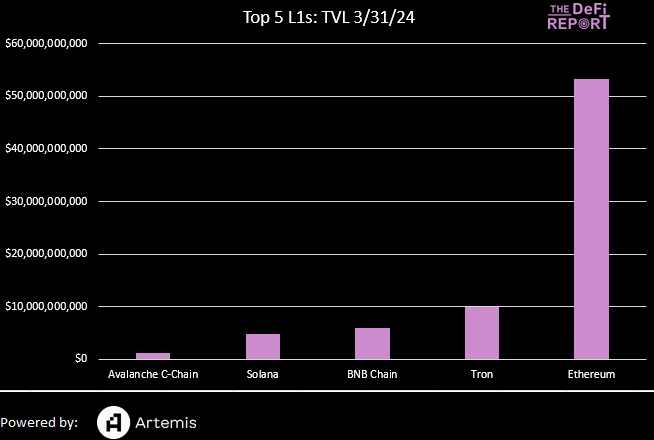
Newer blockchains may be stealing some mind share from Ethereum, but in terms of where the value still sits, the King still rules:
- 5x higher TVL than the second-largest L1
- 10x higher TVL than #3