Nick Gerli Profile picture
Jul 24 6 tweets 3 min read Read on X
Home builders now have 102,000 completed, unsold homes sitting on their builder lots.

This is the highest level since 2009.

Indicating a huge ramp up in supply that is likely to get worse in the second half of 2024 as buyer demand remains subdued.

Watch the builders. They are flashing lots of warnings right now about economy/housing market.Image
1) We know that this builder unsold supply will increase because the amount of homes they have UNDER CONSTRUCTION is still near the highest level in decades.

These under construction for sale homes are going to continue to convert to completed ones over the next 6-12 months. Image
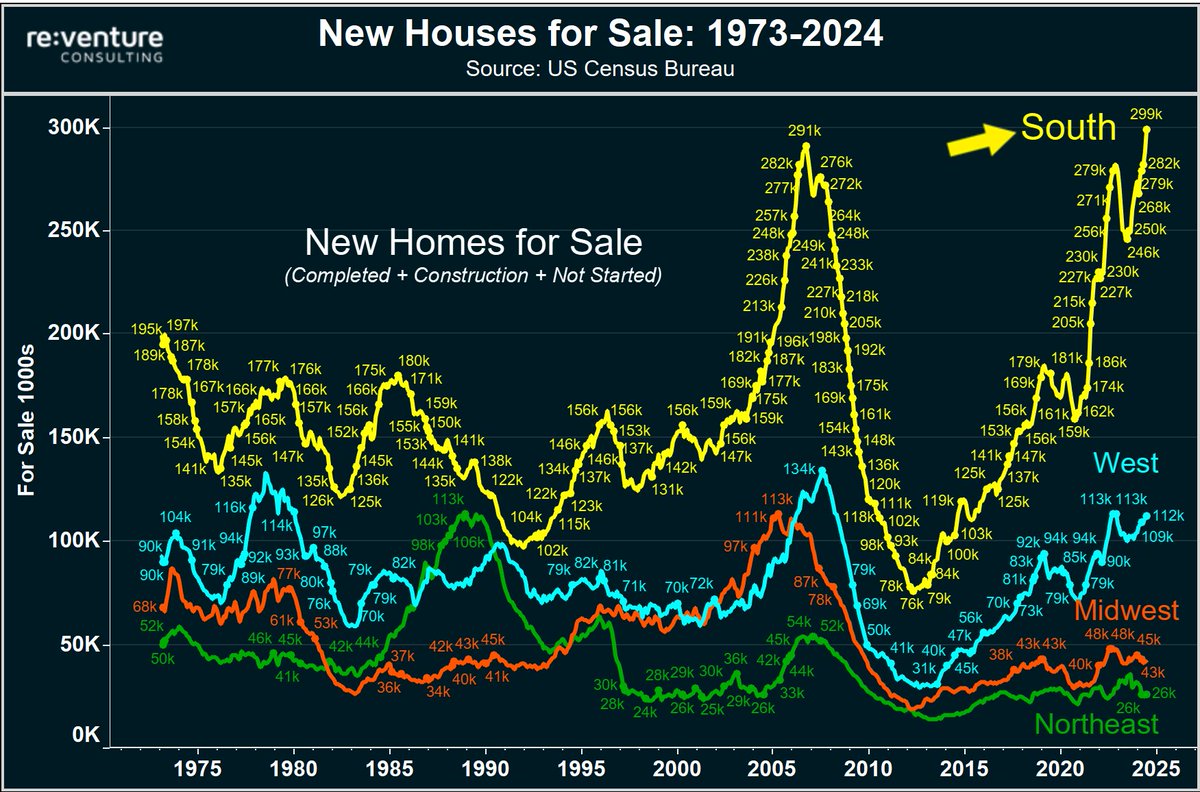
2) And these homes for sale are disproportionately located in the South.

South - 299,000
West - 112,000
Midwest - 43,000
Northeast - 26,000

Nearly 65% of the entire builder inventory is located in the South. Mostly in Florida/Texas/Tennessee/Georgia/South Carolina. Image
3) Southern housing markets are facing a big risk of home prices declines in the second half of 2024, and into 2025.

Particularly in Florida/Texas, where the bubble might already be popping.
4) Check out the housing inventory in Florida right now. This is all active listings.

We spiked from a low of 47,000 in 2021, all the way up to 140,000 today.

That's the highest level going back to 2017.

Access the inventory data here: map.reventure.app/dashboard?geo=…
Image
5) Check out Texas.

Housing inventory is up to over 108,000 in the lone star state.

That's the highest level since 2017. Indicating downward price pressure.

Access inventory data here: map.reventure.app/dashboard?geo=…
Image

• • •

Missing some Tweet in this thread? You can try to force a refresh
 

Keep Current with Nick Gerli

Nick Gerli Profile picture

Stay in touch and get notified when new unrolls are available from this author!

Read all threads

This Thread may be Removed Anytime!

PDF

Twitter may remove this content at anytime! Save it as PDF for later use!

Try unrolling a thread yourself!

how to unroll video
  1. Follow @ThreadReaderApp to mention us!

  2. From a Twitter thread mention us with a keyword "unroll"
@threadreaderapp unroll

Practice here first or read more on our help page!

More from @nickgerli1

Jul 25
New homes for sale by region in America.

Clear where the housing bubble is: the South.

65% of all builder homes for sale are in the South, with a huge swath located in Texas/Florida.

This isn't exactly like the mid-2000s bubble. But in the South the similarities are becoming more and more striking.Image
1) Meanwhile - builder inventory in Northeast/Midwest is lagging far behind the previous mid-2000s peak.

Here's the comparison between regions in homes for sale v 2006.

South: +1% higher than 2006 bubble
West: -18% lower
Midwest: -62% lower
Northeast: -51% lower
2) This is a reality that is also becoming apparent on the re-sale market.

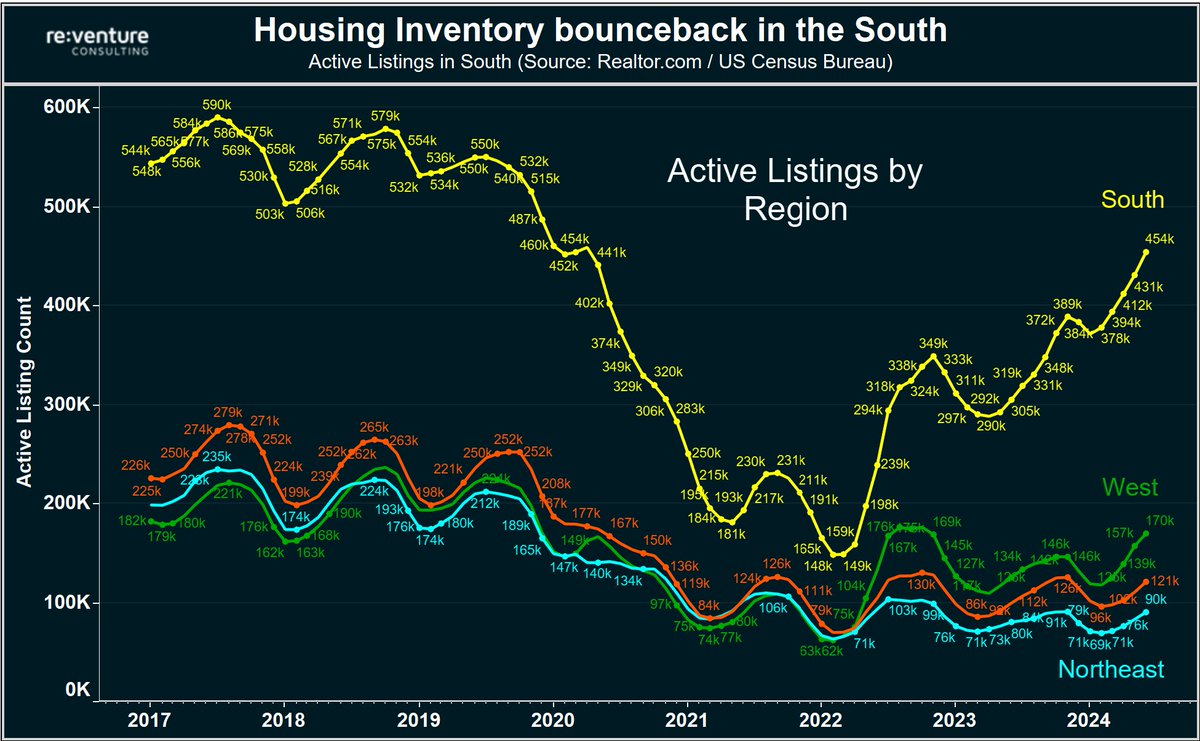
With active listings in South nearly back to pre-pandemic levels.

While the other regions are still trailing behind.

The northeast in particular is in the basement. Image
Read 8 tweets
Jul 23
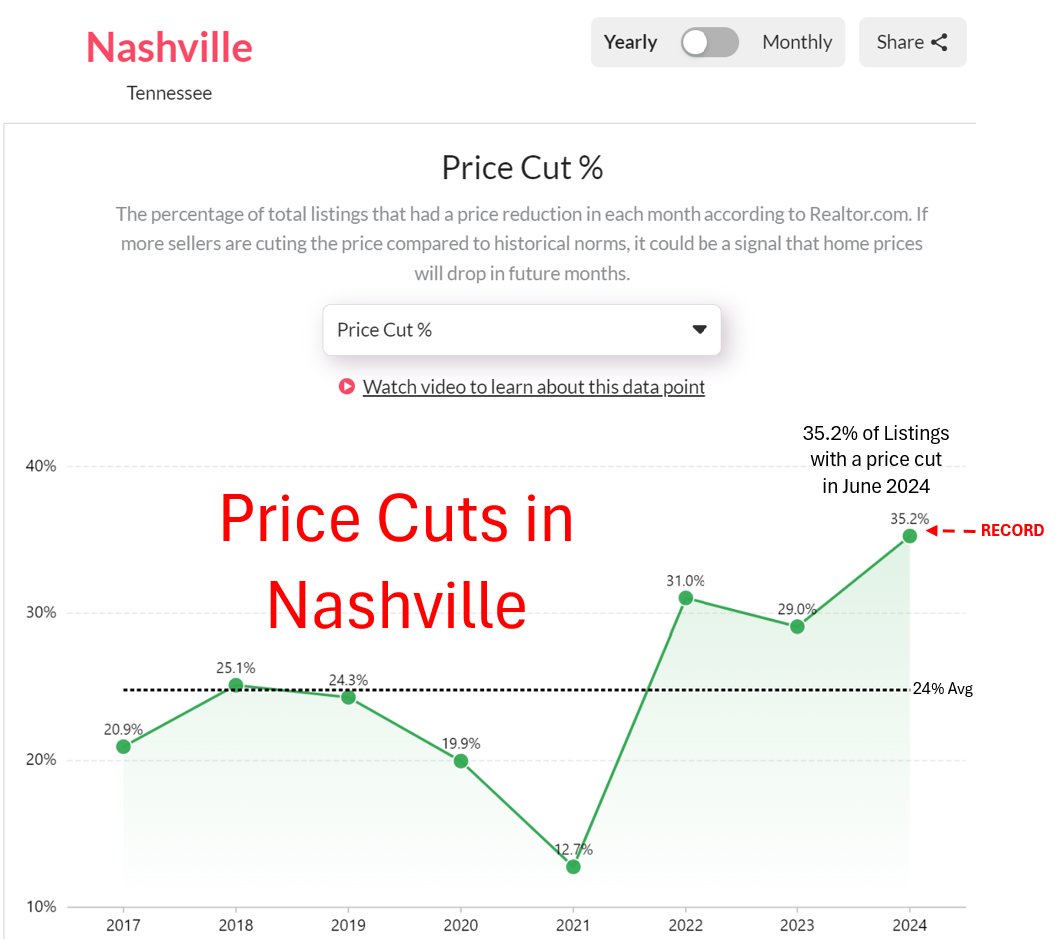
Nashville just set a record for price cuts.

With 35.2% of sellers cutting the price in June 2024.

That's the highest level for June going back 7 years. And well above the long-term average of 24%.

Suggesting that Nashville's housing market has entered a downturn.

Don't be surprised if prices drop there in H2 2024.Image
1) The price cut rate is one of the most important metrics you can look at as a homebuyer or real estate investor.

It tells you the percentage of sellers reducing the price in a given month.

And when 1,000s of sellers across an entire market begin to reduce the price - it's generally a leading indicator that aggregate price levels will drop in the next 6 months.
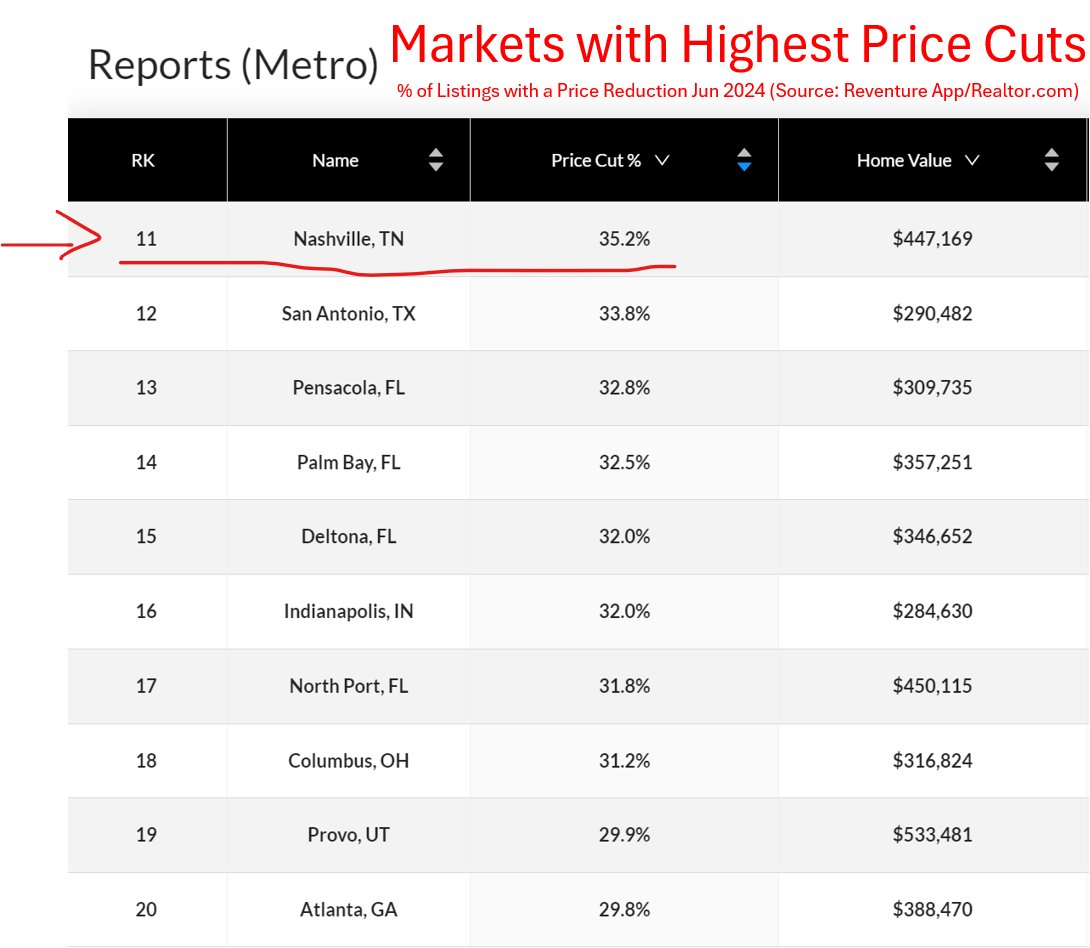
2) Nashville ranks as the #11 metro with the most price cuts as of June 2024.

You can access the rest of the top 10 list on Reventure App under a premium plan.

Go to Price Cut %, and then hit table view. reventure.app
Image
Read 9 tweets
Jul 22
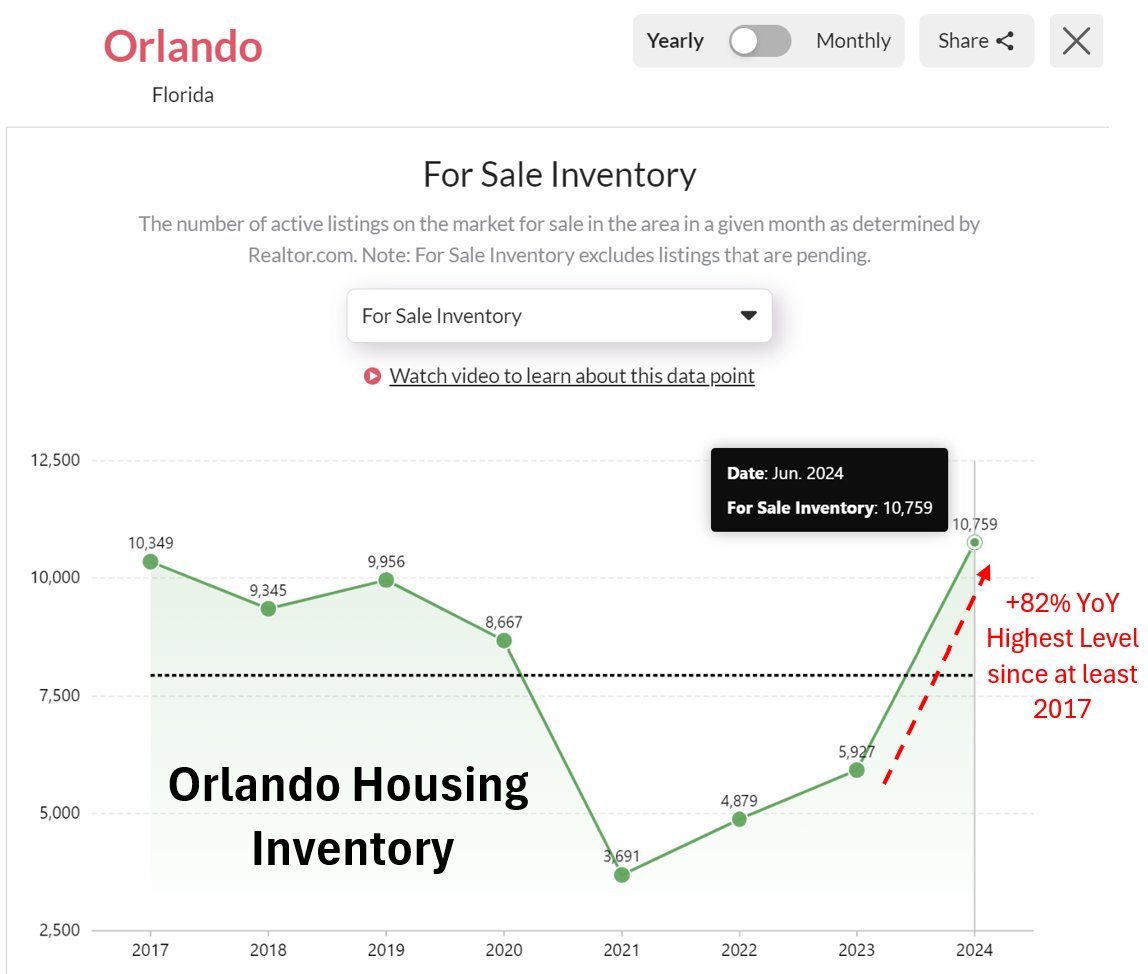
Housing inventory in Orlando is now spiking like it's 2007.

With active listings skyrocketing 82% over the last year. To 10,759 homes on the market.

That's the highest level of supply since at least 2017.

Suggesting: home prices will be going down in Orlando. And potentially by a lot.

Access the inventory data for yourself here: map.reventure.app/dashboard?geo=…Image
1) This Florida housing downturn keeps getting more intense by the day. With a combination of investors, builders, and inflation-burdened homeowners off-loading houses at a historically fast clip.

This increase in listings is now corresponding with a slowdown in demand, which is pushing inventory levels through the roof.
2) The more that inventory climbs, the greater the likelihood that prices fall.

Especially given the heavily overvalued home prices across Florida today.

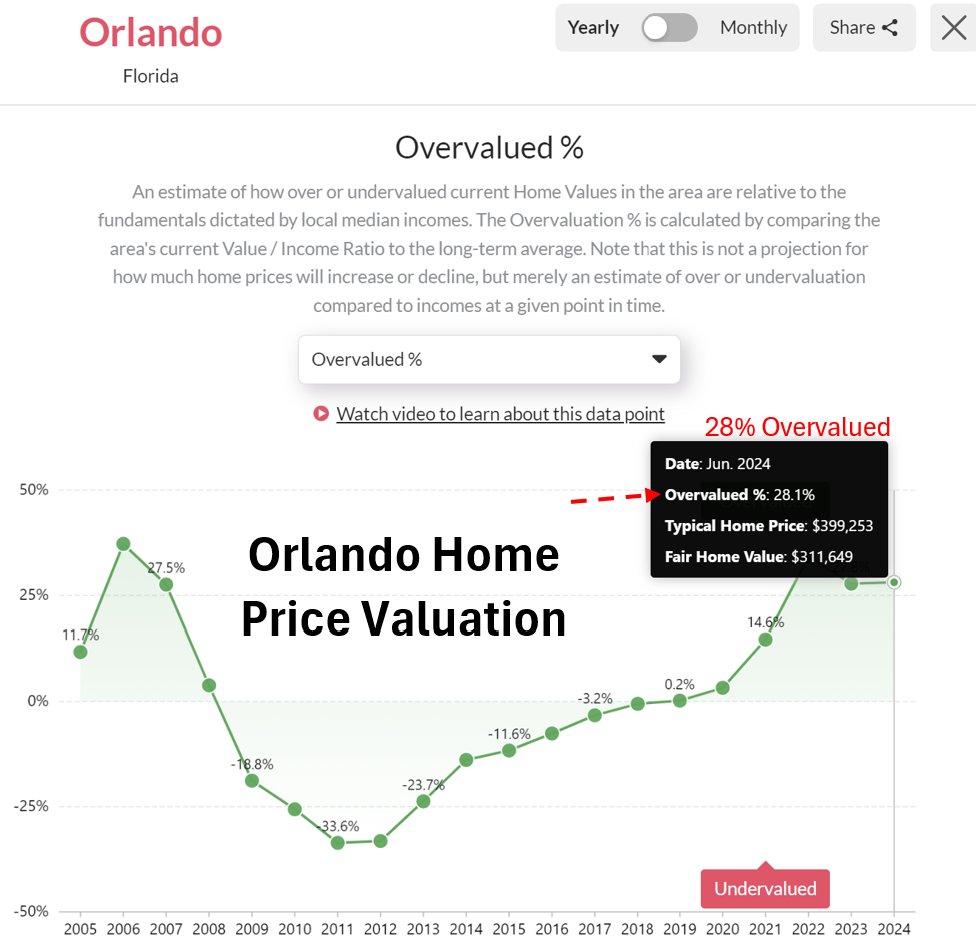
For instance - home values in Orlando are currently 28% overvalued compared to their long-term norms acc to data on Reventure App.

That's a similar level of overvaluation to the previous peak in mid-2000s.

Suggesting: price downside.Image
Read 9 tweets
Jul 19
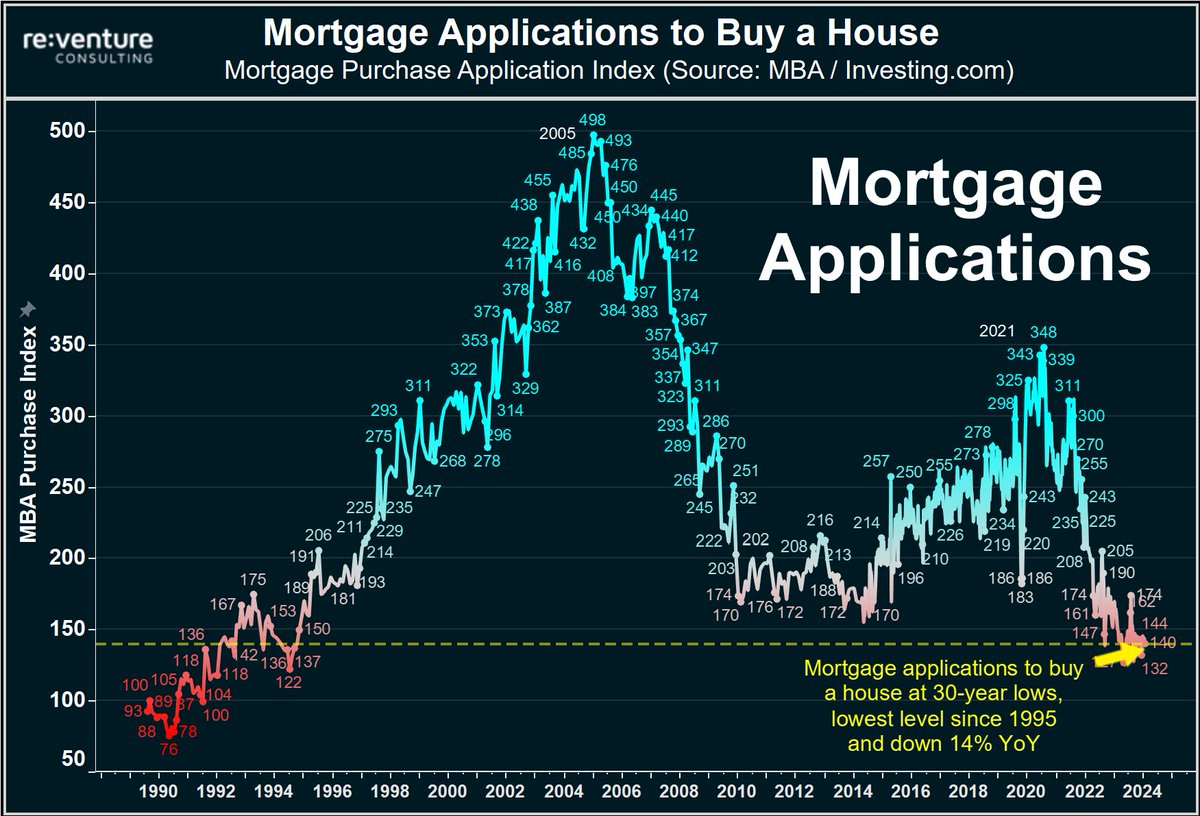
Mortgage applications to buy a house remain at their lowest level since 1995.

Down 14% from last year's already low levels.

Homebuyers remain on strike, even with mortgage rates declining over the last two months.

Will be very interesting to see what happens in September when Fed cuts.

Thus far - buyers are indicating they need to see a lot more than 50bps reductions in mortgage rates to come back into market.Image
1) The reality that many housing analysts miss is that homebuyers don't really care about mortgage rates.

Rather - most prospective buyers look on Zillow at a house that costs $500k. And they think "no way is that house worth more than $400k".

And they stop looking.

So incremental drops in mortgage rates aren't moving the needle much for affordability-constrained house hunters.
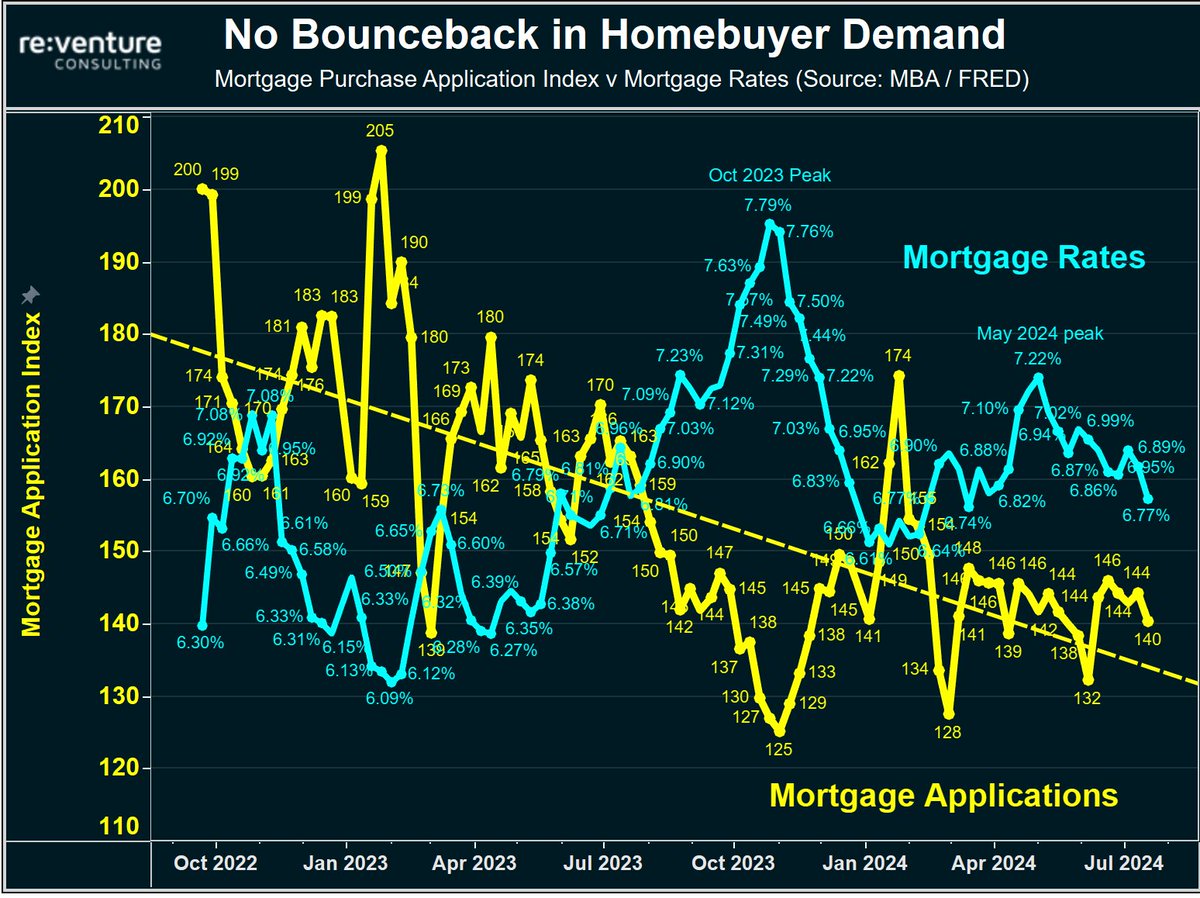
2) You can see this homebuyer indifference to mortgage rates exhibited in the graph below.

Where rates have declined from 7.8% in Oct 2023. To 7.2% in May 2024. To 6.7% today.

With no resulting increase in buyer demand.

Rather - mortgage applications are still exhibiting a downward trend over last two years.Image
Read 10 tweets
Jul 17
Price cuts are getting ugly in certain housing markets.

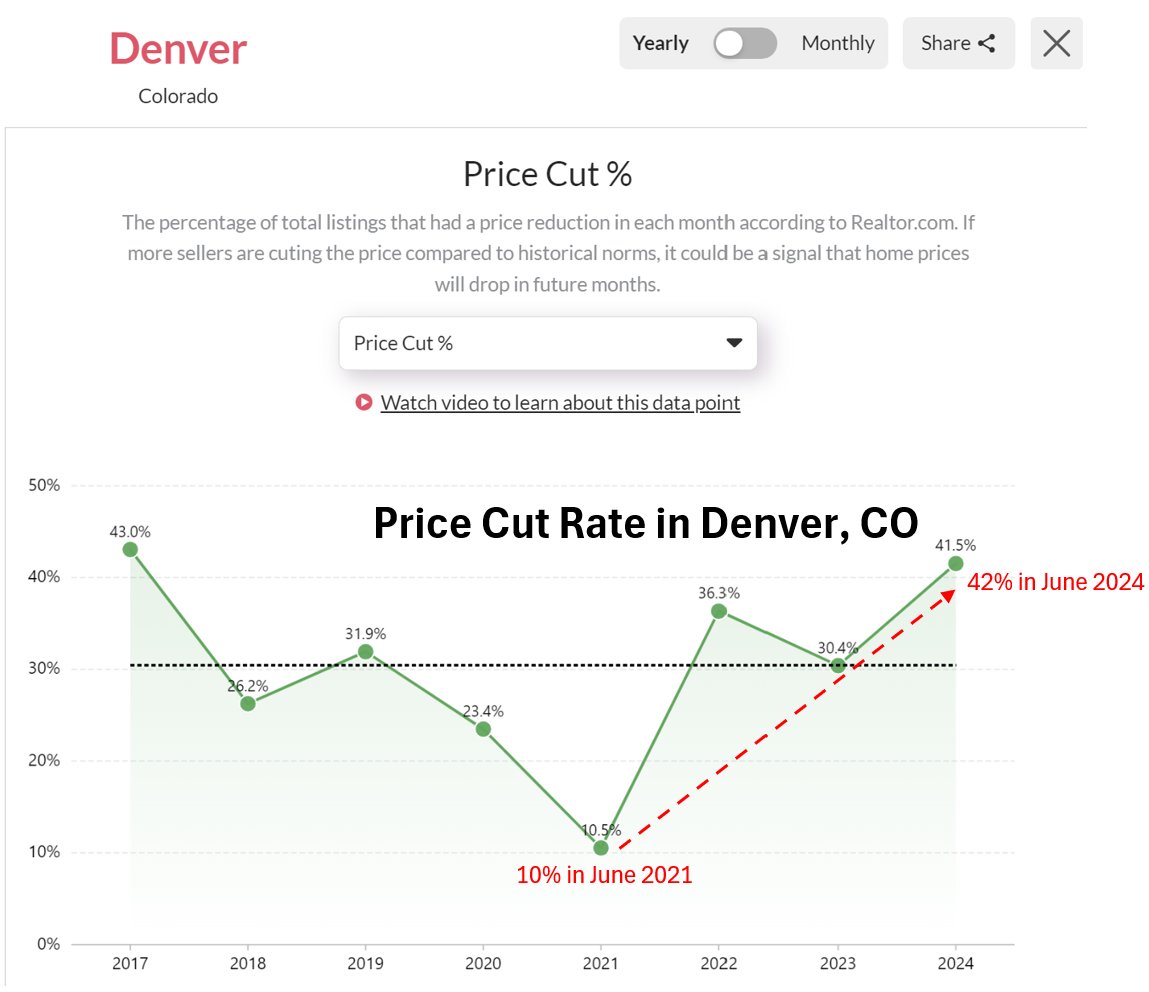
Take Denver. Where the price cut rate just hit 42% of all listings in June 2024.

That's the 2nd highest price cut rate on record. And indicates that nearly half of sellers are feeling pressure to reduce the price.

A clear indication of a declining market. Expect prices in Denver to drop in H2 2024.

Head to to track the price cut rate in your city and ZIP code.reventure.appImage
1) Price cuts are one of the most useful indicators of the direction of a housing market.

The more that sellers are cutting list prices, the more likely the market is to decline into the future.

Price Cut % is data point available on Reventure App that takes the number of listings with a price cut in a given month and divides it by total listings.
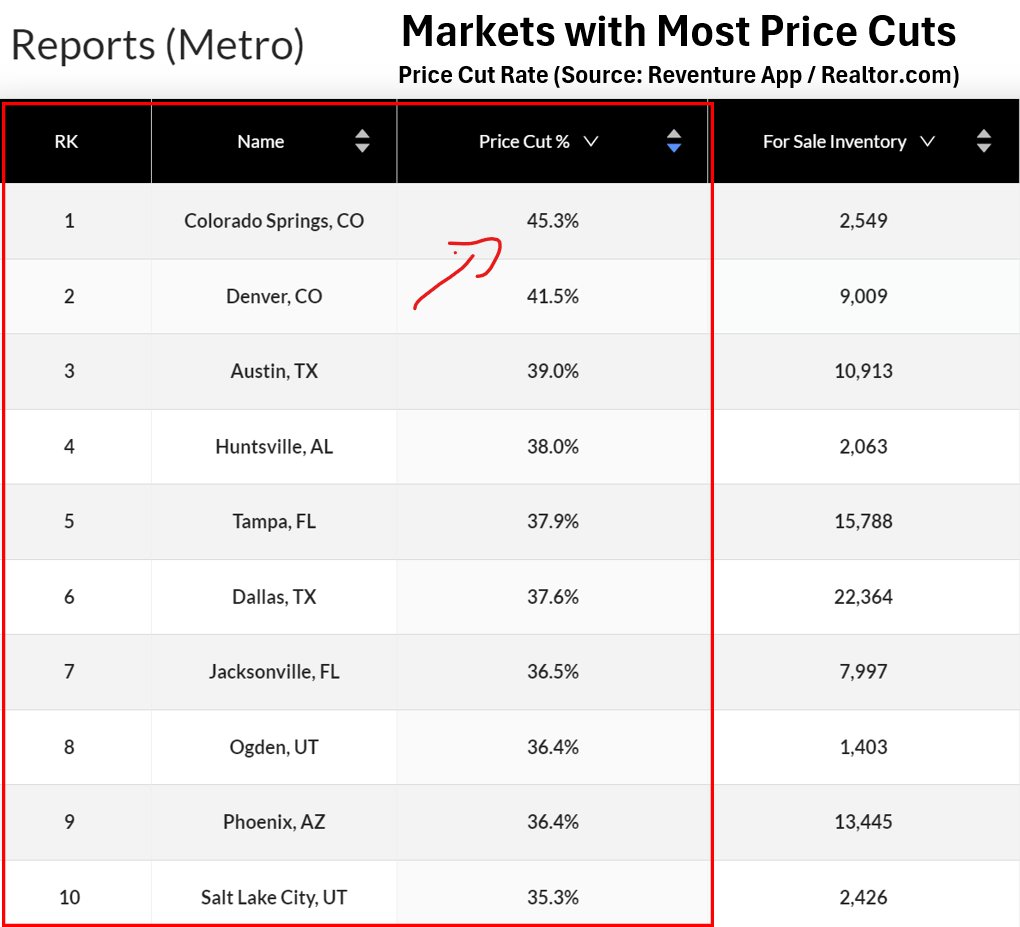
2) You can see the top 10 market with the most price cuts as of June 2024. This data is sourced from .

Colorado Springs comes in at #1 with 45% price cut rate. Indicating heavy downward price pressure.

Other markets with lots of price cuts include Denver, Austin, Huntsville, Tampa, Dallas, Jacksonville.

Basically - pandemic boomtowns.Realtor.comImage
Read 6 tweets
Jul 16
Another market that is getting slammed with inventory: San Antonio, TX.

This is a more affordable market that benefited from Austin getting really expensive. Lots of people moved down to San Antonio.

However, the dynamics are now shifting. With 11,370 homes on the market in June 2024.

That's 53% more inventory than the long-run average for June. Indicating a glut of listings.Image
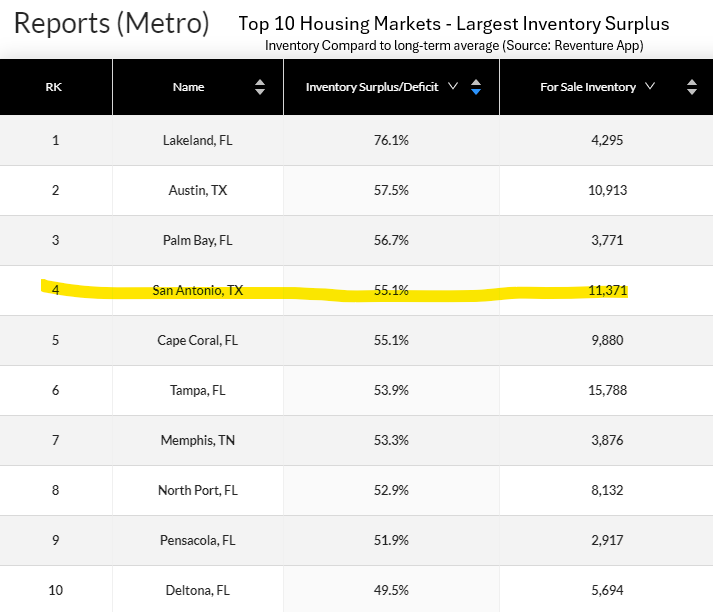
1) San Antonio ranks as having the 4th largest inventory surplus in America right now.

Behind Lakeland, Austin, and Palm Bay.

You can see - the markets with the biggest glut of listings are almost universally concentrated in Florida and Texas. Image
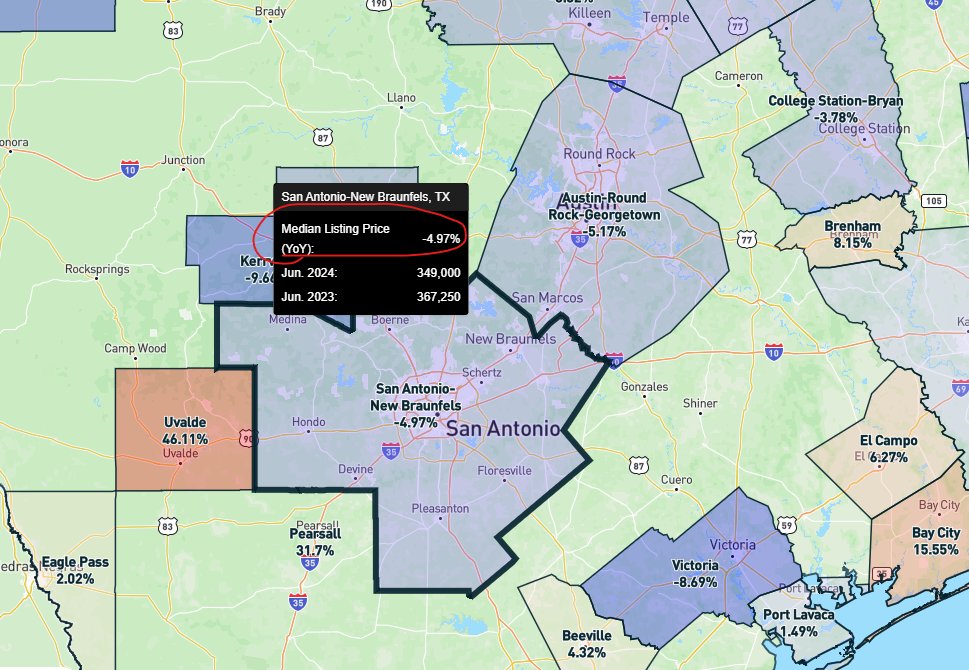
2) As a result of rising inventory, list prices and home values in San Antonio are now on the decline.

Zillow Home Value Index down -2% YoY.

Median List Price down -5% YoY.

Prices will likely continue to drop in H2 2024 given the sky-high inventory and price cut levels in the market.Image
Read 4 tweets

Did Thread Reader help you today?

Support us! We are indie developers!


This site is made by just two indie developers on a laptop doing marketing, support and development! Read more about the story.

Become a Premium Member ($3/month or $30/year) and get exclusive features!

Become Premium

Don't want to be a Premium member but still want to support us?

Make a small donation by buying us coffee ($5) or help with server cost ($10)

Donate via Paypal

Or Donate anonymously using crypto!

Ethereum

0xfe58350B80634f60Fa6Dc149a72b4DFbc17D341E copy

Bitcoin

3ATGMxNzCUFzxpMCHL5sWSt4DVtS8UqXpi copy

Thank you for your support!

Follow Us!

:(