30-1/ COVID update for epidemiological weeks 29-30 of 2024.
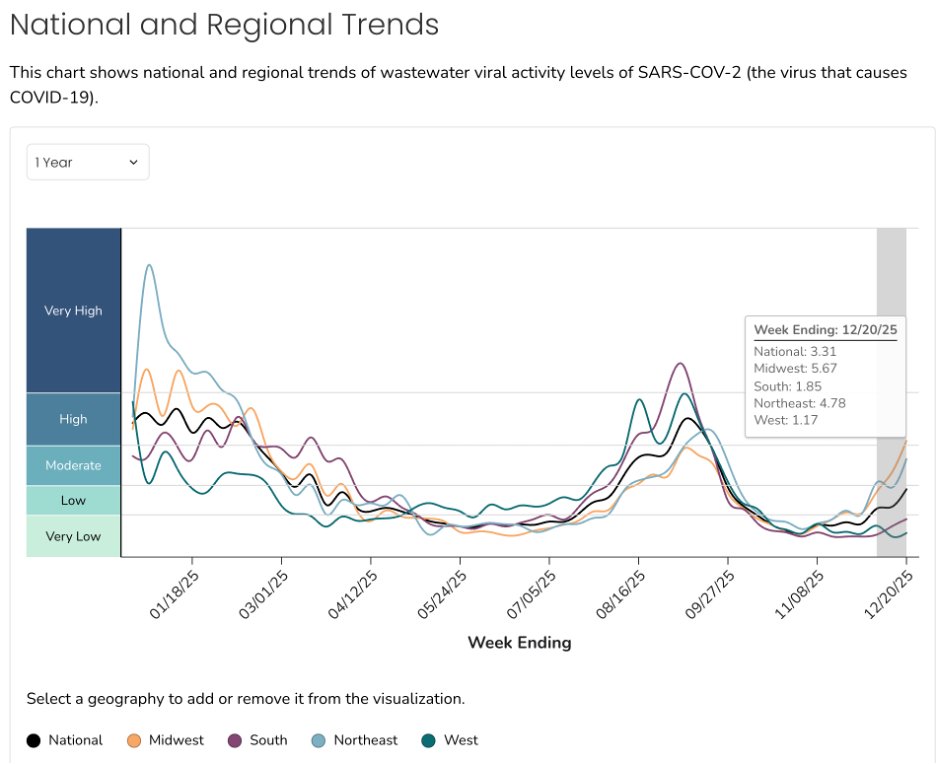
COVID wastewater numbers are still rising at a steady rate. CDC's wastewater chart shows more significant rise than Biobot, but (as I said before) I don't really trust the CDC's methodology and lack of transparency.
COVID wastewater numbers are still rising at a steady rate. CDC's wastewater chart shows more significant rise than Biobot, but (as I said before) I don't really trust the CDC's methodology and lack of transparency.

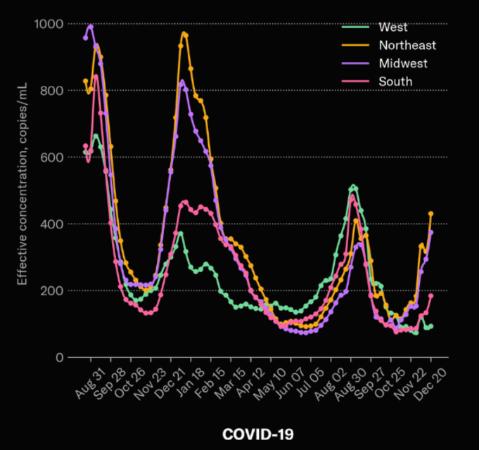
30-2/ The current wave is manifesting itself unevenly across different sewersheds. For instance, San Jose shows the current wave as big as the last one, but 40 miles up the road, Oakland doesn't show much of wave at all...


30-3/ NYC (Manhattan) has seen a strong surge in the past 4 weeks. While up in Boston, things may have peaked.


30-4/ While the US's summer wave was ramping up, Australia was having its winter wave. AUS has been slow to update its national stats, but the New South Wales data (NSW is the most populous state in AUS) shows that their wave is over. And it was largely a KP.3x wave.

30-5/ KP.3 descendants are the most common, but KP.3x is not the sole driver of the US wave. @RajlabN's NYITCOM report shows other vars are still common. CDC suggests that KP.3.1.1 will be the big grower this week, but Cov-Spectrum suggests its rate of growth is tapering off


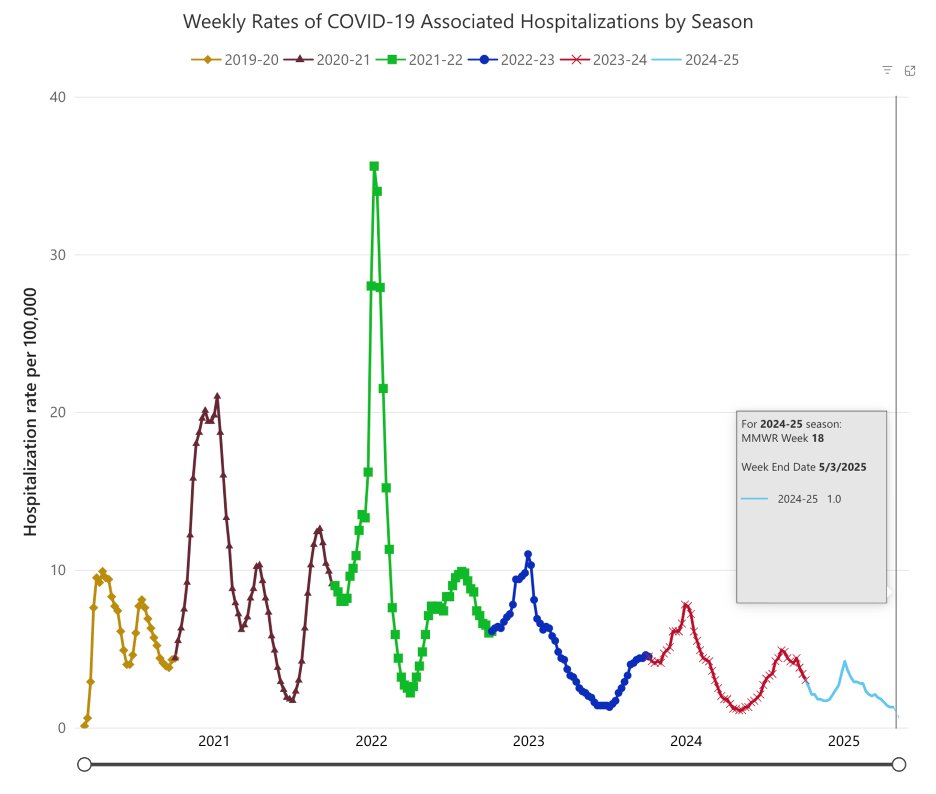
@RajlabN 30-6/ COVID hospitalizations remain low—and they've stayed lower for the first half of this year than any previous years. That could change of course but for some unexplained reason the CDC is predicting that hospitalizations will drop this month (I think they'll rise a bit).


@RajlabN 30-7/ Deaths remain low. Of course, death certificates are trickling in from previous weeks, but it looks like between 300-400 people are dying from COVID each week. That mortality rate is roughly 1 in a million per week.

@RajlabN 30-8/ 1st half 2024 ~15K people died from COVID. I predict that its death toll will be <30K this year. This will be well within the 25-70K estimated deaths due to flu last flu season (per the CDC). That would put COVID around 12th place among common natural causes of death.
@RajlabN 30-9/ Unlike other respiratory diseases, SARS2 never drops to undetectable levels in wastewater—which indicates that it never really stops circulating. I don't expect it will become a seasonal virus anytime soon.

@RajlabN 30-10/ Although we've built up a pretty good firewall of population immunity against this virus, your individual response to reinfection may vary. Dr Daniel Griffin on TWiV 1134 presented this chart (a National Covid Cohort Collaborative study from electronic health records)...

@RajlabN 30-11/ ...one's chances of dying from subsequent infections depends on the severity of initial infection. TWIV didn't provide link to this study, but it suggests to me that certain people are physiologically more susceptible to SARS2.
tinyurl.com/nx593u4p
tinyurl.com/nx593u4p
30-12/ Based on UK ONS data @Jean__Fisch estimates the risk of developing Long COVID at the end 2023 was overall ~1.5%, with severe symptoms at ~0.3%.
https://x.com/Jean__Fisch/status/1816829321840882067

@Jean__Fisch 30-13/ We're into 3Q now, and the Long COVID mass disabling event still hasn't happened (though SSA disability claims are still tracking up a bit). And excess deaths remain in pre-COVID ranges (h/t to @Truth_in_Number).


@Jean__Fisch @Truth_in_Number 30-14/ And here's an interesting study that conclusively shows that SARS2 does not interact with the T cell receptors nor directly activates T cells—so AJ's claims about T cell exhaustion are bunk. (h/t @ejustin46 who has the links to the coolest papers.)
pnas.org/doi/10.1073/pn…
pnas.org/doi/10.1073/pn…
@Jean__Fisch @Truth_in_Number @ejustin46 30-15/ In scarier news, the Congo's Clade 1 MPox outbreak has spread. South Africa reports cases and deaths. Remember: Clade 1 MPox is deadlier than Clade 2 from 2 years ago—and it doesn't require sexual contact to spread. CDC says no cases in the US—yet. tinyurl.com/3v2yhxw9
@Jean__Fisch @Truth_in_Number @ejustin46 30-16/ That's all for this update. But anecdatally, more friends of mine have caught COVID in the past month than during any previous wave—maybe because my cohort isn't taking precautions any longer. All the cases have been mild, though (knock on wood).
@threadreaderapp unroll
• • •
Missing some Tweet in this thread? You can try to
force a refresh