
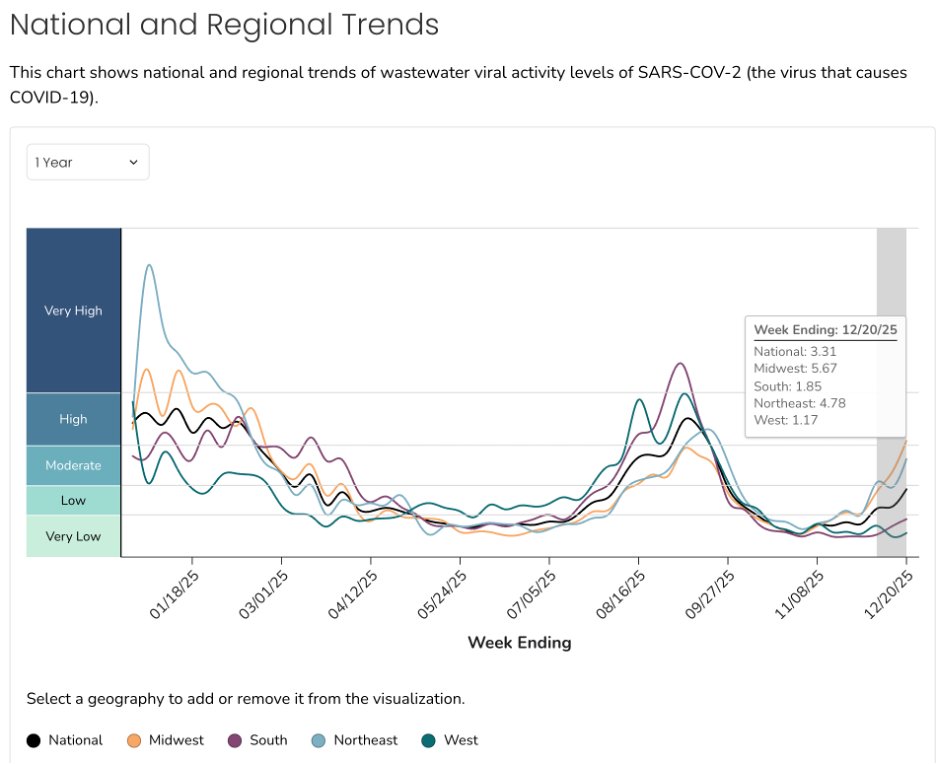
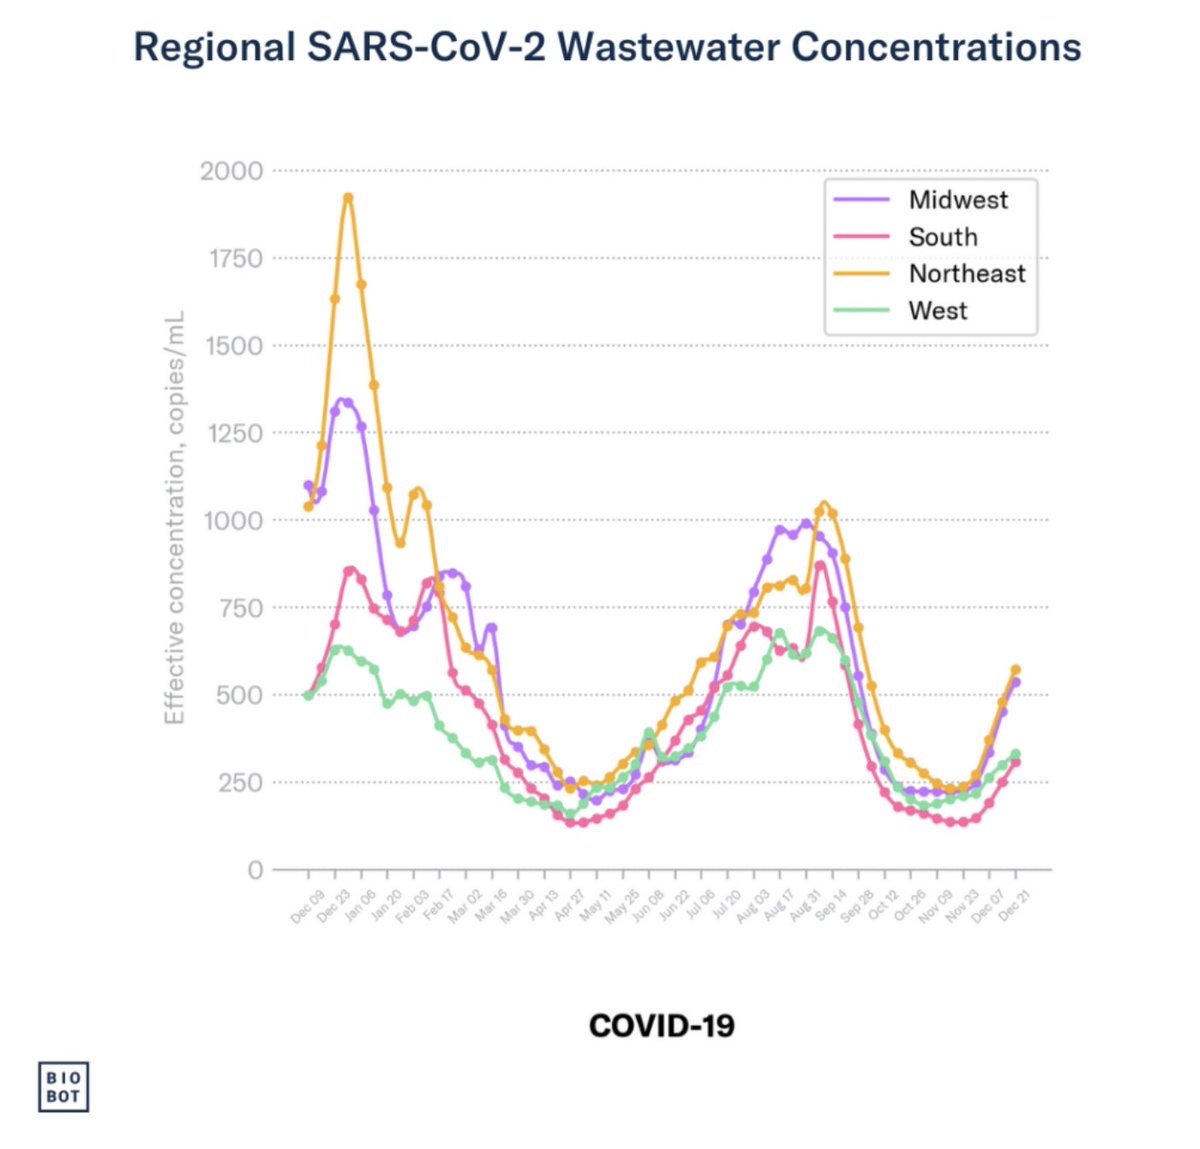
 EoY25-2/ The uneven start of this winter wave is interesting. Strong upsurge wastewater numbers in the Midwest and East. Not so much in the South, and WW levels in the West are still below the previous interwave gap—maybe due to higher levels during that interwave gap?...
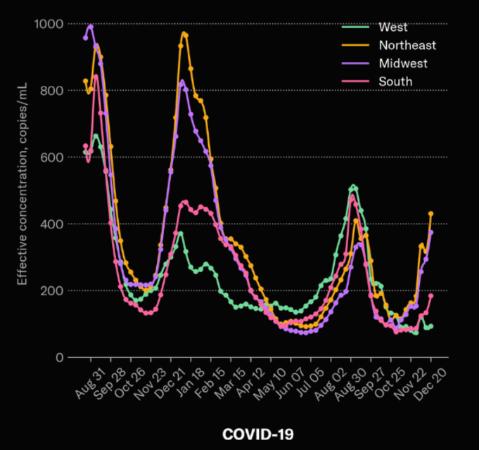

 38-2/ Notice that the CDC's NWSS data shows the current wave is nearly as high as our 2024-25 winter wave. I suspect that's because they're normalizing their data against the previous year's numbers. OTOH, ED visits are higher for this wave than the previous one...
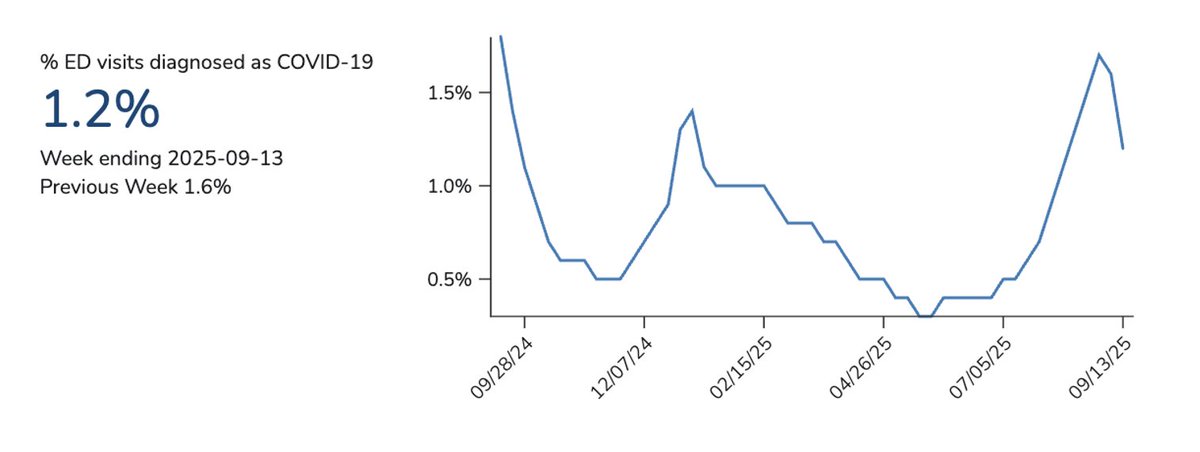


 16-2/ If patterns hold, SARS2 should maintain this low level of circulation for a few weeks before climbing again in an upward curve. Though previous summer peaks have been late Aug/early Sept, I wouldn't be surprised to see the next wave peak in July or early Aug. We'll see.
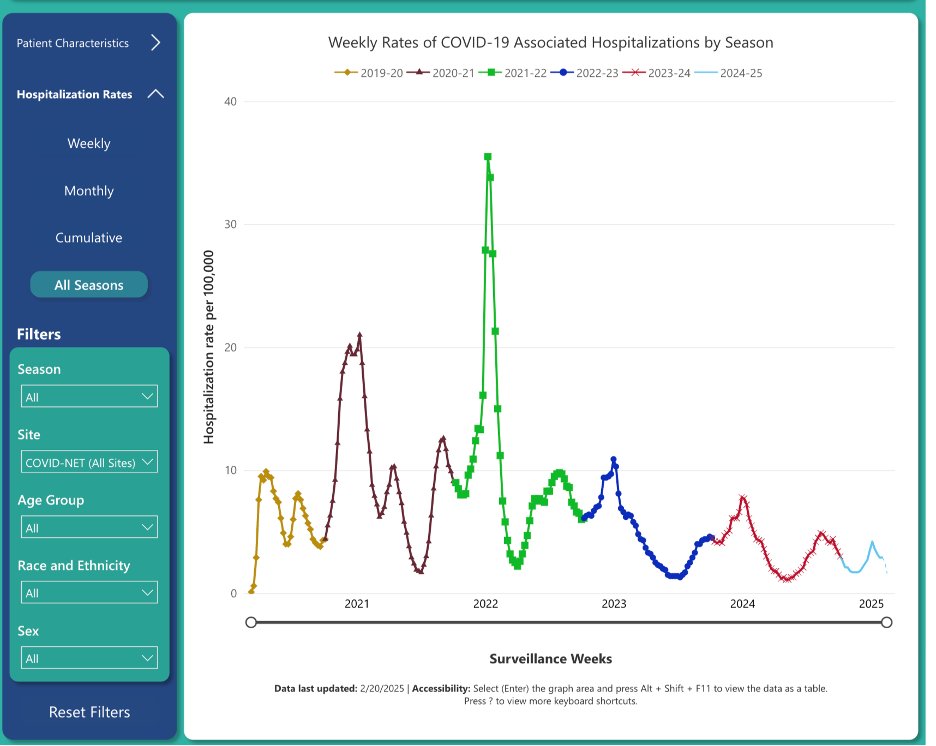
 14-2/ COVID hospitalizations, ED visits, and deaths all tracking downward as of two weeks ago.

 12-2/ The CDC's ww numbers indicate a long tail for this wave, but it shows the West and NE back to interwave levels. These numbers are all normalized to the previous year's numbers, so I don't know if this long tail may be an artifact of the way they normalize. I trust Biobot.
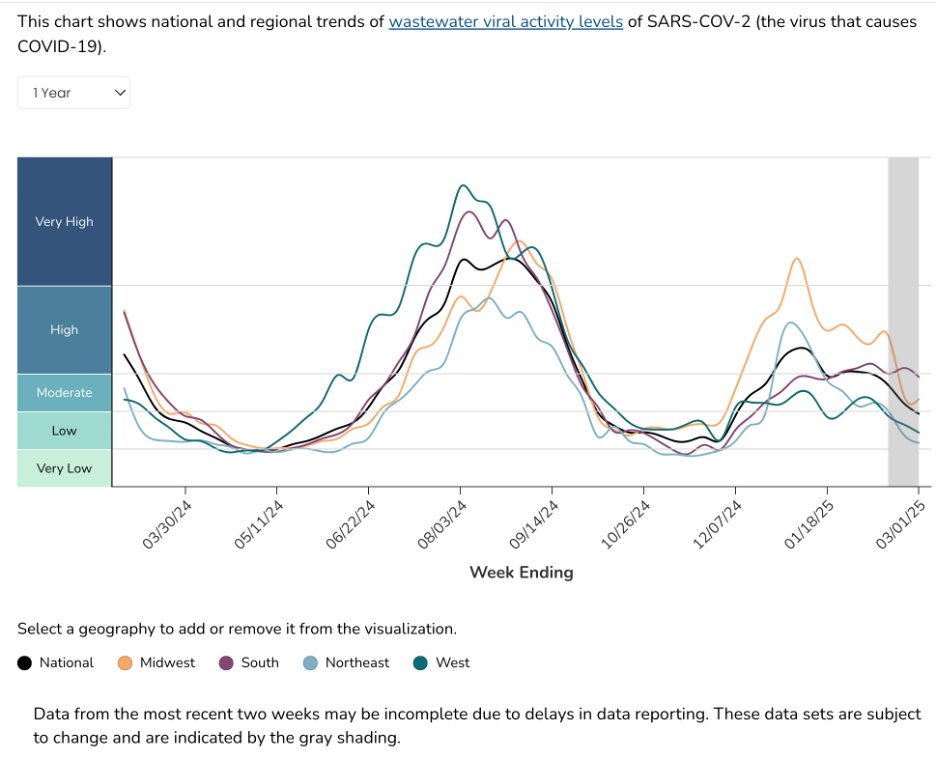

 8-2/ The CDC's wastewater survey shows SARS2 numbers are trending downward in all regions except the Midwest. Note: The CDC normalizes these against the previous year, so they don't give us absolute concentrations. Biobot does, but they haven't published an update in past 2 wks.
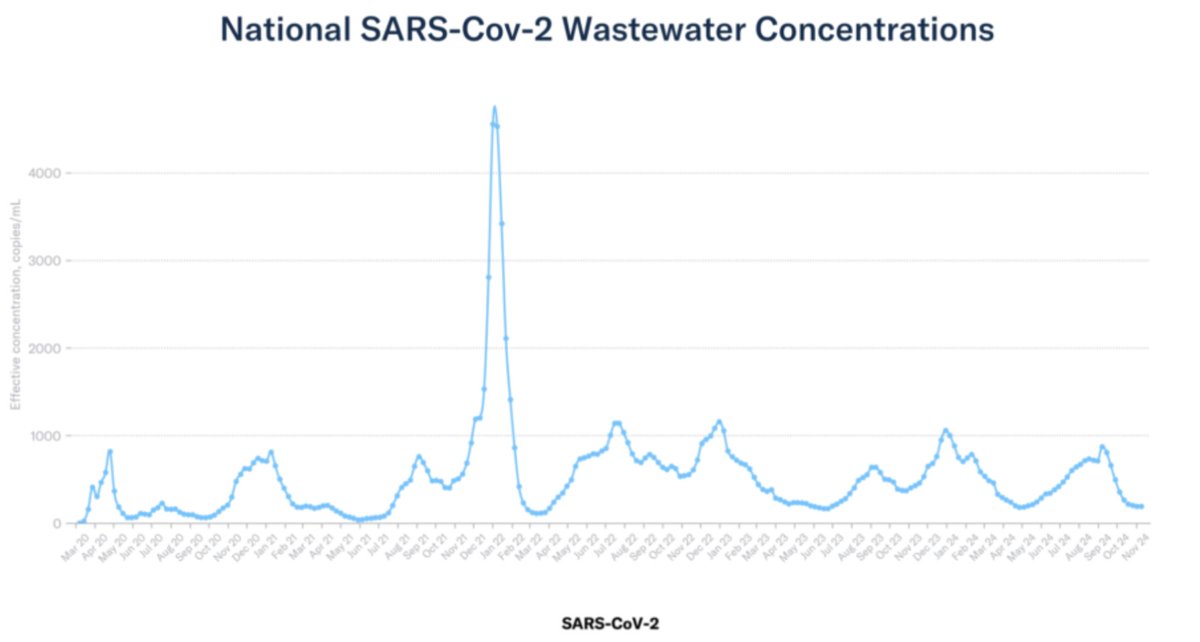
 6-2/ As US COVID waves go, wastewater numbers indicate this has been on the low side, but we don't really know if the viral shedding of JN.1 and its descendants has remained consistent with previous variants.
 4-2/ Other CDC data pages seem to be up and running, though. Their wastewater numbers seem to indicate the current XEC COVID wave has peaked. Biobot hasn't published an update recently, so I don't have a reality check for CDC's data.

 2-2/ CDC's ww graph shows a higher rise in the Midwest and less so in the South. Of course, the CDC normalizes its numbers against the previous year, so these are relative numbers—not avg SARS2/PMMoV concentrations in CpmL units. Biobot methodology seems more straightforward.
 52-2/ Of the big 3 respiratory viruses (per CDC), COVID still trails RSV and influenza in test positivity, but has now passed RSV in the number of ED visits.


 50-2/ The folks at Biobot haven't posted an update for two weeks, so I don't have any good aggregate wastewater numbers for the US (b/c the CDC doesn't publish nat'l data in CpmL units). So, let's zoom in on what's happening in some big city sewersheds. NY State first...


 44-2/ I'll point out again: COVID interwave ww concentrations are order of magnitude higher than flu and RSV ww concentrations (peak Flu A is that little red X under COVID)—perhaps due to differences in their viral shedding? But SARS2 is always circulating relatively high levels.

 42-2/ COVID ED visits are following the downward wastewater trend. Although there may be delays in tabulation, weekly deaths (per 100k) may clock in at the lowest any time since the start of the pandemic. Hospitalizations dropping, too.


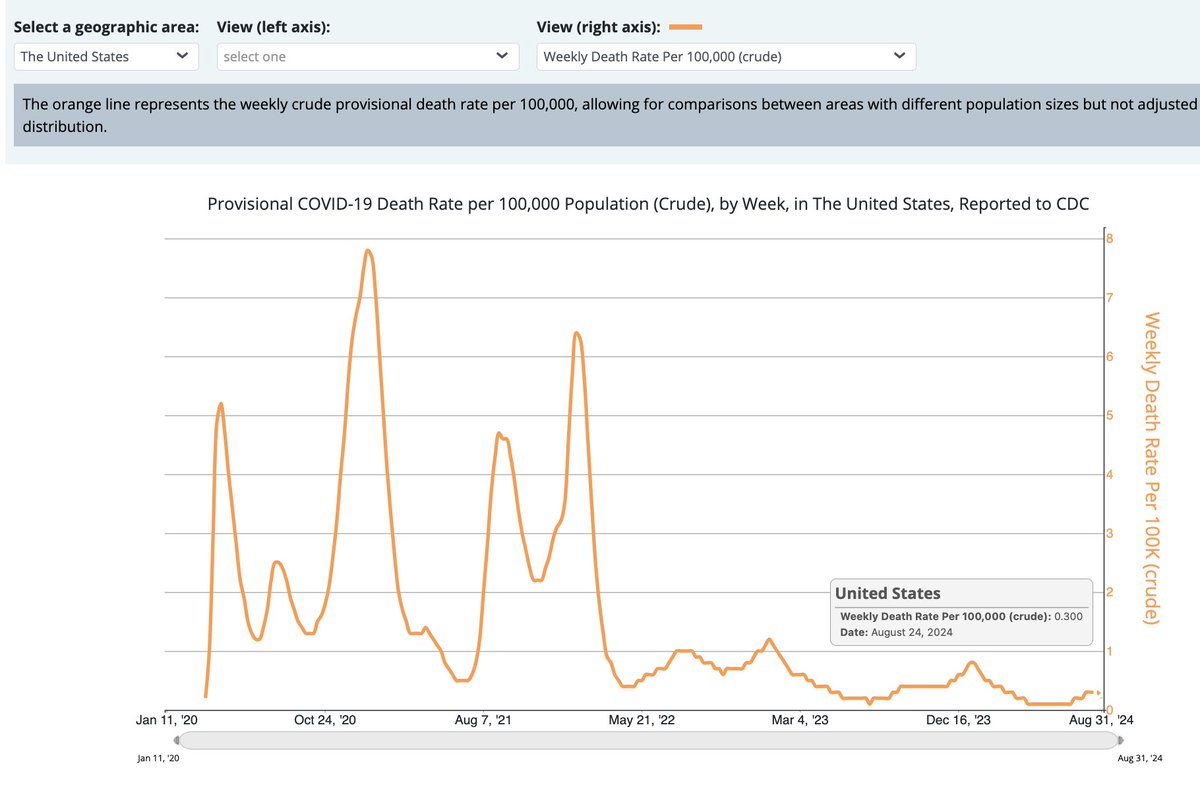
 36-2/ ED visits seem to have peaked as well—although the 5-17 age cohort is lagging other age groups—probably due to the opening of schools across the US. But crude death rate rose to .3/100K the 3rd week of August. They may be dropping now (or not yet).
 34-2/ O/c, Sentinelle tracks aggregated ARI numbers—COVID isn't broken out of the stats—but if COVID cases had increased due to the Olympics, they weren't high enough to impact the overall ARI numbers. Worth noting that the summer KP.x wave seems to have minimally affected FR.
 32-2/ For instance, NYC's (Manhattan's) wave started late, showed a sharp upward trend, and now it's dropping off quickly. Boston's wave started earlier, and was less pronounced, but it's dropping off...
