beowulf888 Profile picture
Jul 29 17 tweets 7 min read Read on X
30-1/ COVID update for epidemiological weeks 29-30 of 2024.

COVID wastewater numbers are still rising at a steady rate. CDC's wastewater chart shows more significant rise than Biobot, but (as I said before) I don't really trust the CDC's methodology and lack of transparency. Image
30-2/ The current wave is manifesting itself unevenly across different sewersheds. For instance, San Jose shows the current wave as big as the last one, but 40 miles up the road, Oakland doesn't show much of wave at all...
Image
Image
30-3/ NYC (Manhattan) has seen a strong surge in the past 4 weeks. While up in Boston, things may have peaked.
Image
Image
30-4/ While the US's summer wave was ramping up, Australia was having its winter wave. AUS has been slow to update its national stats, but the New South Wales data (NSW is the most populous state in AUS) shows that their wave is over. And it was largely a KP.3x wave. Image
30-5/ KP.3 descendants are the most common, but KP.3x is not the sole driver of the US wave. @RajlabN's NYITCOM report shows other vars are still common. CDC suggests that KP.3.1.1 will be the big grower this week, but Cov-Spectrum suggests its rate of growth is tapering off

Image
Image
Image
@RajlabN 30-6/ COVID hospitalizations remain low—and they've stayed lower for the first half of this year than any previous years. That could change of course but for some unexplained reason the CDC is predicting that hospitalizations will drop this month (I think they'll rise a bit).
Image
Image
@RajlabN 30-7/ Deaths remain low. Of course, death certificates are trickling in from previous weeks, but it looks like between 300-400 people are dying from COVID each week. That mortality rate is roughly 1 in a million per week. Image
@RajlabN 30-8/ 1st half 2024 ~15K people died from COVID. I predict that its death toll will be <30K this year. This will be well within the 25-70K estimated deaths due to flu last flu season (per the CDC). That would put COVID around 12th place among common natural causes of death.
@RajlabN 30-9/ Unlike other respiratory diseases, SARS2 never drops to undetectable levels in wastewater—which indicates that it never really stops circulating. I don't expect it will become a seasonal virus anytime soon. Image
@RajlabN 30-10/ Although we've built up a pretty good firewall of population immunity against this virus, your individual response to reinfection may vary. Dr Daniel Griffin on TWiV 1134 presented this chart (a National Covid Cohort Collaborative study from electronic health records)... Image
@RajlabN 30-11/ ...one's chances of dying from subsequent infections depends on the severity of initial infection. TWIV didn't provide link to this study, but it suggests to me that certain people are physiologically more susceptible to SARS2.

tinyurl.com/nx593u4p
30-12/ Based on UK ONS data @Jean__Fisch estimates the risk of developing Long COVID at the end 2023 was overall ~1.5%, with severe symptoms at ~0.3%.


Image
@Jean__Fisch 30-13/ We're into 3Q now, and the Long COVID mass disabling event still hasn't happened (though SSA disability claims are still tracking up a bit). And excess deaths remain in pre-COVID ranges (h/t to @Truth_in_Number).
Image
Image
@Jean__Fisch @Truth_in_Number 30-14/ And here's an interesting study that conclusively shows that SARS2 does not interact with the T cell receptors nor directly activates T cells—so AJ's claims about T cell exhaustion are bunk. (h/t @ejustin46 who has the links to the coolest papers.)
pnas.org/doi/10.1073/pn…
@Jean__Fisch @Truth_in_Number @ejustin46 30-15/ In scarier news, the Congo's Clade 1 MPox outbreak has spread. South Africa reports cases and deaths. Remember: Clade 1 MPox is deadlier than Clade 2 from 2 years ago—and it doesn't require sexual contact to spread. CDC says no cases in the US—yet. tinyurl.com/3v2yhxw9
@Jean__Fisch @Truth_in_Number @ejustin46 30-16/ That's all for this update. But anecdatally, more friends of mine have caught COVID in the past month than during any previous wave—maybe because my cohort isn't taking precautions any longer. All the cases have been mild, though (knock on wood).
@threadreaderapp unroll

• • •

Missing some Tweet in this thread? You can try to force a refresh
 

Keep Current with beowulf888

beowulf888 Profile picture

Stay in touch and get notified when new unrolls are available from this author!

Read all threads

This Thread may be Removed Anytime!

PDF

Twitter may remove this content at anytime! Save it as PDF for later use!

Try unrolling a thread yourself!

how to unroll video
  1. Follow @ThreadReaderApp to mention us!

  2. From a Twitter thread mention us with a keyword "unroll"
@threadreaderapp unroll

Practice here first or read more on our help page!

More from @beowulf888

Dec 25, 2023
51-1/ Summary of COVID trends as of epidemiological weeks 50 & 51.

Wastewater numbers continue to rise. Biobot and CDC agree (but I suspect they're using the same sewersheds for their data). OTOH, before we freak out, we should zoom out...
Image
Image
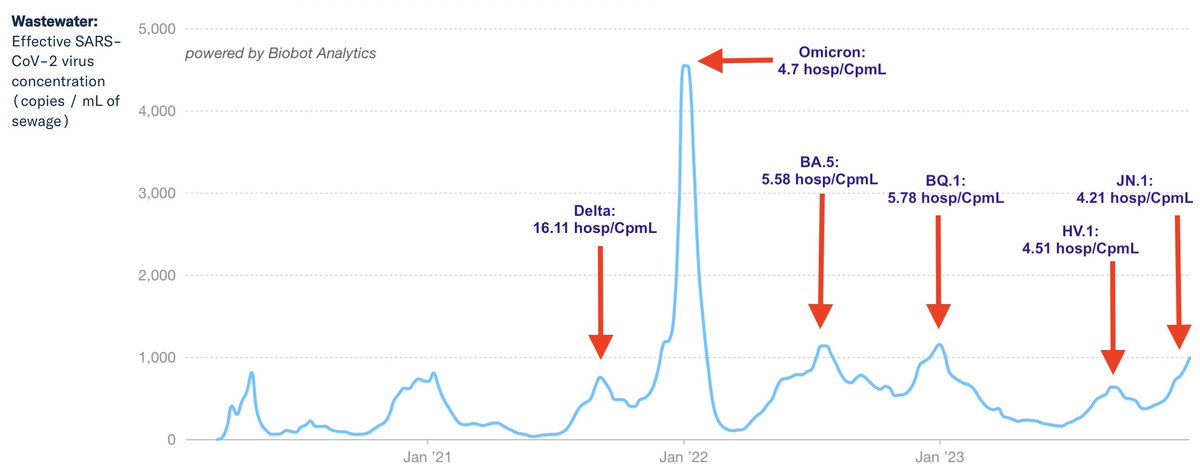
51-2/ This wave is shaping up to surpass, the BQ.1 wave at the end of last year. But despite JN.1's immune evasiveness (at least in vitro) and ACE2 binding scores (at least in vitro) which are lightyears beyond Omicron, it's not another Omicron. Zooming out... Image
52-3/ But the wastewater levels are higher than the ww levels during the Delta wave of 2021! However, if we take the CDC hospitalization rates divided by CpmL concentrations for each peak, we see that the current wave (as of 2 wks ago) is ~1/4 as virulent as Delta. Go T cells! Image
Read 13 tweets
Dec 10, 2023
49-1/ Summary of COVID trends as of epidemiological weeks 48 & 49.

Biobot shows our wastewater numbers are climbing quickly, indicating a rapid spread of the virus (probably all due to JN.1). NE and Midwest showing the largest increases. Image
49-2/ CDC's NWSS says the same w/ Midwest having highest ww activity. Biobot and NWSS numbers are 10-14 days old. We probably haven't reached BQ.1 territory, yet, but soon will. Image
49-3/ I'll remind folks that BQ.1's climb was snuffed out by XBB.1.5, which outcompeted BQ.1, but didn't create new cases—the theory being that XBB.1.5's ⬆️ ACE binding values outcompeted BQ.1, but similar immune evasion values didn't open up new infection opportunities. Maybe. Image
Read 20 tweets
Sep 30, 2023
39-1/ Summary of COVID trends as of Epidemiological Weeks 38-39. Good news—the current wave in the US has definitely peaked and is starting to drop off. Biobot wastewater shows a sharp drop-off in 3 out of 4 regions—and 4th, the NE US, is starting to drop, too... Image
39-2/ Emergency Department visits are falling. Hospitalizations may trail the ED curve by a week or two, but they seem to have peaked as well... Image
39-3/ It's worth noting that the southern states got hit the worst in this wave—at least as a percentage ED visits due to COVID. Compare Alabama to New York—5% vs 2%...
Image
Image
Read 52 tweets
Sep 16, 2023
37-1/ Summary of COVID trends as of Epidemiological Weeks 36-37. This week's update will be brief because I'm traveling. The main question on my mind is has the current wave peaked, yet? Nat'l wastewater avgs have dropped off 12% in last 2 weeks. Image
37-2/ Midwest still climbing, but the South—where case rates were 2x higher than the rest of the US 3-4 weeks ago—has the sharpest drop in wastewater numbers. The CDC's ww percent change category chart shows things leveling off, too. I never found that metric useful because…
Image
Image
37-3/ …because it's not tied to any baseline number and it hides the peaks and troughs—but it is what it what it is. But if we zoom out on the Biobot data, we can see where we stand now vs previous waves. I got pushback that this wave is almost as high as the Delta wave. True... Image
Read 15 tweets
Sep 2, 2023
35-1/ Summary of COVID trends as of Epidemiological Weeks 34-35. EG.1.5's impact on US & world case numbers is starting to become clear. Also more info BA.2.86, and I'll dig into the lit on asymptomatic COVID (spoiler: lots of poor studies).

But first the wastewater numbers... Image
35-2/ If you had asked me two days ago, I would have told you that wastewater indicators seemed to indicate the latest COVID wave had reached its peak. But then data from some more sewersheds came in, and ww may still be trending upward... Image
35-3/ The Biobot tool ——displays the overall variant proportions, but that data is two weeks behind wastewater RNA concentration data. It shows EG.5 growing at 14% as of 16 Aug. Could EG.5 be responsible for this latest upturn in ww numbers? Maybe. biobot.io/data/
Image
Read 34 tweets
Aug 20, 2023
33-1/ Summary of COVID trends as of Epidemiological Weeks 32-33. I'll summarize what we know about EG.1.5 & the new BA.2.86 var that's in the news. I'll share some thoughts on PASC too.

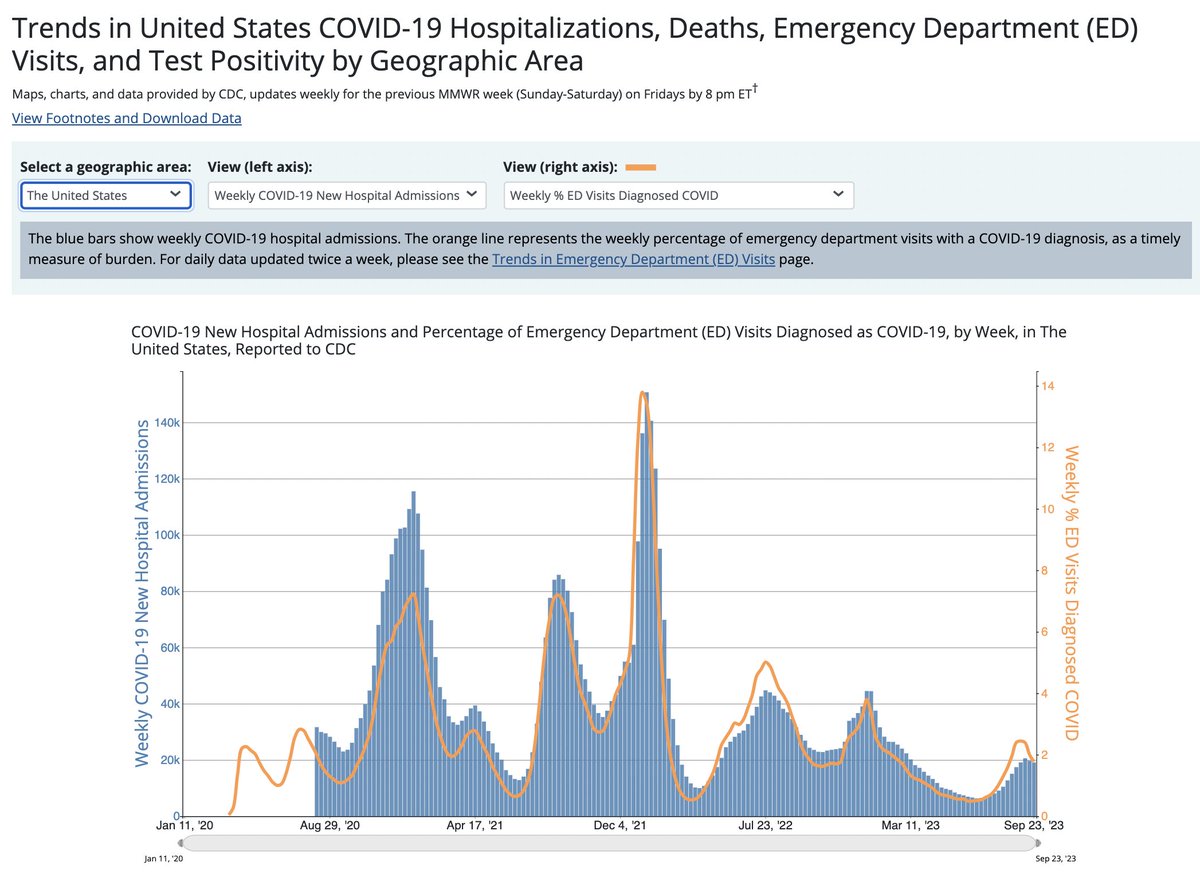
But 1st the numbers—the current wave hasn't peaked, yet. ED visits, hospitalizations still ↗️ Image
33-2/ O/c, the numbers in the previous slide are 2-3 weeks past, but we can infer from the curves that weekly hosp rates *may* be as high as 12K/week now & ED visits diagnosed w/ COVID might be >1.5%. Yes COVID ED visits are 3x June, but we're still well below the prev wave. Image
33-3/ I've appropriated @vickersty's dictum that it's always good to zoom out, especially when we hear alarmist stories in the MSM & soc media. I still doubt it will exceed Dec's BQ.1 wave. Biobot wastewater numbers are still climbing, but...
Image
Image
Read 43 tweets

Did Thread Reader help you today?

Support us! We are indie developers!


This site is made by just two indie developers on a laptop doing marketing, support and development! Read more about the story.

Become a Premium Member ($3/month or $30/year) and get exclusive features!

Become Premium

Don't want to be a Premium member but still want to support us?

Make a small donation by buying us coffee ($5) or help with server cost ($10)

Donate via Paypal

Or Donate anonymously using crypto!

Ethereum

0xfe58350B80634f60Fa6Dc149a72b4DFbc17D341E copy

Bitcoin

3ATGMxNzCUFzxpMCHL5sWSt4DVtS8UqXpi copy

Thank you for your support!

Follow Us!

:(