PMC COVID-19 Forecast, Aug 2, 2024 (U.S.)
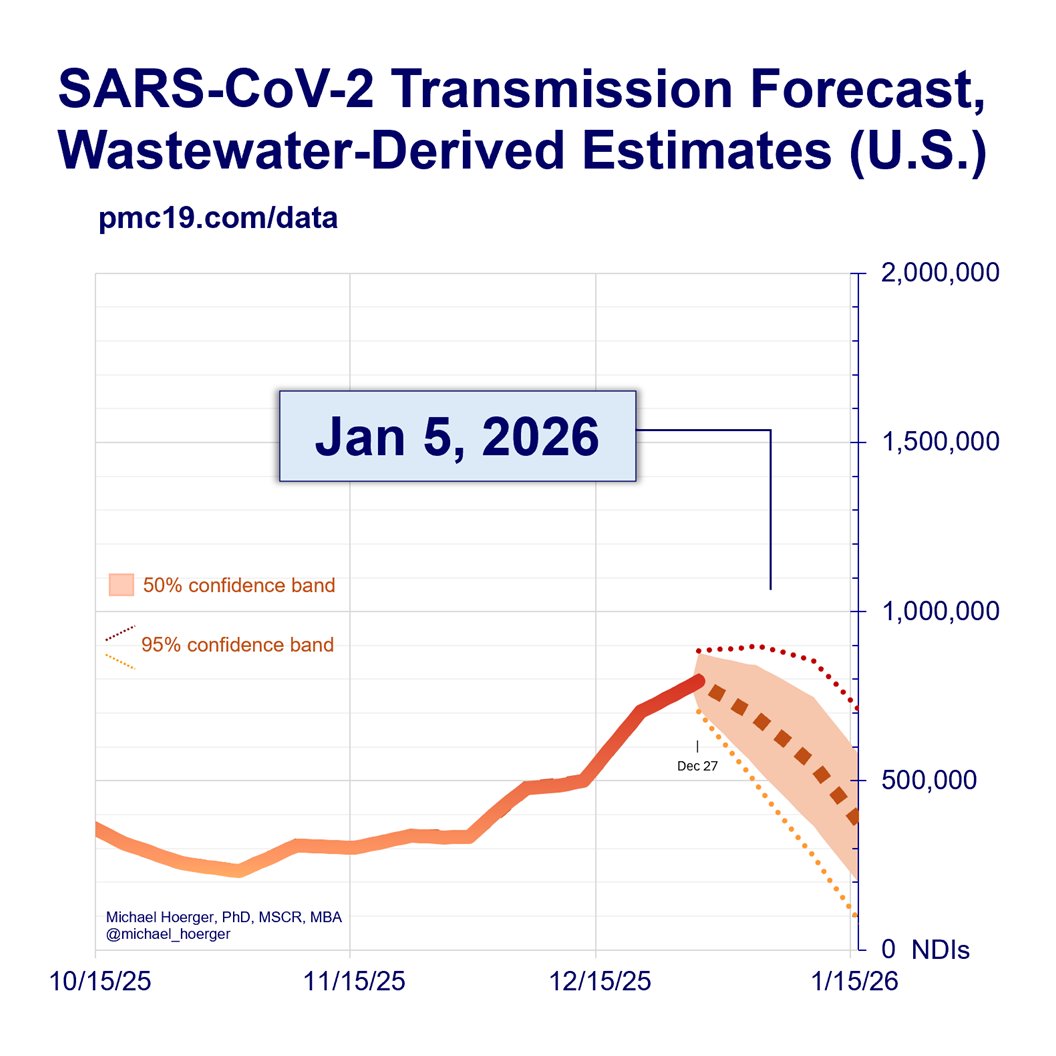
Expect 2 more weeks of very high and stable transmission before the summer wave accelerates.
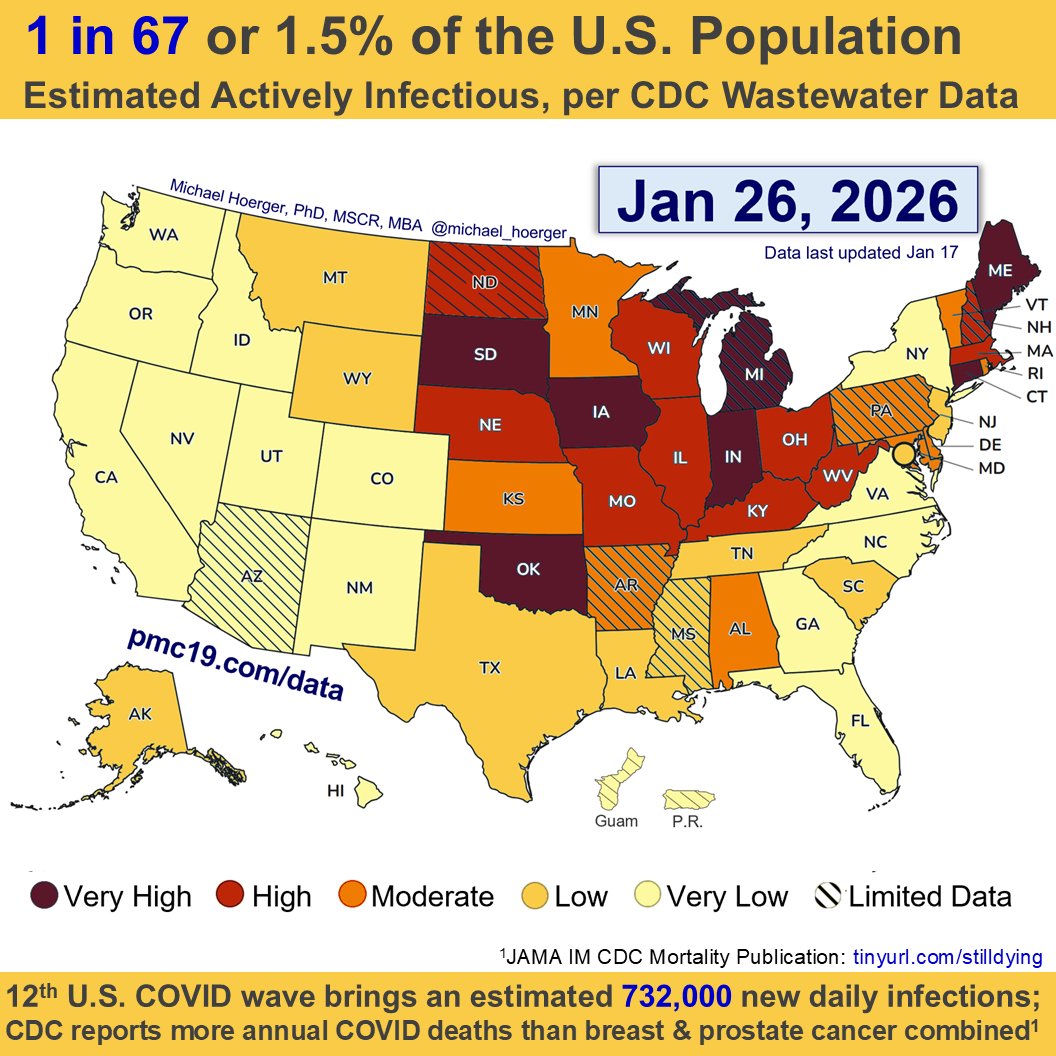
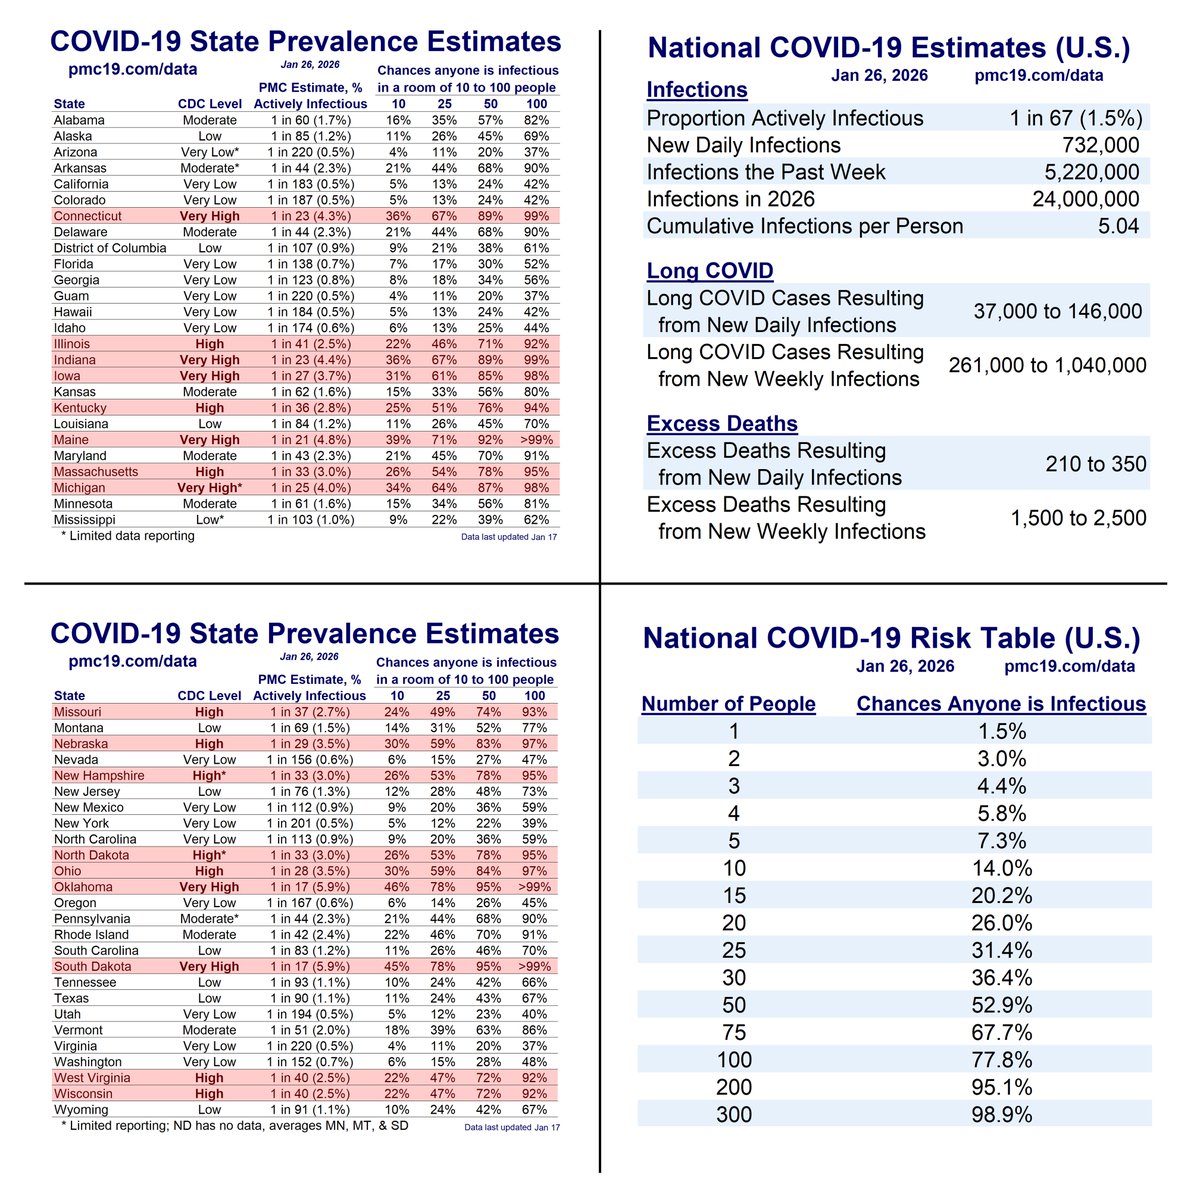
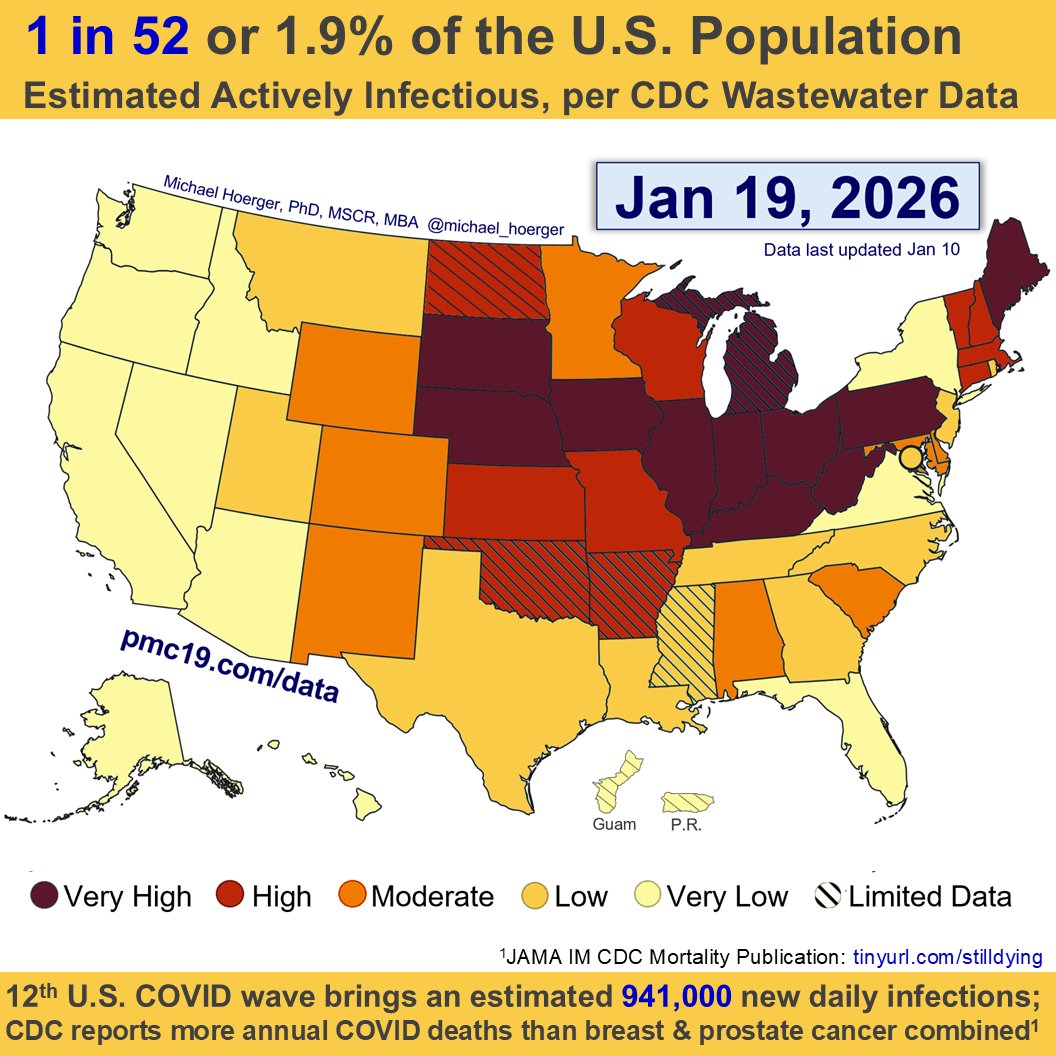
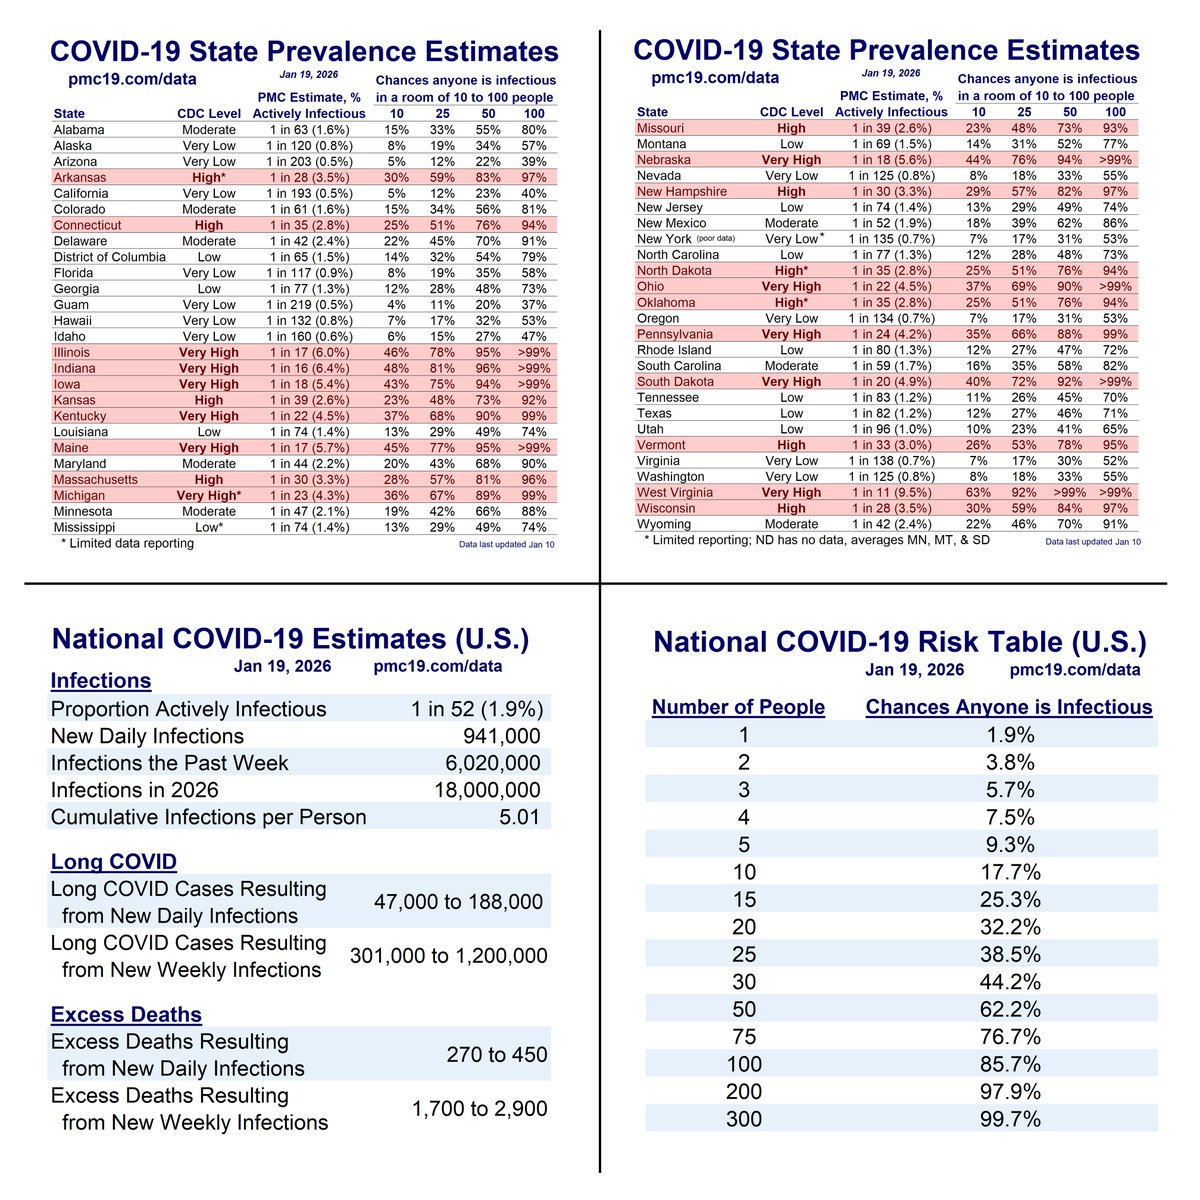
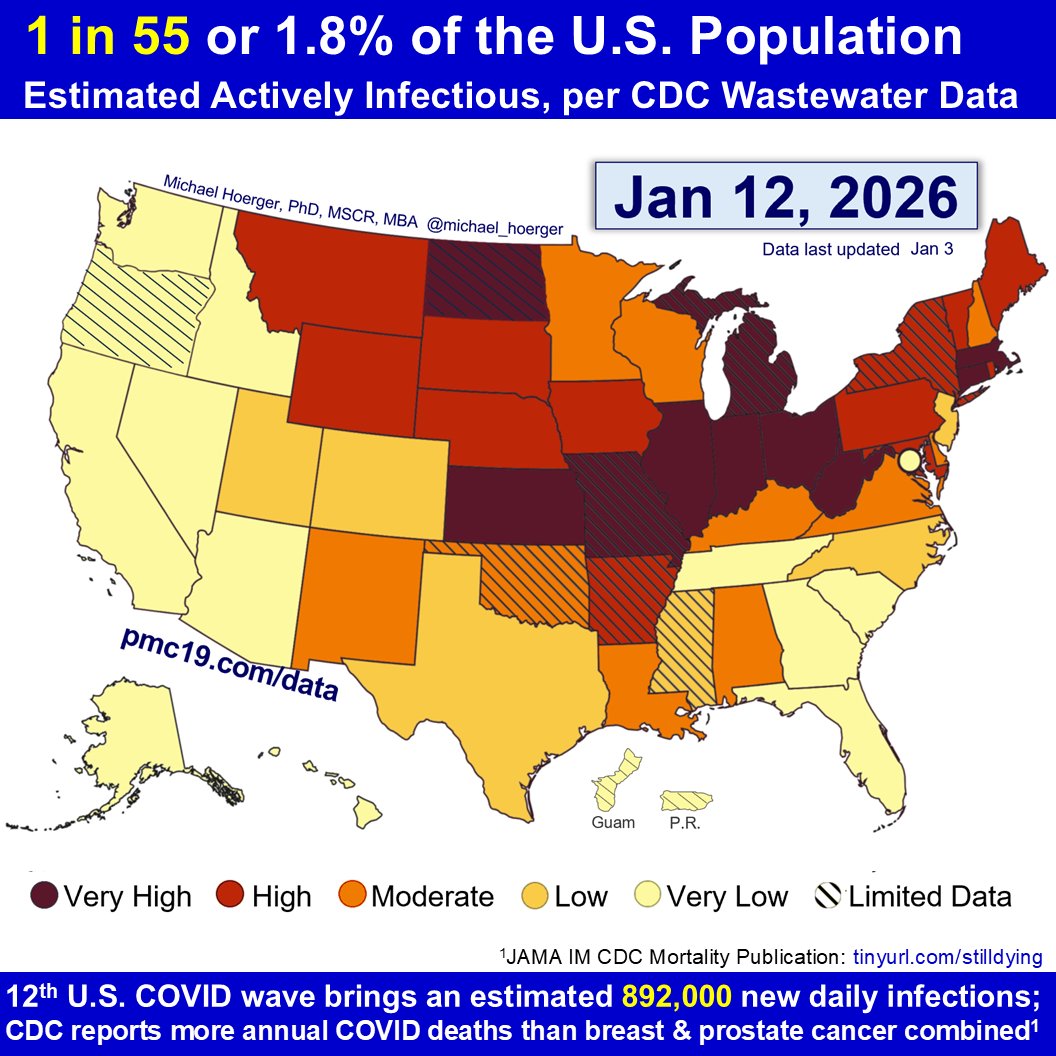
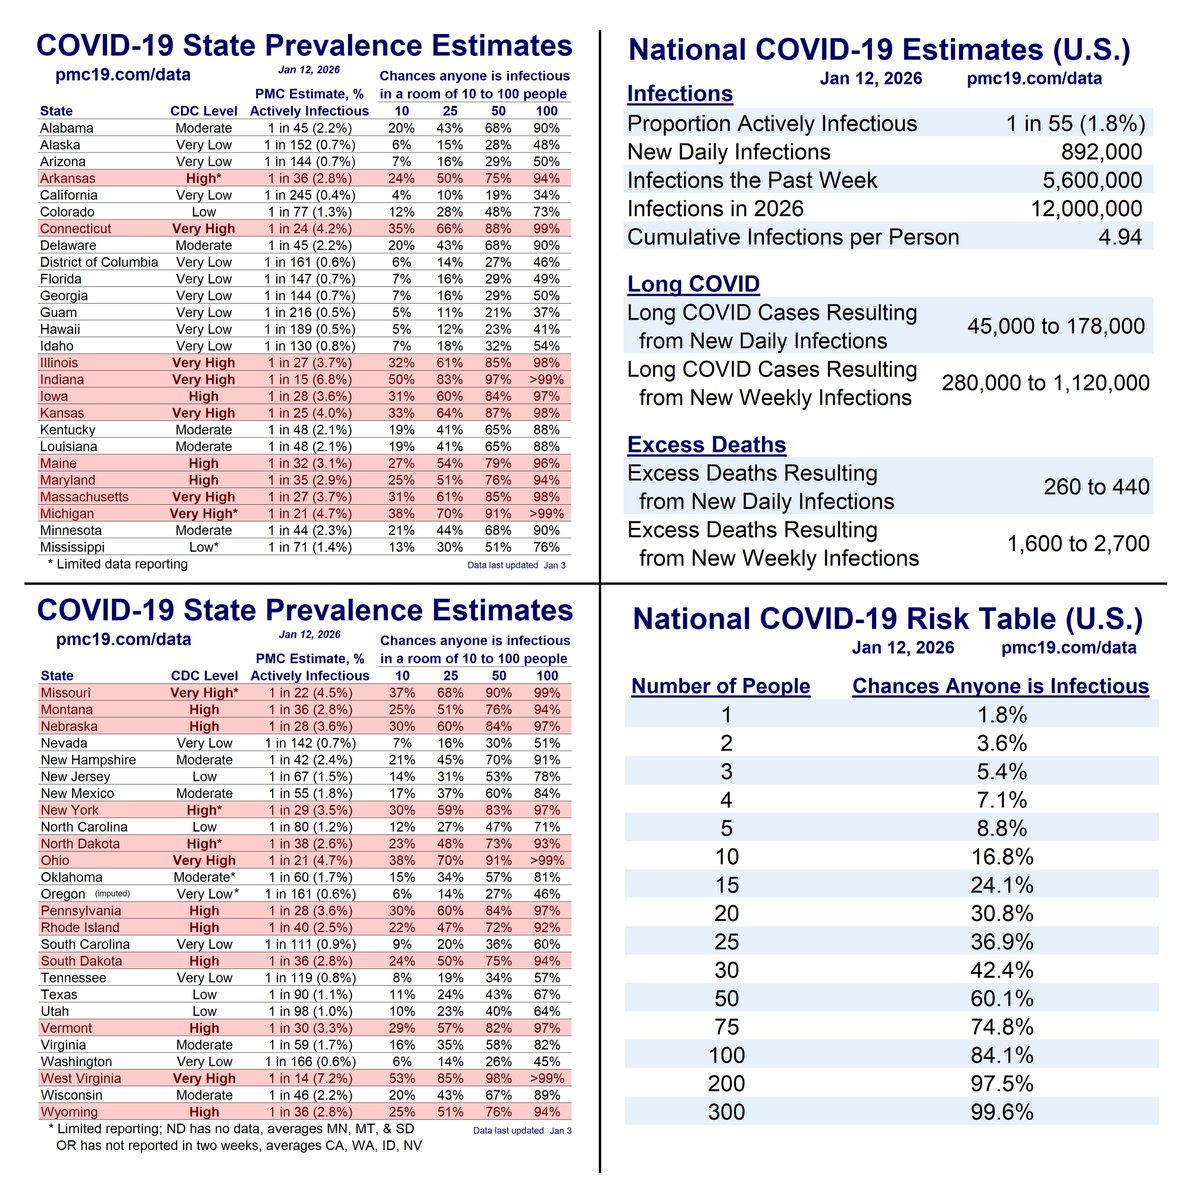
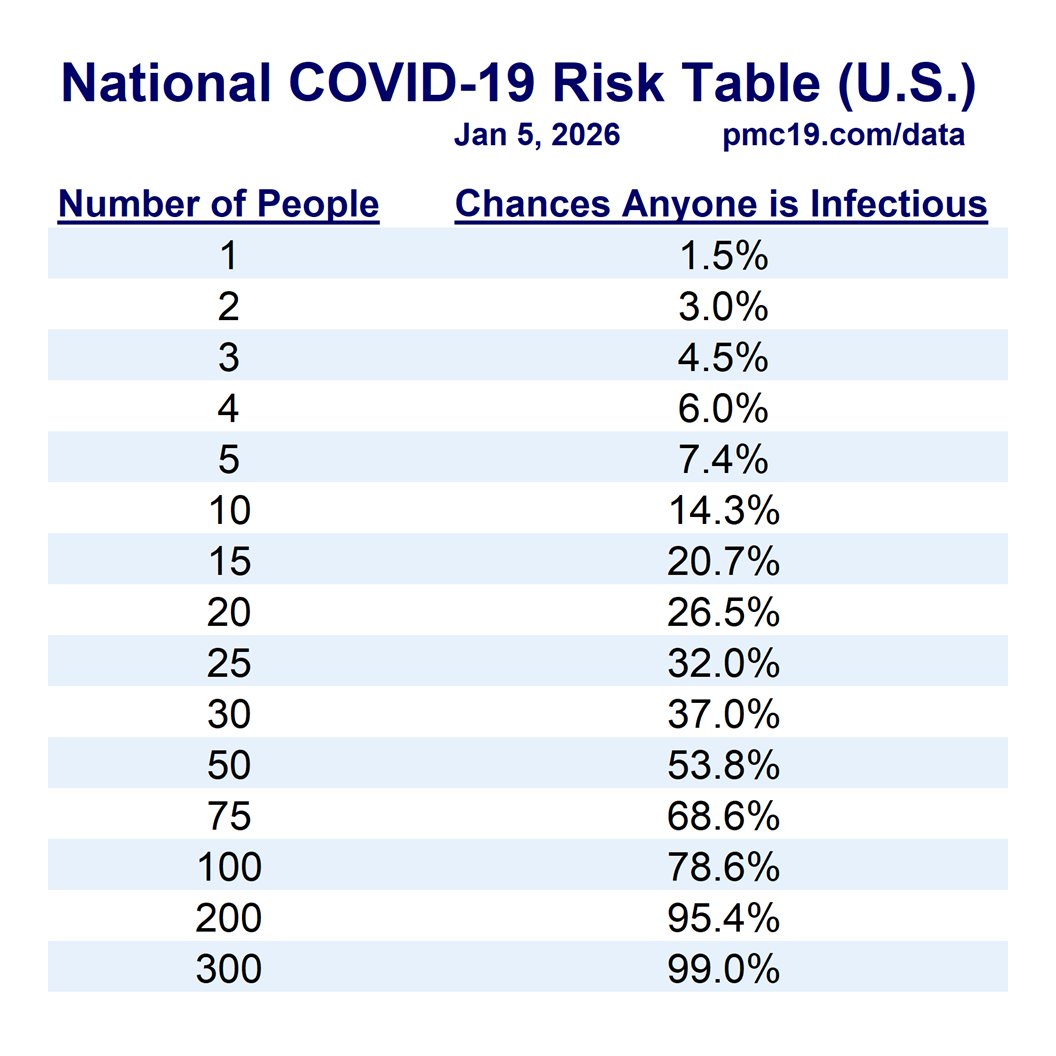
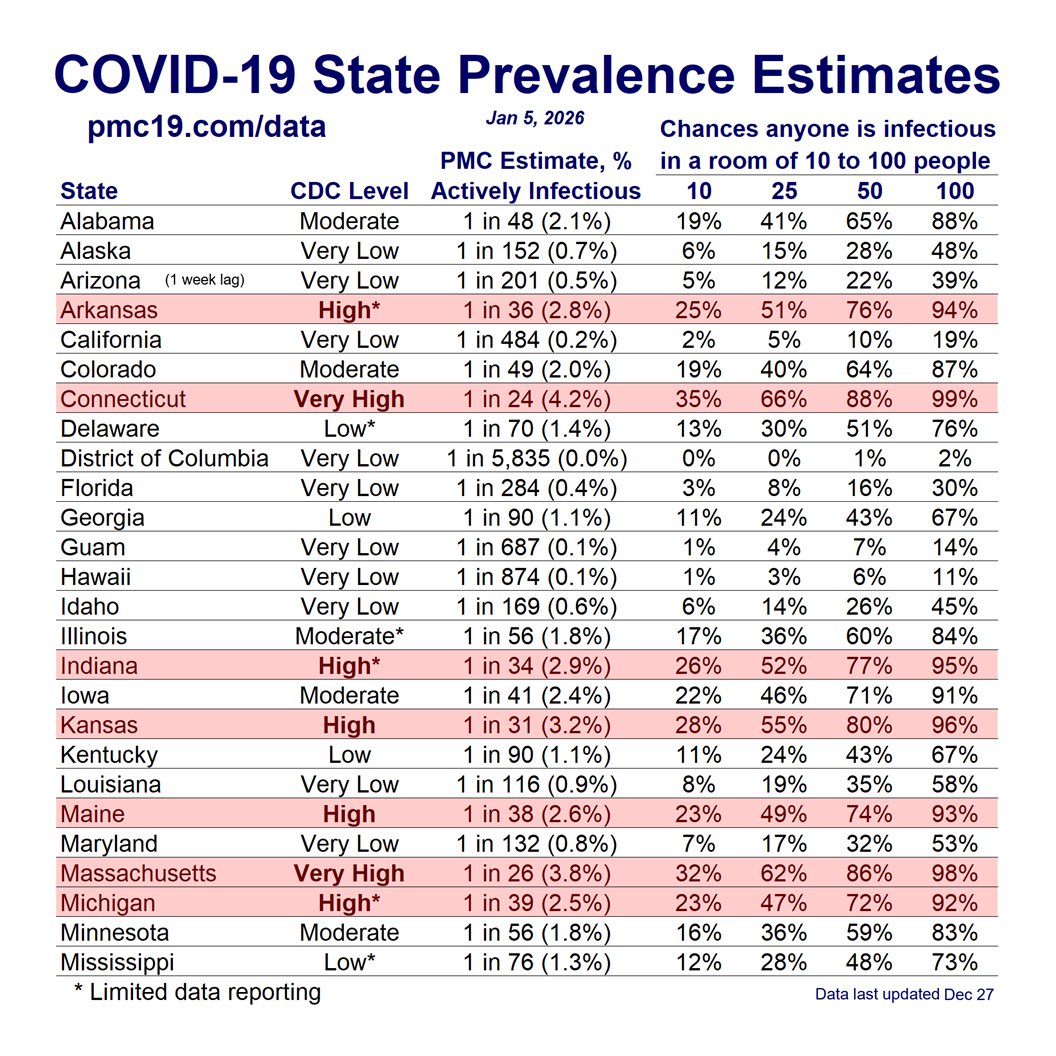
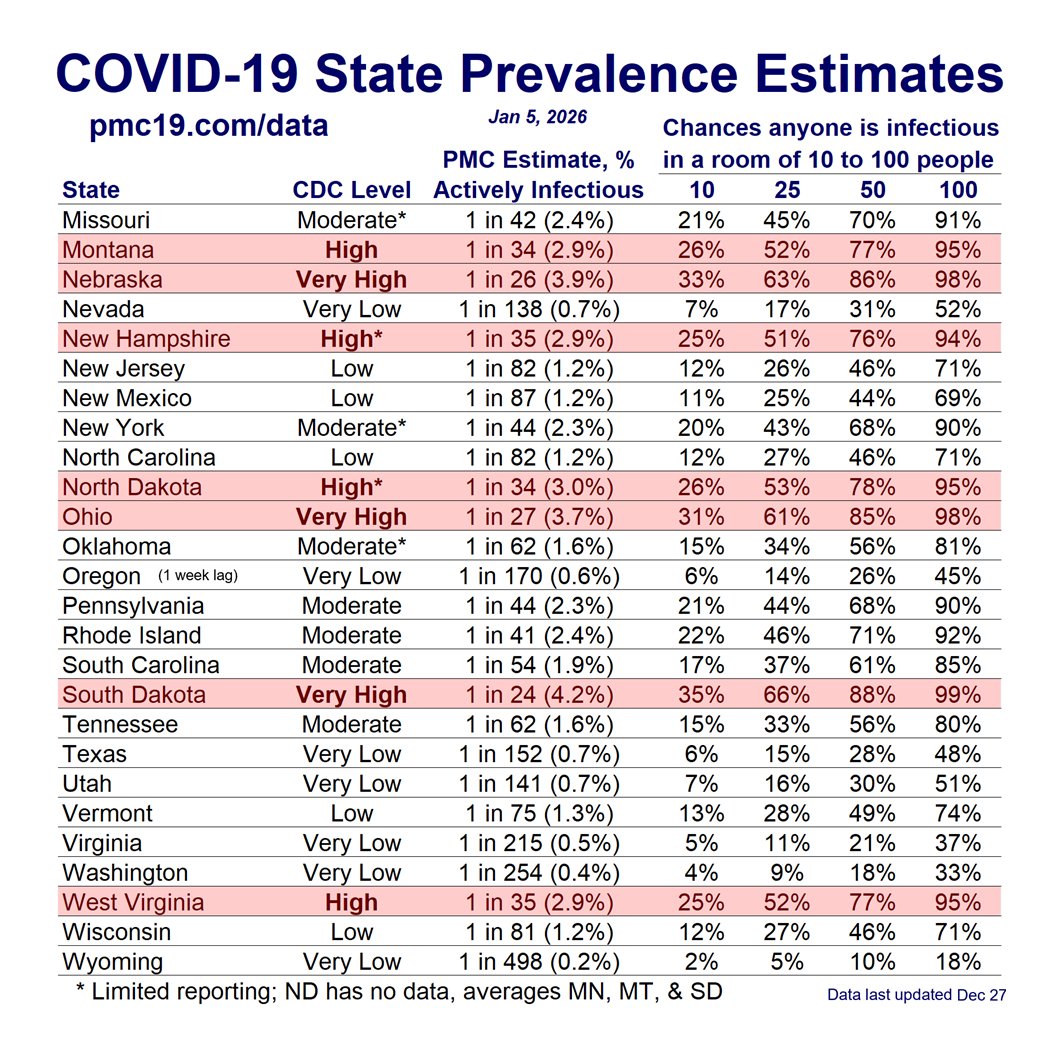
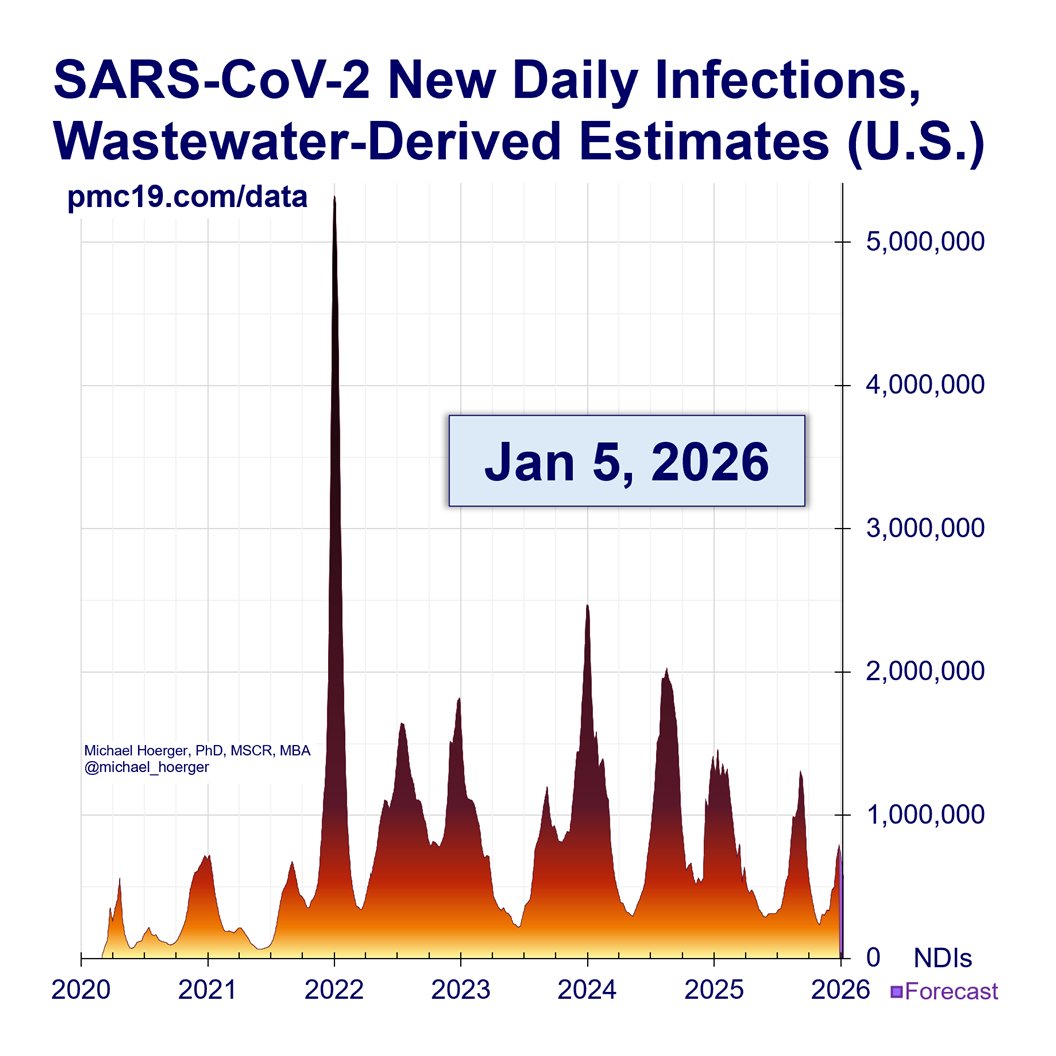
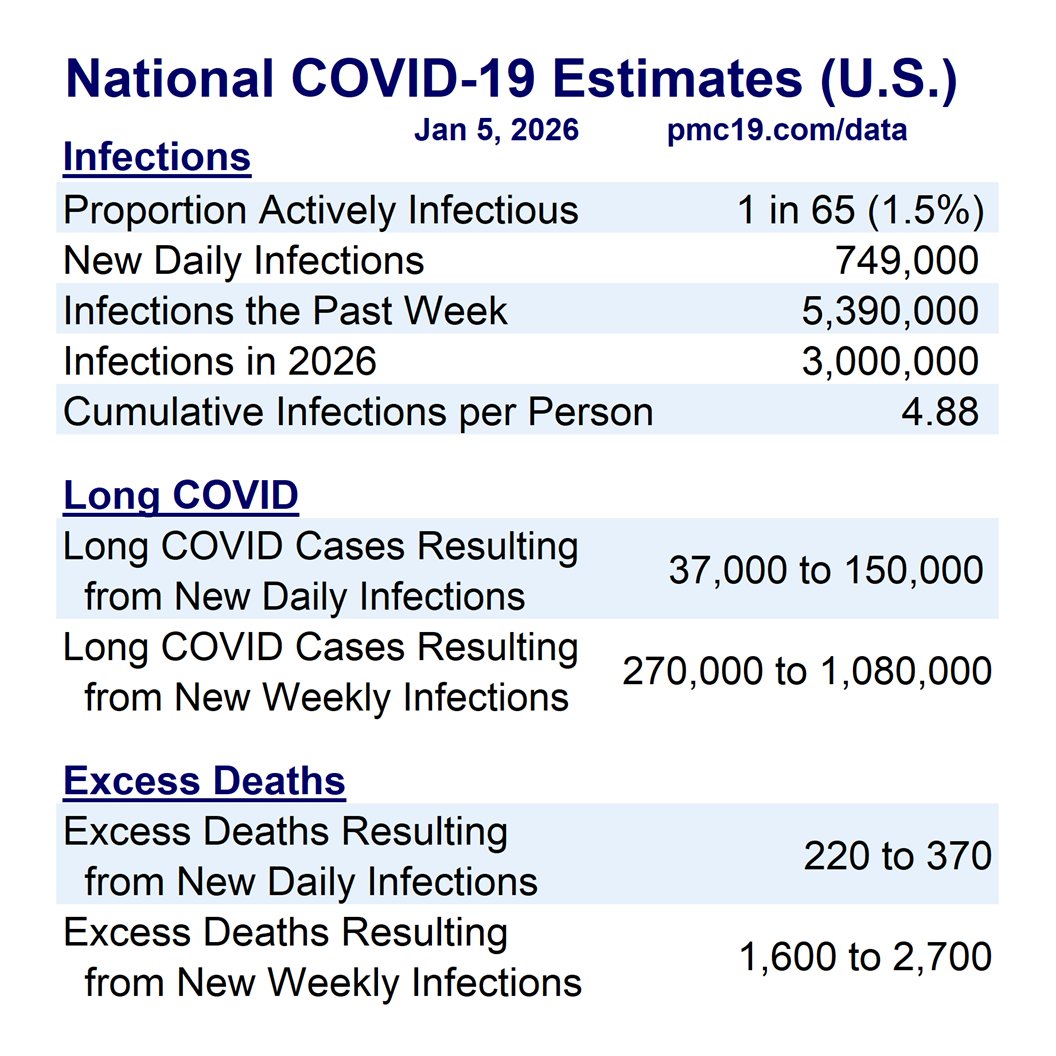
Currently at an estimated 850,000 daily infections, 1 in 56 Americans contagious, 43,000 resulting Long COVID cases/day.
Deep Dive:
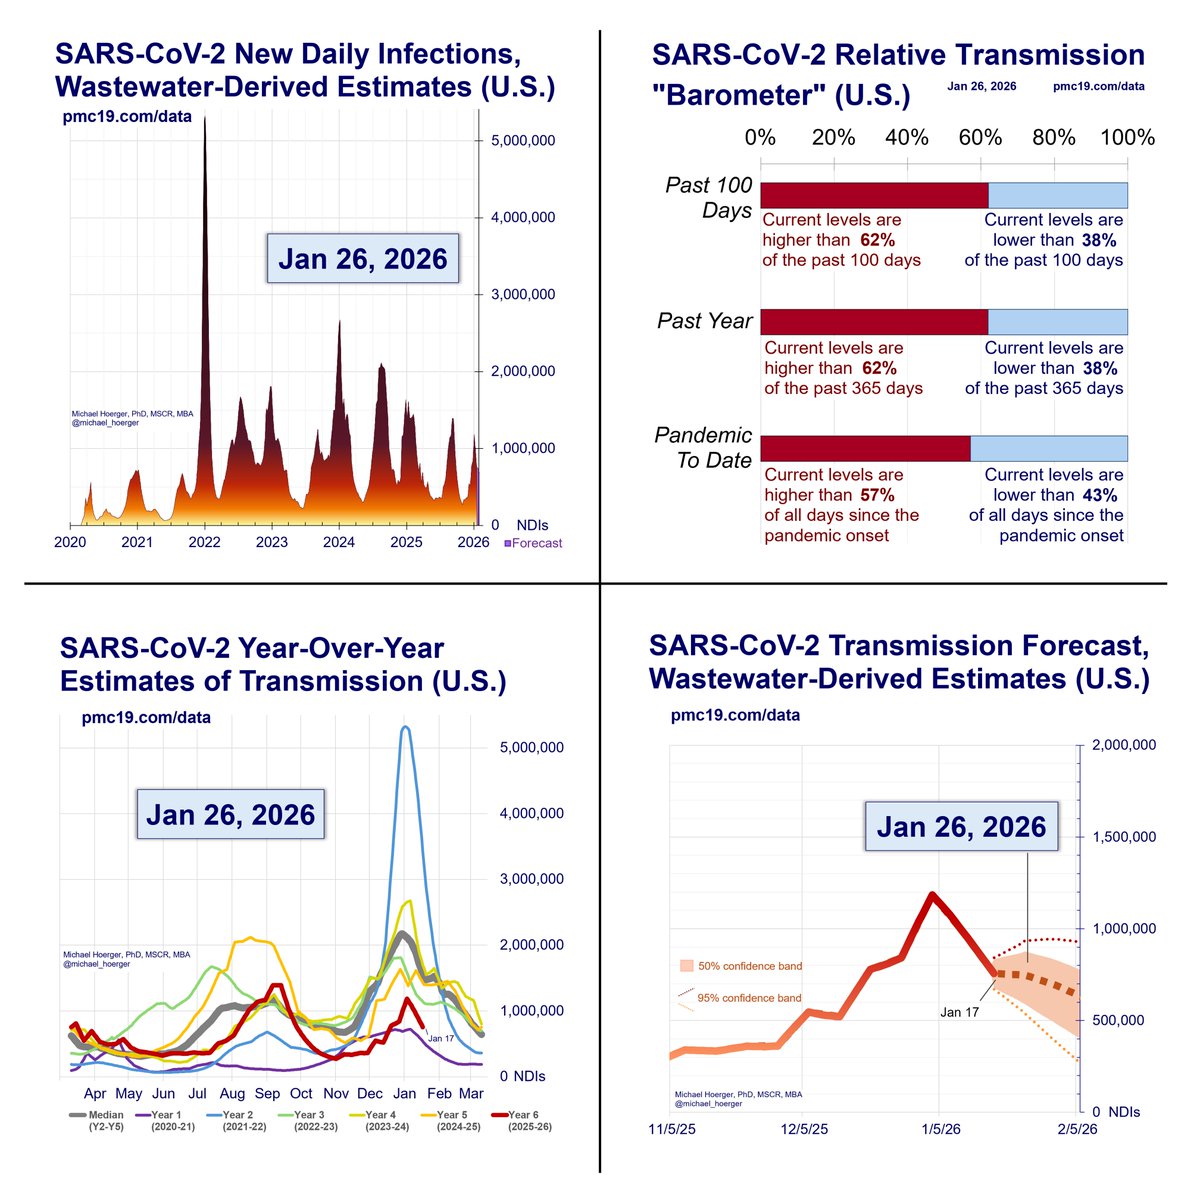
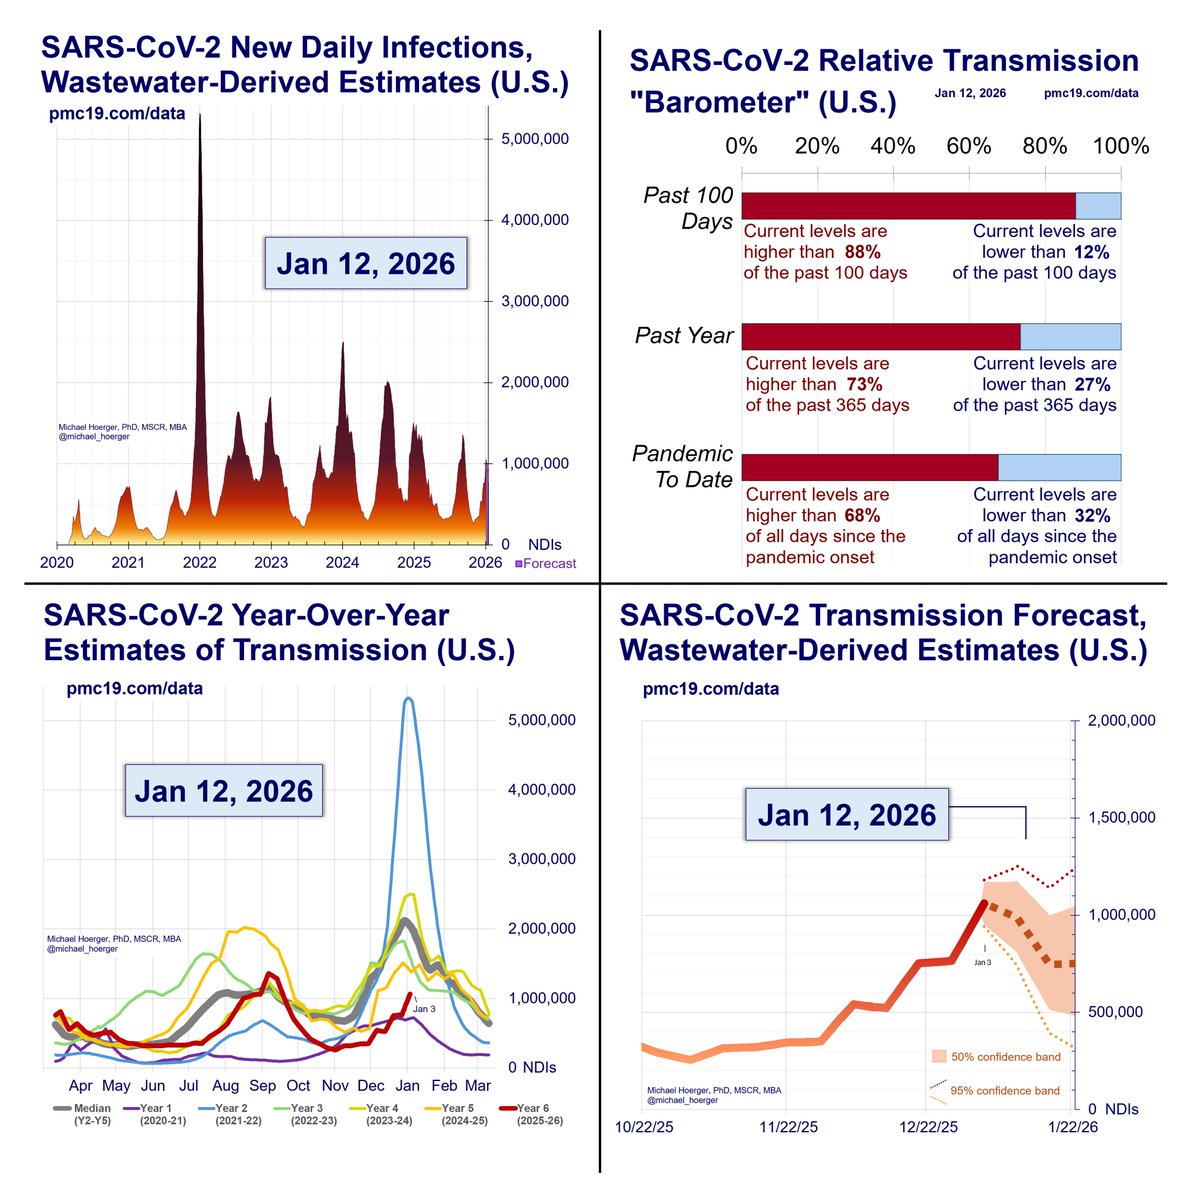
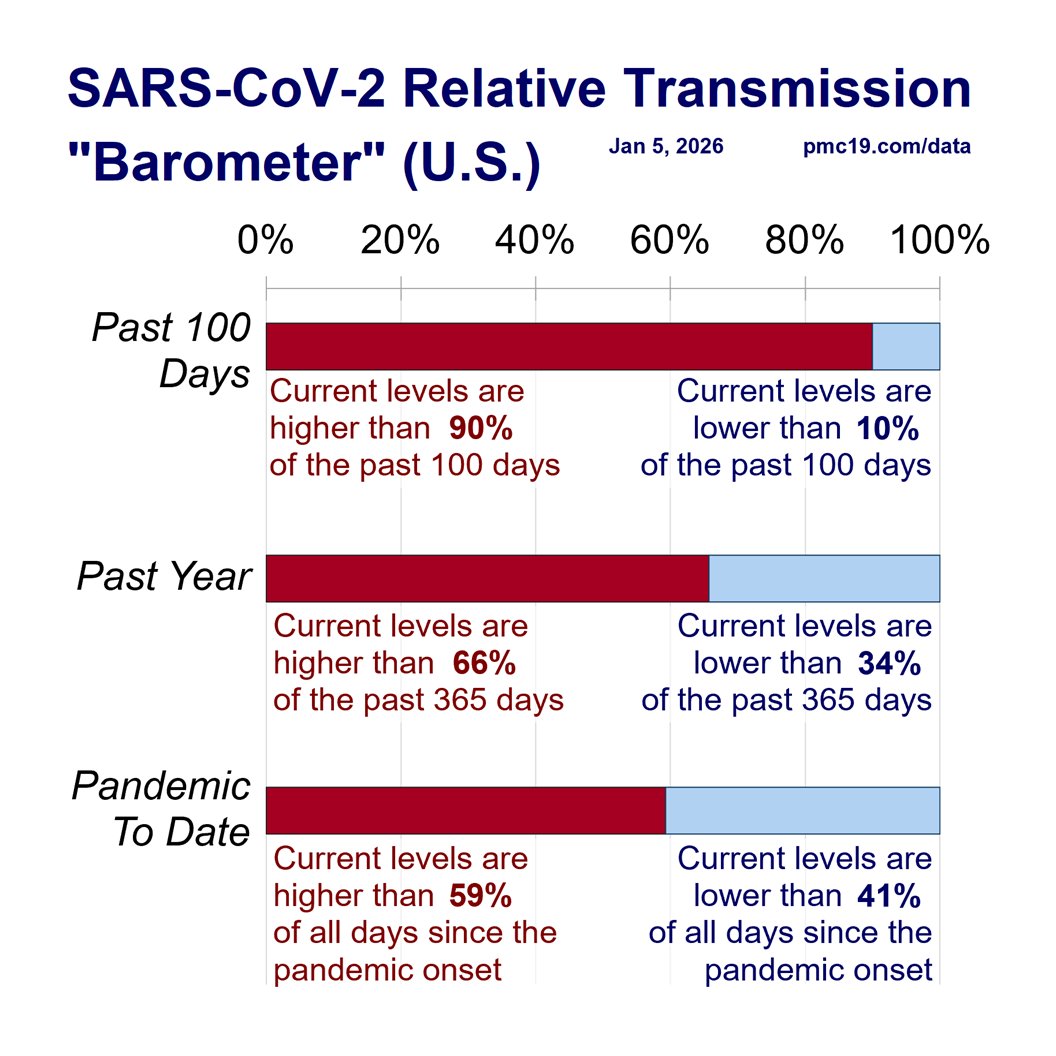
Over the next two weeks, we should see very high and stable transmission, before transmission increases rapidly. Note that transmission estimates are down marginally – of no practical impact – relative to last week. One might be tempted to consider that the summer wave is subsiding. That might be a 5-10% probability.
This is where the model gets interesting. The forecasts are derived from a combination of recent patterns in transmission (levels, change, rate of change, rate of rate of change) as well as historical medians for that date. If only using the recent patterns, a decline in the wave would be reasonable.
However, the historic data capture all of that useful information on variation in human behavior (back to school, end of summer vacations, flights, Labor Day) that focusing only on recent patterns would miss. Because behavioral patterns also fuel viral evolution, these historical data also get, to some extent, at the idea of viral evolution of new variants, which we do not track directly in the model.
When considering the forecast, view it two ways. One, based on current trends and historic data, this is what we would expect. Two, if human behavior defied historic trends, we could see something much different, such as a wave subsiding if everyone were more cautious than average this year, or unfortunately something slightly worse than predicted due to the decline in public health guidance on mitigation.
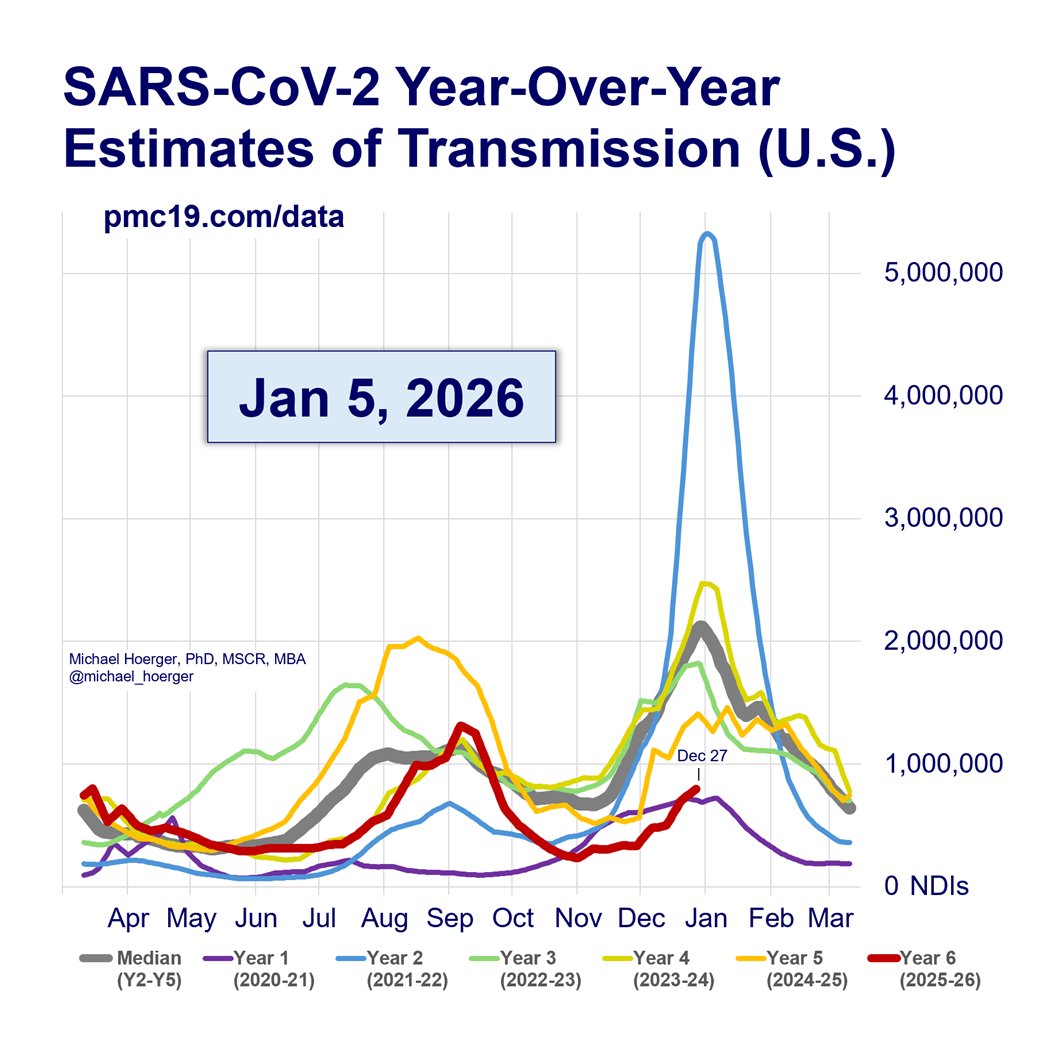
According to the composite forecasting model, that means hovering between 700,000 to 1,050,000 infections/day over the next month. Transmission is very high, and we may reach a later-summer peak of 1.1-1.3 daily infections around September 11.
Although the forecast is for steady transmission over the next two weeks, the forecast is volatile due to quality issues with incoming data.
Schools, medical facilities, and businesses should now escalate precautions and prepare for the disruption of a high percentage of the population getting sick through the remainder of 2024.

You can find the full PMC COVID-19 dashboard and weekly report for Aug 2, 2024 online.
In the report, I have included a link to the PPT slides from yesterday's Space on the new JAMA-NO #KeepMasksInHealthcare article.
Report: pmc19.com/data
In the report, I have included a link to the PPT slides from yesterday's Space on the new JAMA-NO #KeepMasksInHealthcare article.
Report: pmc19.com/data

• • •
Missing some Tweet in this thread? You can try to
force a refresh


