
There is a ton of noise on this app at the moment. To help you cut through that, let me share some key points:
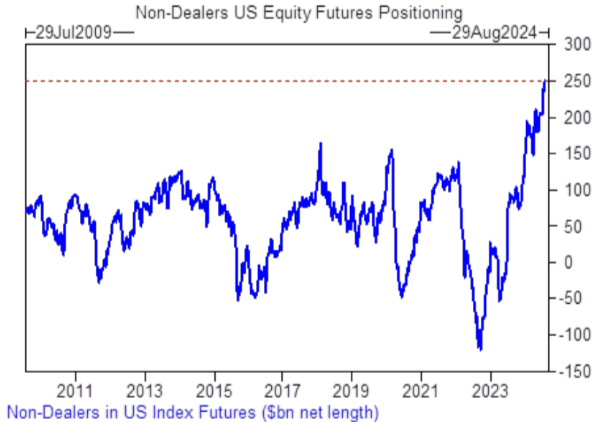
1. Long stocks (esp AI/Mag7), short yen and short vol were 3 VERY CROWDED trades coming into this. Many positioning metrics were at/near the 100th percentile in July. These positions will not get unwound in a week
1. Long stocks (esp AI/Mag7), short yen and short vol were 3 VERY CROWDED trades coming into this. Many positioning metrics were at/near the 100th percentile in July. These positions will not get unwound in a week

2. Japan has had zero interest rates for over 3 decades. Plenty of time for Yen carry trades to build up (estimates at $4T). Yen strength is causing a negative feedback loop as stops get triggered and overstretched carry positions get unwound. This is rattling positioning in global risk assets

3. Friday 2nd Aug, saw the largest-ever option volumes session. This indicates short vol positions are beginning to unwind, but there's much further to go on this. Again, to unwind these positions vol gets bid, which elevates vol, creating another negative feedback loop

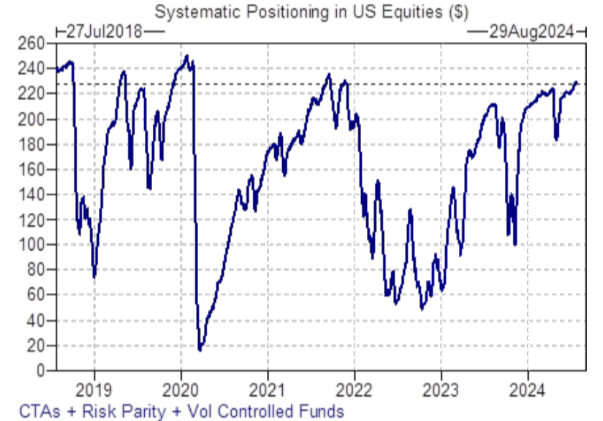
4. Systematic traders will keep hitting the bid on stocks so long as vol remains elevated. Their selling elevates vol, creating - you guessed it - another negative feedback loop. They are very long equities too, btw
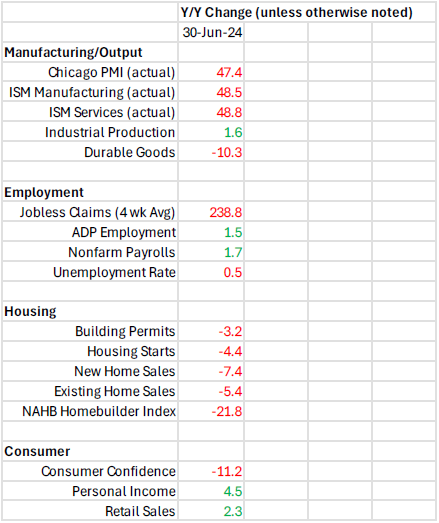
5. Are we looking at a growth scare or a recession? Odds favour the latter
All of the classic recession signals are lining up.action
i) Unemployment rate +0.8% within 12 months. Sahm Rule also triggered
ii) Yield curve is normalising after it's longest period of inversion
iii) Persistent weakness in manufacturing/output, employment, housing, the consumer
All of the classic recession signals are lining up.action
i) Unemployment rate +0.8% within 12 months. Sahm Rule also triggered
ii) Yield curve is normalising after it's longest period of inversion
iii) Persistent weakness in manufacturing/output, employment, housing, the consumer
https://x.com/simon_ree/status/1818844812696863017
6. What to do?
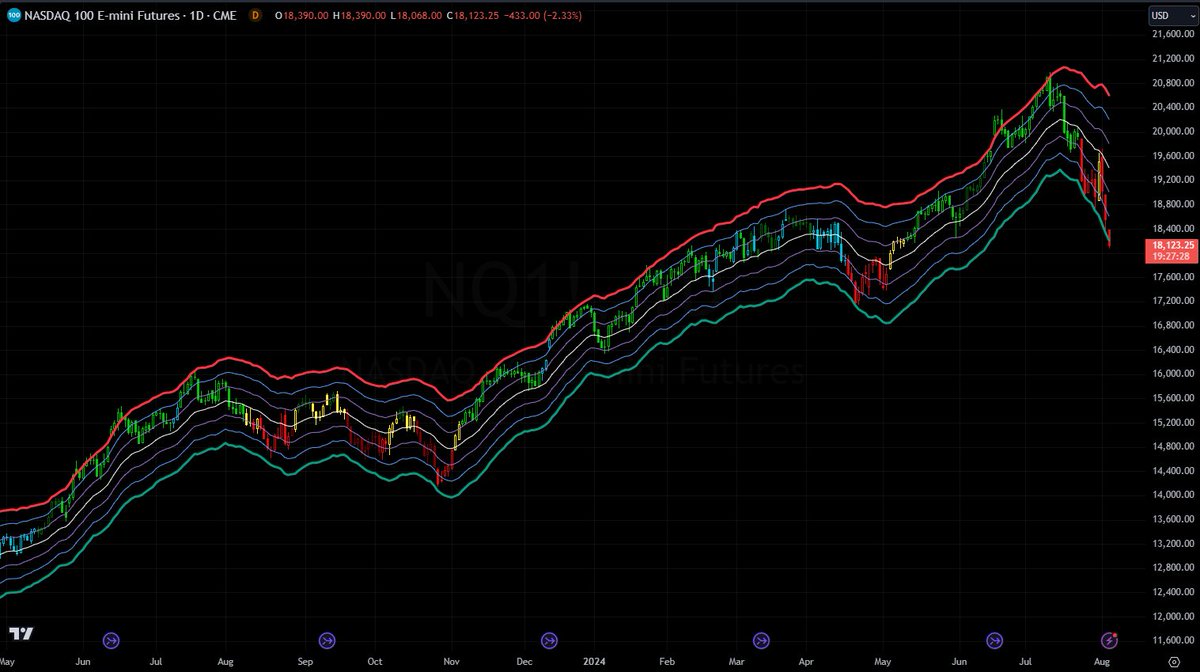
Stocks already looked stretched to the downside short term...but they can certainly get more stretched until Vol stabilizes. We're not in a buy-the-dip environment unless you are nimble and know what you're doing. Even then, wait for signs of reversal, don't blindly buy into a falling tape
Stocks already looked stretched to the downside short term...but they can certainly get more stretched until Vol stabilizes. We're not in a buy-the-dip environment unless you are nimble and know what you're doing. Even then, wait for signs of reversal, don't blindly buy into a falling tape
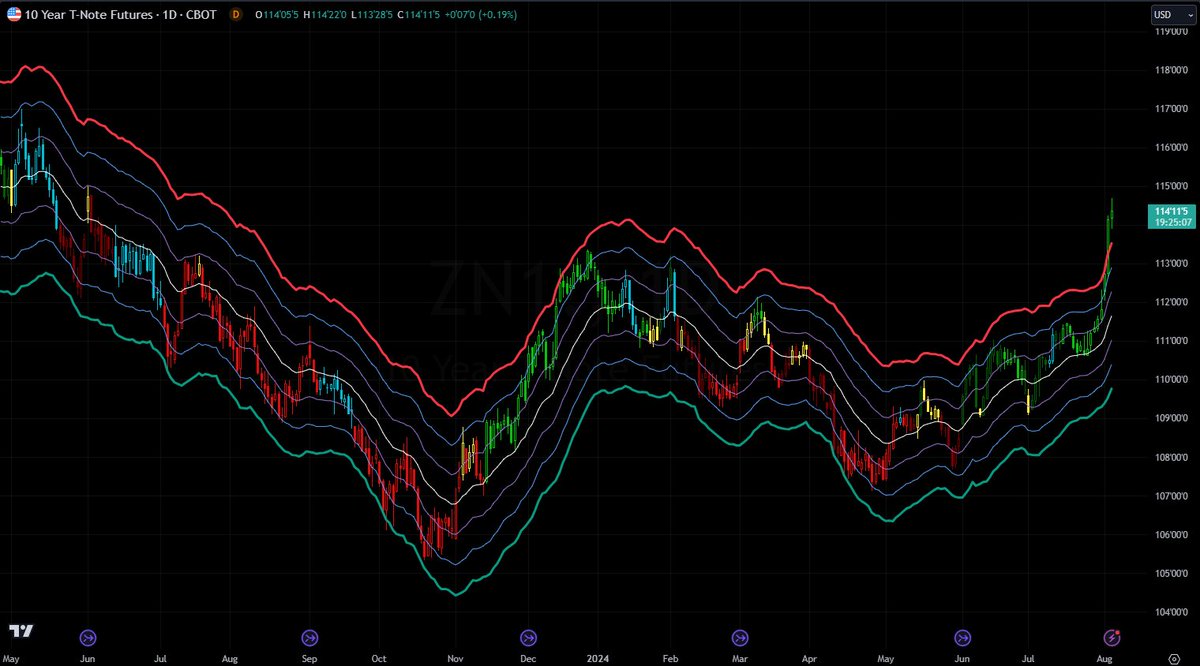
7. Bonds are looking stretched to the upside short term... but here we are in a buy-the-dip environment. I just wouldn't panic buy on Monday morning at these levels.
8. As always, this is not financial advice, do your own research, manage your risk etc, but I hope these points provide you with some clarity amid all the noise and histrionics
• • •
Missing some Tweet in this thread? You can try to
force a refresh


