Has the land sink collapsed in 2023?
I am not so convinced. The land sink has a lot of variability, mainly due to El Nino, and an El Nino overlapped 2023. So we expect a lower land sink in 2023.
(My estimate assumes the ocean sink was average).
1/
I am not so convinced. The land sink has a lot of variability, mainly due to El Nino, and an El Nino overlapped 2023. So we expect a lower land sink in 2023.
(My estimate assumes the ocean sink was average).
1/

Was 2023 an El Nino year? That is not so obvious...
How does one average the monthly sea surface data to an annual value El Nino index? How does one account for the lag between El Nino and the change in atmospheric CO2 growth?
There is no unique answer to this.
2/
How does one average the monthly sea surface data to an annual value El Nino index? How does one account for the lag between El Nino and the change in atmospheric CO2 growth?
There is no unique answer to this.
2/

This figure shows the monthly El Nino index annualised with different time lags. 2023 is an El Nino or La Nina, depending on how you average!
@richardabetts & @chrisd_jones use a 9 month lag in their work (which means 2023 was a La Nina)!
3/ metoffice.gov.uk/research/clima…

@richardabetts & @chrisd_jones use a 9 month lag in their work (which means 2023 was a La Nina)!
3/ metoffice.gov.uk/research/clima…

The bars (land sink) coloured by the El Nino index with different lags (3 and 9 months) mean that 2023 is either surprising (weak sink in a La Nina year) or rather mundane (weak sink in a El Nino year).
More disturbing is that the decade trend is slowing...
4/


More disturbing is that the decade trend is slowing...
4/


The ocean sink is less sensitive to El Nino & La Nina, but is also weakening in the last decade. A big concern!
5/


5/


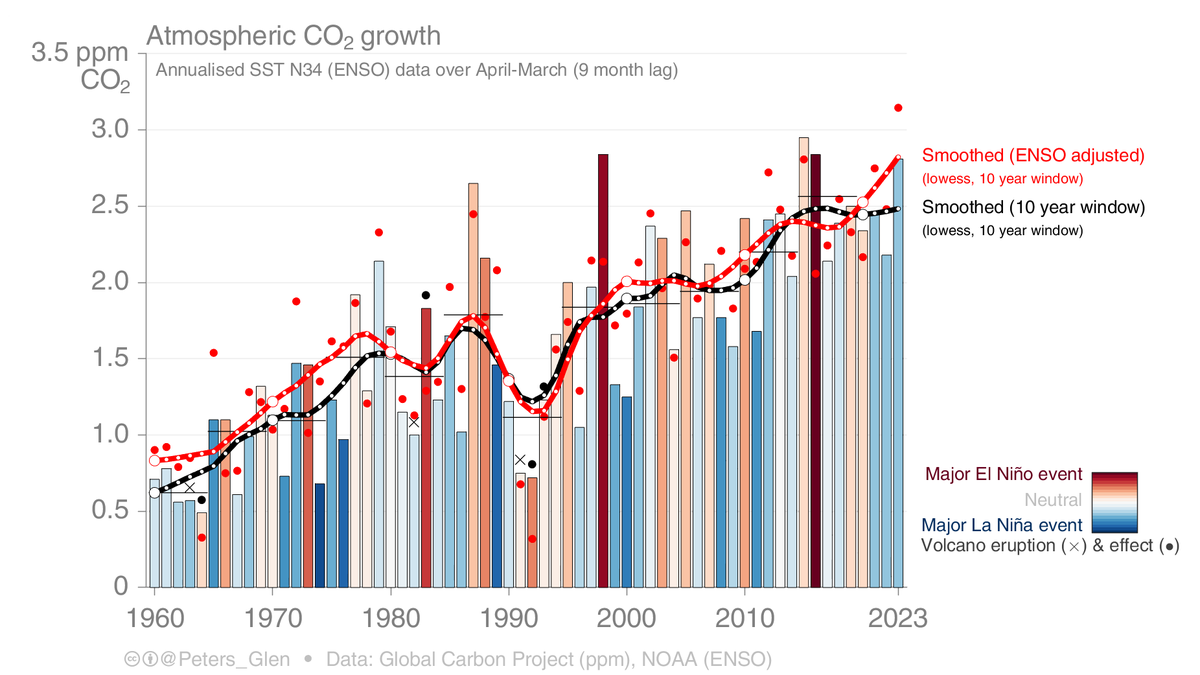
For completeness, here are the figures for the atmospheric growth. The growth rate has slowed down, but whether that is true despite El Nino is a more difficult question.
Sorry for the complex figures, but they have a lot of information!
6/


Sorry for the complex figures, but they have a lot of information!
6/


Normalising the atmospheric, ocean, and land sinks by emissions, shows that 2023 has a weak land sink, but well within the variability range over the last decades.
7/
7/

I am not quite convinced that 2023 has had a collapse in the land sink, out of what could have been expected.
@ciais_philippe, @PFriedling, et al. You think 2023 is a collapse?
/8
@ciais_philippe, @PFriedling, et al. You think 2023 is a collapse?
/8
https://x.com/ciais_philippe/status/1813909550891983318
A final note. If you only consider Mauna Loa, a single site, then the atmospheric growth is more unusual, compared to if you consider the global average. The global average is more meaningful, IMHO.
Though, useful to understand why they differ.
/end
Though, useful to understand why they differ.
/end
https://x.com/Peters_Glen/status/1777593233847058432
unroll @threadreaderapp
• • •
Missing some Tweet in this thread? You can try to
force a refresh


