How have the public reacted to the recent riots?
Only 7% of Britons support the riots, 8% have sympathy for the views of the rioters, and just 12% think the riots are justified
yougov.co.uk/politics/artic…

Only 7% of Britons support the riots, 8% have sympathy for the views of the rioters, and just 12% think the riots are justified
yougov.co.uk/politics/artic…

Reform UK voters are the most likely to have positive opinions of the riots and rioters, although this is still a minority view among these voters
Support the riots
Reform: 21%
Con: 9%
Lab/LD: 1-3%
Have sympathy for the views of the rioters
Reform: 25%
Con: 8%
Lab/LD: 2-4%
Think the riots are justified
Reform: 33%
Con: 16%
Lab/LD: 2-4%
yougov.co.uk/politics/artic…
Support the riots
Reform: 21%
Con: 9%
Lab/LD: 1-3%
Have sympathy for the views of the rioters
Reform: 25%
Con: 8%
Lab/LD: 2-4%
Think the riots are justified
Reform: 33%
Con: 16%
Lab/LD: 2-4%
yougov.co.uk/politics/artic…

The views of those causing unrest at recent protests do not represent the views of most Britons, say the public
Do not represent the views of most Britons: 76%
Do represent the views of most Britons: 12%
yougov.co.uk/politics/artic…
Do not represent the views of most Britons: 76%
Do represent the views of most Britons: 12%
yougov.co.uk/politics/artic…
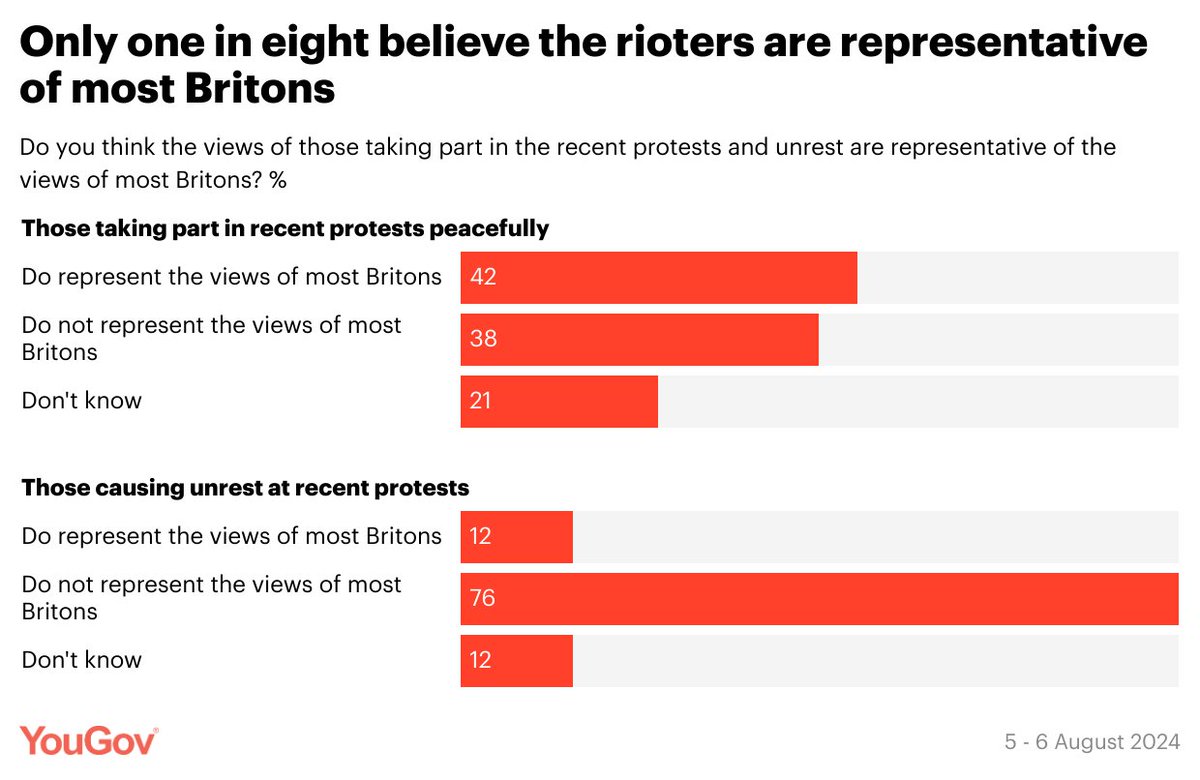
The public are more split on whether the views of those taking part in recent protests peacefully are representative of the wider public
Do represent the views of most Britons: 42%
Do not represent the views of most Britons: 38%
yougov.co.uk/politics/artic…
Do represent the views of most Britons: 42%
Do not represent the views of most Britons: 38%
yougov.co.uk/politics/artic…

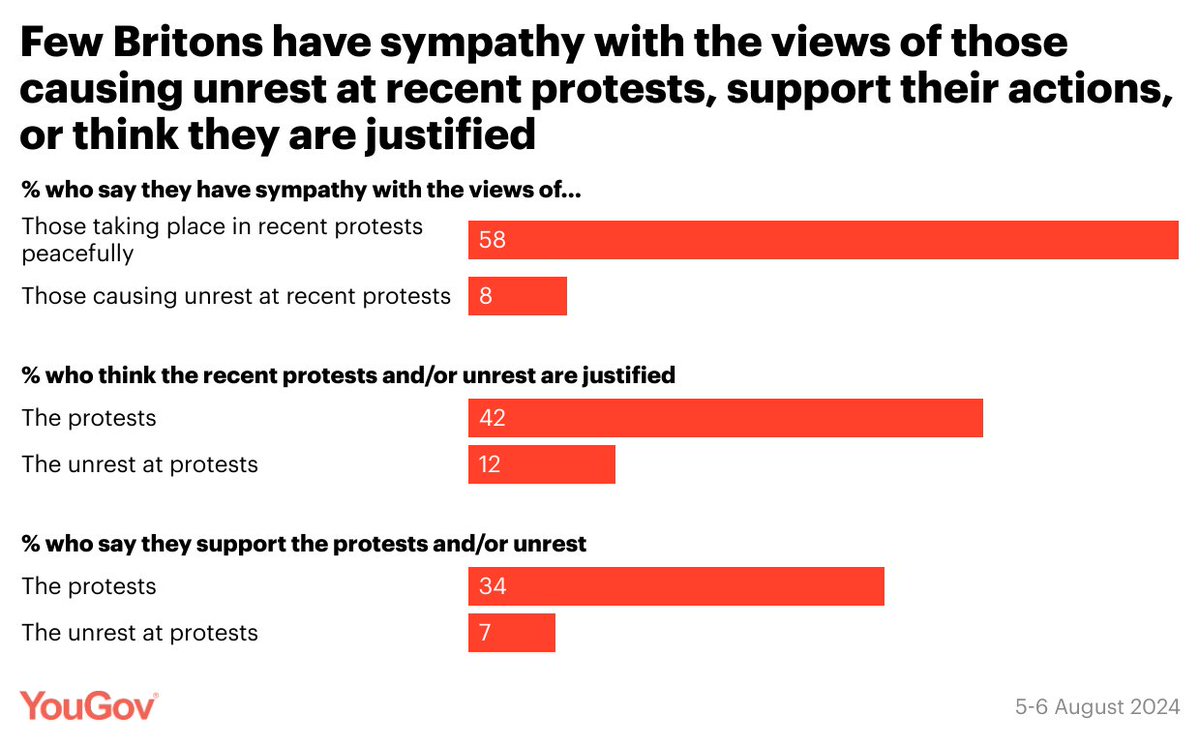
A third (34%) of Britons say they support the (peaceful) protests themselves, 42% think the protests are justified, and 58% say they have sympathy with the views of those taking part
yougov.co.uk/politics/artic…
yougov.co.uk/politics/artic…
What words do Britons think apply to those taking part in the recent riots?
Thugs: 67%
Rioters: 65%
Racist: 58%
Far-right: 52%
Terrorists: 23%
Protestors: 21%
Activists: 21%
People with legitimate concerns: 16%
Patriotic: 9%
Far-left: 7%
yougov.co.uk/politics/artic…
Thugs: 67%
Rioters: 65%
Racist: 58%
Far-right: 52%
Terrorists: 23%
Protestors: 21%
Activists: 21%
People with legitimate concerns: 16%
Patriotic: 9%
Far-left: 7%
yougov.co.uk/politics/artic…

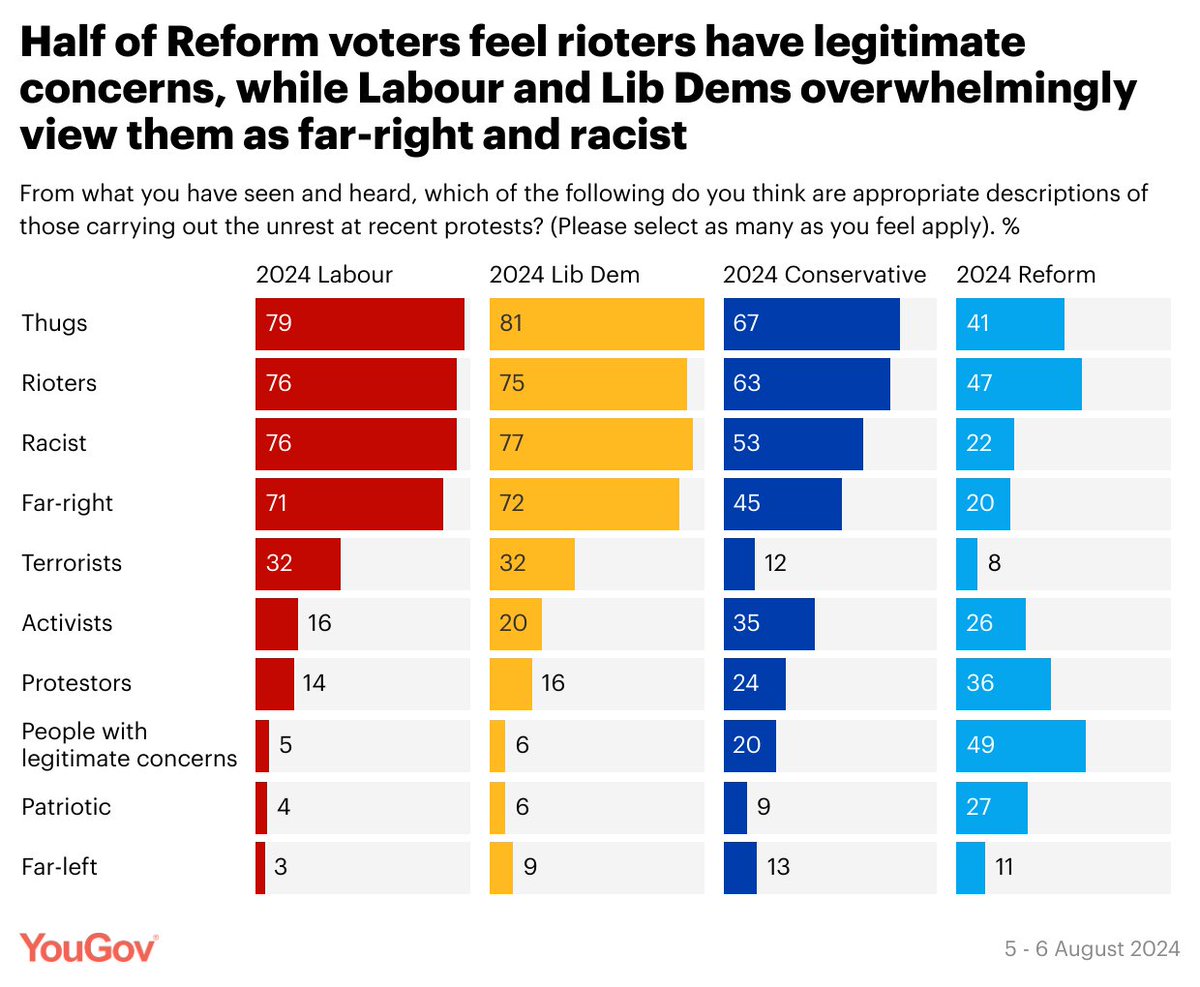
The word Labour, Lib Dem, and Conservative voters are most likely to use to describe the rioters is “thugs” (67-81%)
The term Reform UK voters are most likely to use to describe the rioters is “people with legitimate concerns” (49%)
yougov.co.uk/politics/artic…
The term Reform UK voters are most likely to use to describe the rioters is “people with legitimate concerns” (49%)
yougov.co.uk/politics/artic…
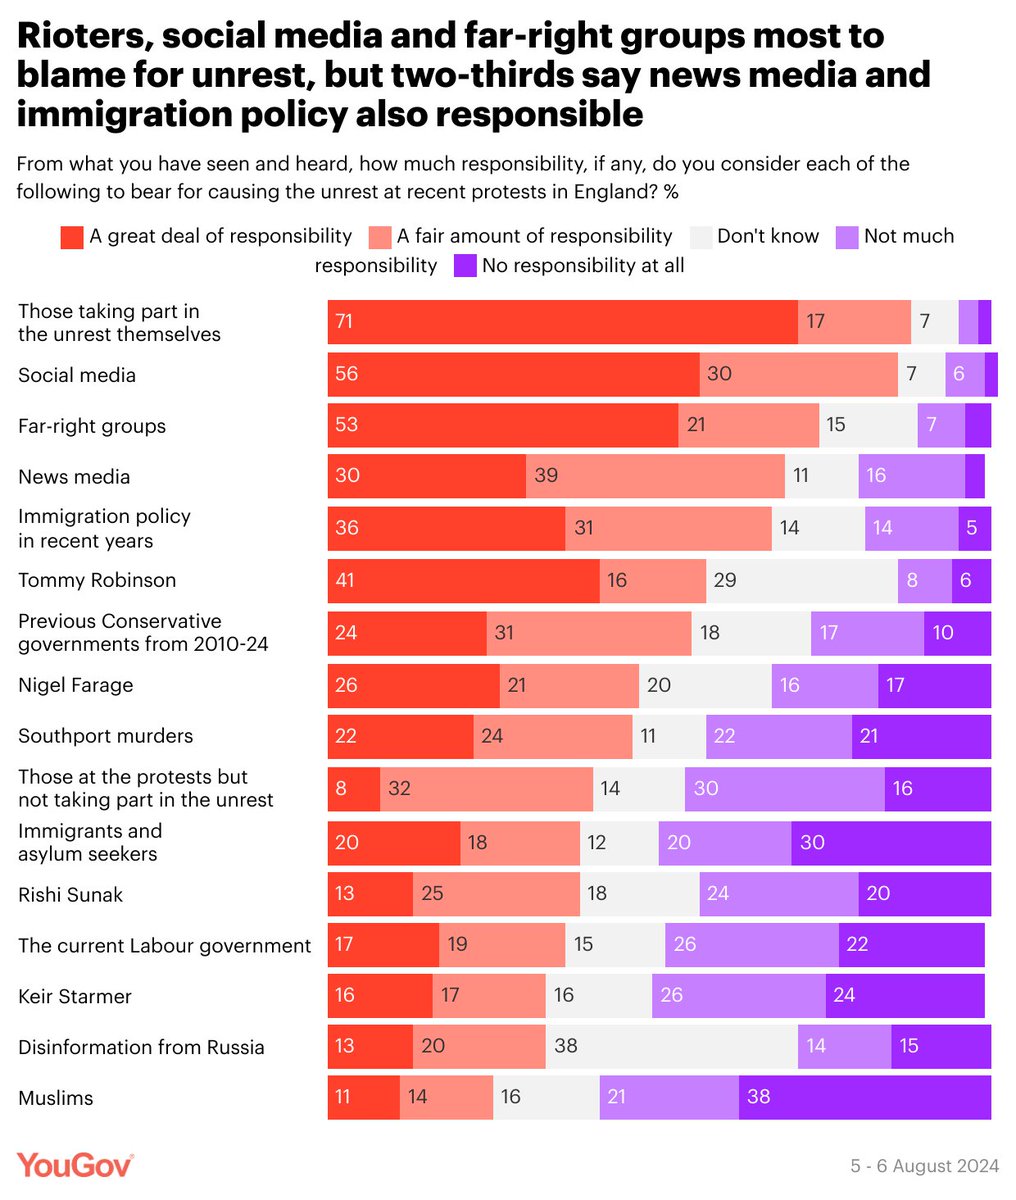
Who and what do Britons think are responsible for the riots?
% saying each have a great deal/fair amount of responsibility
The rioters: 88%
Social media: 86%
Far-right groups: 74%
News media: 69%
Immigration policy in recent years: 67%
Tommy Robinson: 57%
Tory governments from 2010-24: 55%
Nigel Farage: 47%
Southport murders: 46%
Those at the protests but not taking part in the unrest: 40%
Immigrants and asylum seekers: 38%
Rishi Sunak: 38%
Current Labour government: 36%
Keir Starmer: 33%
Disinformation from Russia: 33%
Muslims: 25%
yougov.co.uk/politics/artic…
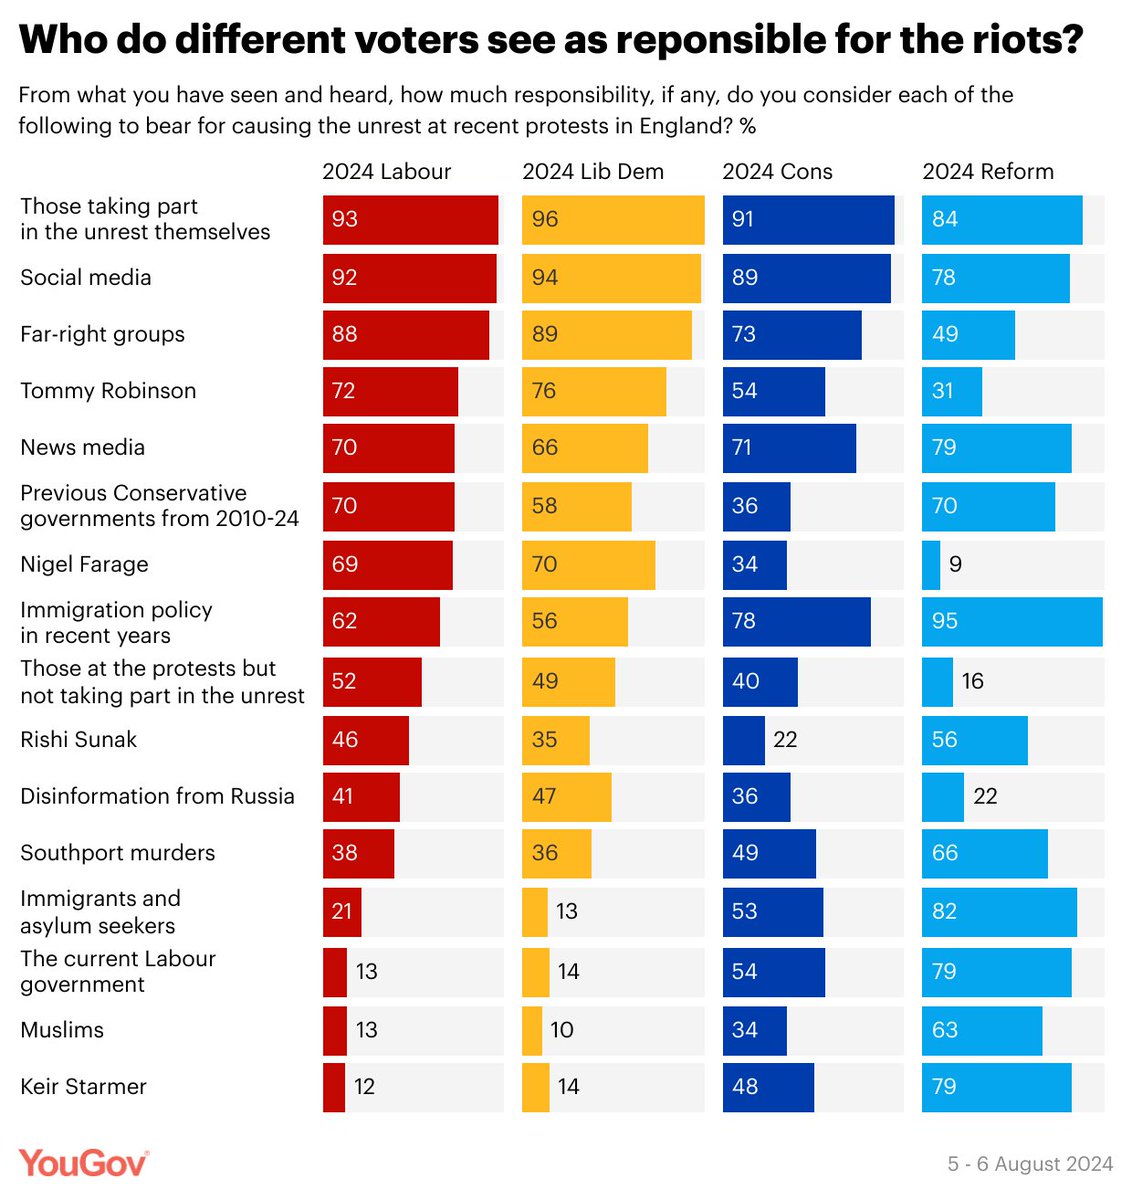
Voters have differing views on who and what is most responsible for the recent riots. Here are the top 5 for the main parties
Reform UK voters
1. Immigration policy: 95%
2. Rioters: 84%
3. Immigrants and asylum seekers: 82%
=4. News media: 79%
=4. Current Labour government: 79%
=4. Keir Starmer: 79%
Labour voters
1. Rioters: 93%
2. Social media: 92%
3. Far-right groups: 88%
4. Tommy Robinson: 72%
=5. News media: 70%
=5. Tory govts 2010-24: 70%
Conservative voters
1. Rioters: 91%
2. Social media: 89%
3. Immigration policy: 78%
4. Far-right groups: 73%
5. News media: 71%
Lib Dem voters
1. Rioters: 96%
2. Social media: 94%
3. Far-right groups: 89%
4. Tommy Robinson: 76%
5. Nigel Farage: 70%
yougov.co.uk/politics/artic…
• • •
Missing some Tweet in this thread? You can try to
force a refresh