32-1/ COVID update for epidemiological weeks 31-32 of 2024.
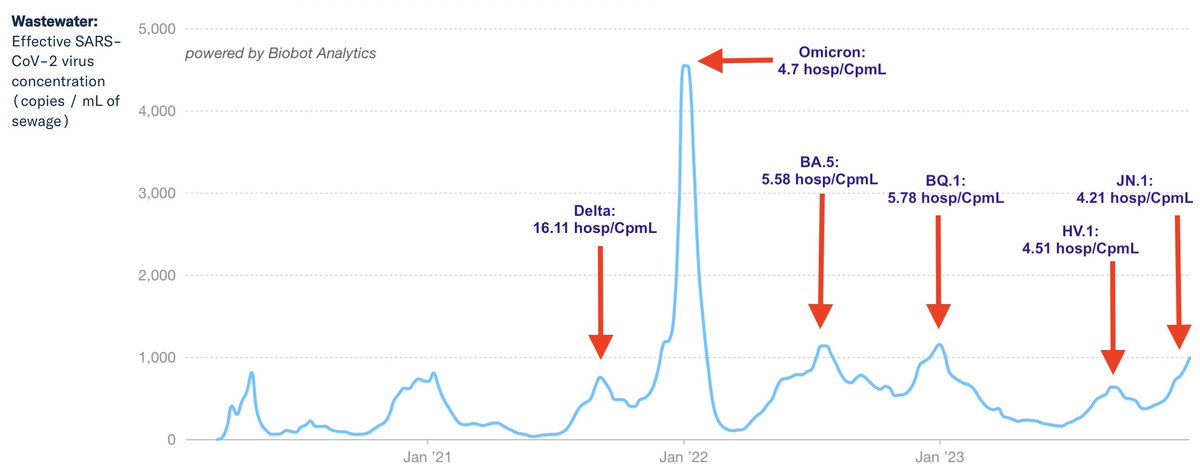
Both Biobot and CDC wastewater numbers indicate the current wave is still on the rise, but looking at some cities it seems to have passed its peak (next slide)...
Both Biobot and CDC wastewater numbers indicate the current wave is still on the rise, but looking at some cities it seems to have passed its peak (next slide)...

32-2/ For instance, NYC's (Manhattan's) wave started late, showed a sharp upward trend, and now it's dropping off quickly. Boston's wave started earlier, and was less pronounced, but it's dropping off...


32-3/ LA's wastewater numbers seem to be rising still, but SF and San Jose (Santa Clara Co) seem to be on the downhill side of this wave. And the current wave seems to have mostly bypassed Oakland and Berkeley. Go figure. Or maybe it hasn't hit them yet?


33-4/ Of course, the overall US infection rate is still high, but what's interesting to me about the current KP.x wave is that localities are out of step with each other. I miss the CDC's county hospitalization rate map which helped us visualize where the hotspots were.
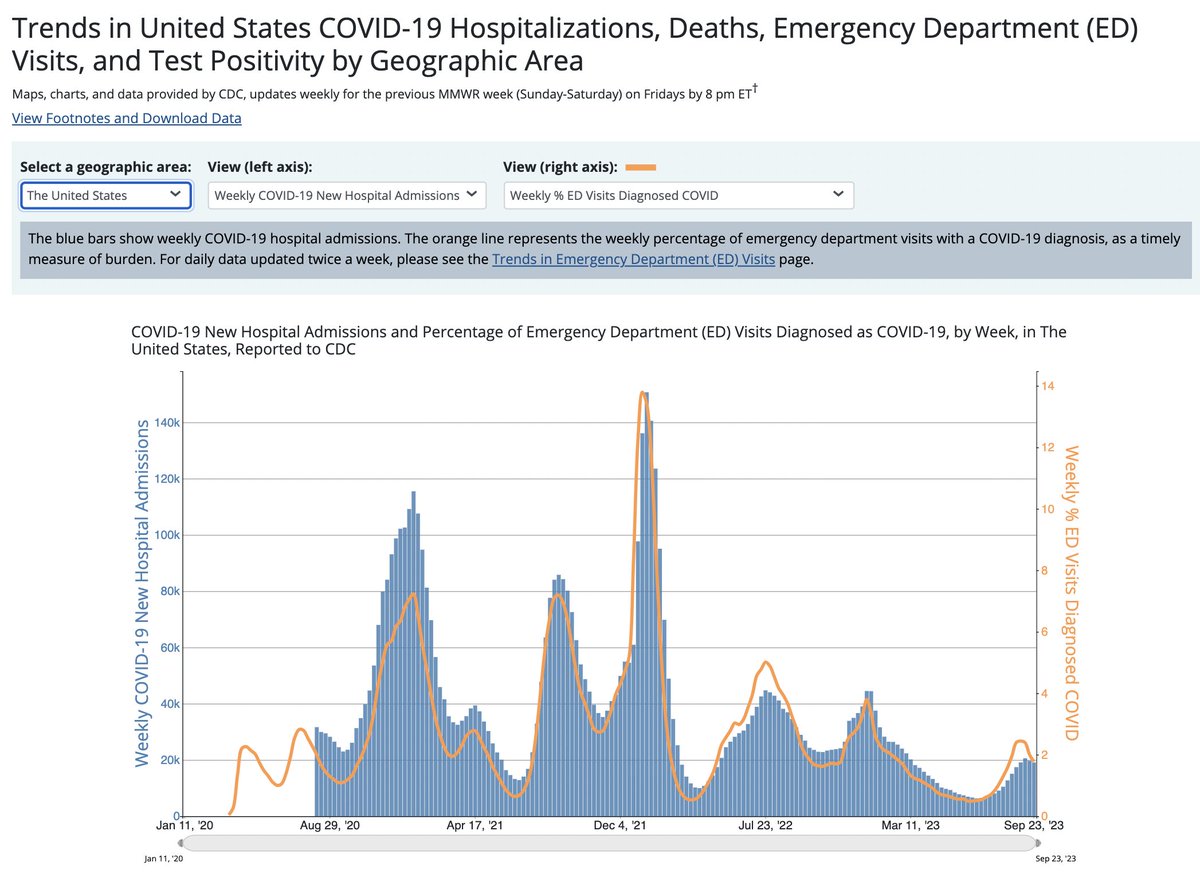
33-5/ Hospitalization rates are at 3.3 per 100,000. This is the lowest for any wave so far. They may rise a bit, but they'd have to more than double to reach the previous high water mark. I doubt that's going to happen.

33-6/ And notice that the CDC still tracks COVID by respiratory season, even though the CDC has admitted (without fanfare) that COVID doesn't follow a seasonal cycle.
tinyurl.com/yzu9hmjm
tinyurl.com/yzu9hmjm
33-7/ There were predictions that COVID would become a seasonal virus. So far it hasn't, and I doubt that it will. Notice that experts quoted in this CNN story from 2021 only looked at North America—and they overlooked the same waves hit the S. Hemisphere… tinyurl.com/4tzahw2p

32-8/ Explanations for why it hasn't become seasonal seem to boil down to two arguments: (1) it has a high mutation rate, and (2) it's highly transmissible. I'm not convinced the first explains its aseasonal behavior, though—because...
32-9/ ...human influenza viruses have higher mutation rates than SARS2. But SARS2 has a much higher reproduction number (R0) than seasonal influenzas. Seasonal flu R0s range from 1.2-1.8. SARS2 Omicron had an est R0 of 8-10. This is second only to measles (R0: 12-18).
32-10/ I could see how the high R0 value of SARS2 could override a seasonal rhythm. But before I dismiss the first explanation completely, I'd be curious what the mutation rates are for other hCoVs (OC43, HKU1, 229E, NL63).
32-11/ Speaking of transmissibility, did the Olympics turn into a superspreader event as some predicted? For attendees, it's hard to say. The French don't seem to have kept up their COVID reporting (if so, I can't find their stats). And for the athletes, it's also hard to say...
32-12/ The Olympics didn't implement universal COVID testing and reporting protocols. So athletes and countries did their own thing. So it's impossible get a clear picture of the infection rate among athletes...
tinyurl.com/z66dfnfk
tinyurl.com/z66dfnfk
32-12/ What surprised me is that at least 3 athletes who tested positive (and were symptomatic) won medals. COVID wasn't able to stop them from winning medals (amazing!). Of course, Noah Lyles had to be carried off the field after he won his bronze...
tinyurl.com/mwdyhwrf
tinyurl.com/mwdyhwrf
32-13/ And it's likely that >80% of the athletes have had COVID at some point (based on N-gene seroprevalence estimates I've seen for US and some Euro countries). So there's no indication that Long COVID is preventing athletes from competing and breaking records.
32-14/ That's it for this update. I'll see you in two weeks. I've got a backlog of links to studies that I want to post. I might do a separate update for those (if I can organize them all). Also, apologies for the numbering error that crept into this thread. /end
@threadreaderapp unroll
• • •
Missing some Tweet in this thread? You can try to
force a refresh