New survey: Over half of researchers in Denmark and an international sample from Britain, America, Croatia, and Austria anonymously admitted that they:
- Cite papers they don't read
- Cite irrelevant papers
- Don't put in effort in peer review
- Misreport nonsignificant findings
In another set of questions, the Danish researchers were asked to report their prevalence of engaging in questionable research practices in recent publications and what they estimated it was across the field.
Unless they undersold their prevalence, they were pessimistic.
When the international sample was asked to do the same thing, they were also pessimistic.
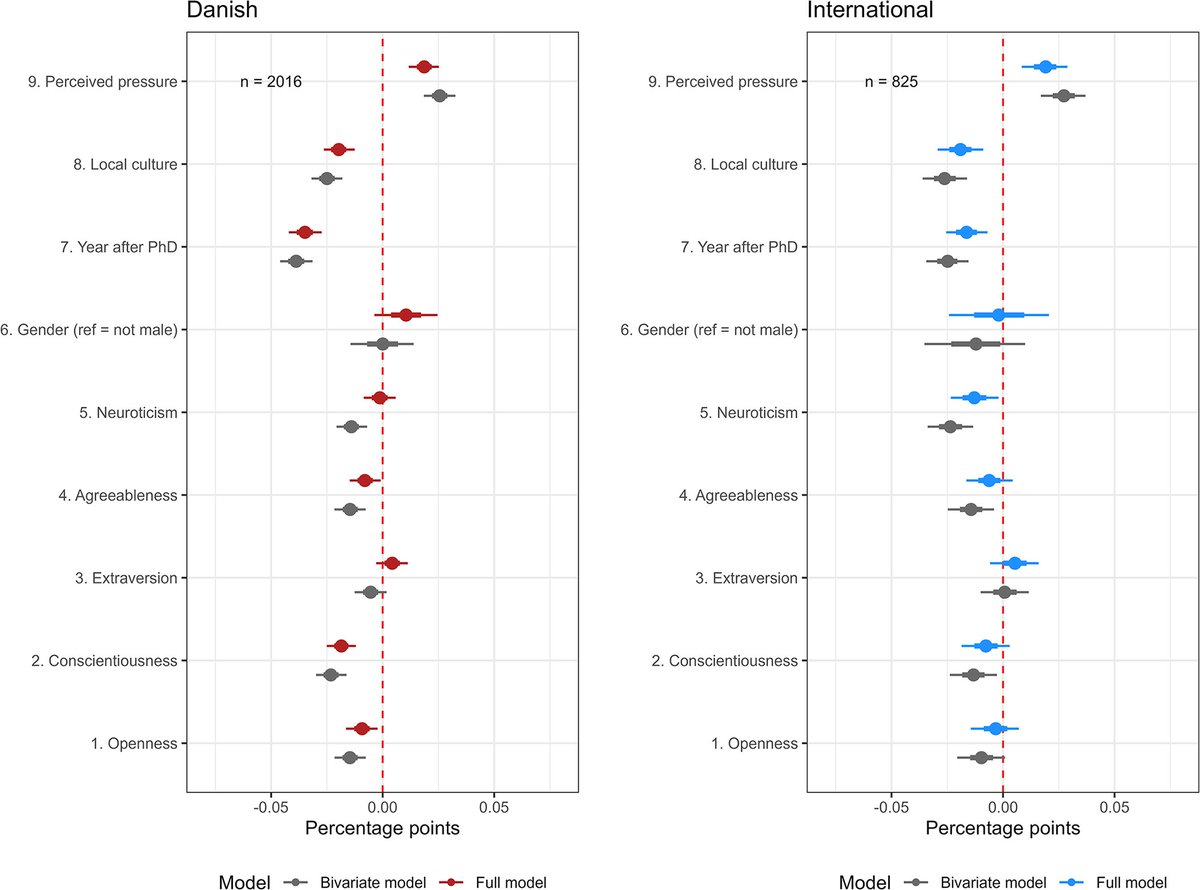
The survey also included a section where they looked at predictors of scientists engaging in questionable research practices (QRPs), and they found that
- Pressure predicts QRPs
- Local culture and career length relate to fewer QRPs
- Not much else?
Overall, in this exclusively Western sample of researchers, QRPs were highly prevalent. Most of the time, the ones that were common were not severe, but they should still be cause for alarm, because they suggest researchers are inattentive.
Researchers also understate the amount of fraud and QRPs they're engaging in, so consider these estimates a lower-bound on the actual level, and the "perceived" estimates as not-quite-as-pessimistic-as-shown.
These are the Baths of Caracalla. Or at least, this is what remains of them today.
These ruins might not look impressive now, but when they were constructed they might have been one of the finest examples of Roman architecture.
But then Europe forgot how to build them🧵
To get an idea of what the Baths looked like in their heyday, look at this rendering.
This palatial compound must have been a sight to behold since the baths rivaled medieval cathedrals like Laon, Notre-Dame, and Salisbury in scale.
To put numbers on it, the bath building itself was 228 meters long, 116 meters wide, and 38.5 meters tall, with capacity for an estimate 1,600 bathers in a complex with 13 hectares of sumptuous decoration.
Here is the geographic distribution of Adolf Hitler's Y-chromosomal haplogroup.
That Hitler had this Y-haplogroup that's relatively uncommon for Germans has prompted some to claim Hitler had Jewish paternal ancestry.
But did he?🧵
Firstly, how do we know this is Hitler's Y-haplogroup?
Illicit journalistic methods. Less politely: stalking.
A pair of Dutch journalists stalked Hitler's living relatives, gathered their DNA without their consent, and sequenced it to figure this out. Here's one example:
What they discovered was that most of the male relatives were E1b1b.
As reported by the company FamilyTreeDNA in 2010, 9% of Germans have this haplogroup, of whom 20% are Jewish.
So given this is Hitler's Y-haplogroup, we're sitting at maybe 20% with no other information.
Some people argue 'Ah, but you didn't split Europe by race. We would see the same picture!'
Nope. We have some European countries split by race (e.g., U.K.) and that's not the case, and notice the subtitle means most non-Europeans are already removed from the equation.
However, this is the case in some other settler nations like New Zealand. Their Whites perform as well as American Whites!
The rates of police-recorded rape incidents in England and Wales, Northern Ireland, and Scotland, have increased over time.
Frankly, I wasn't aware Northern Ireland was this particularly bad until today.
Per an earlier (year-end 2022) report, police-recorded sexual offenses in England and Wales skyrocketed while rape became competitive with sexual assault for the top sexual offense category each year.
The Office of National Statistics suggested a lot of this has to do with changes in police record-keeping (they don't say what that means) and people being more willing to come forward about rape.
They also note many rapes reported during COVID were non-recent (> 12 months old).
Unfortunately for economists, we don't send people to prison randomly, so it's hard to infer what the impacts of incarceration are on long-term socioeconomic outcomes.
How can we?
Through judges and lawmakers being weird!🧵
Data from Ohio was used to estimate the impact of incarceration by using variation in judges' propensities to assign harsher or more lenient sentences.
Since cases were randomly assigned to different judges, we get to clearly see the impact of their conviction habits.
Data from North Carolina was used to estimate the impact of incarceration by leveraging how lawmakers have set up sentencing grids.
These work such that a given crime automatically earns someone a much higher or lower sentence depending on a variety of case characteristics.