I've checked this paper out, as instructed. I was also interested in the main result for personal reasons: I'm 51 years old. Is it true that I've just gone through a major change? And that another one awaits me in just a few years?
Some comments on the paper in this thread 1/🧵
Some comments on the paper in this thread 1/🧵
https://twitter.com/SnyderShot/status/1823814971761025451
The main result about major changes in the mid 40s and 60s is shown in this plot (Fig. 4a). First, I redrew it with axes that start at 0, so the scale of change here was clearer. Not as impressive, but maybe it's a thing? 2/


The authors say that this finding is even corroborated in another study (ref 14). But that's not true. I looked it up, and it shows something totally different (see RHS Fig 3c from ref 14). No change in mid 40s, but a change in the mid 30s, and the real change in the 80s 😕 3/


I'm also including the proteomics plot (from Fig 4d) for a more direct comparison. Again the peaks at 44 and 57 are totally different than the result in ref 14. They are not even qualitatively the same (44 is higher than 57 here vs. the other way around in ref 14). 4/

The method used in both papers is DE-SWAN. The y-axis is the # of significant DE results for a 10:10 comparison across 20 years, then run in a sliding window. That yields the seeming continuity. I leave it as an exercise for the reader to find the issues with this approach. 5/
Furthermore, in Fig. 4 we're talking about only 108 individuals used, where it's different people in different years. Probably numerous confounders & other issues that could lead to the noise that is evident in the plot. Probably why the results btwn the papers are different. 6/
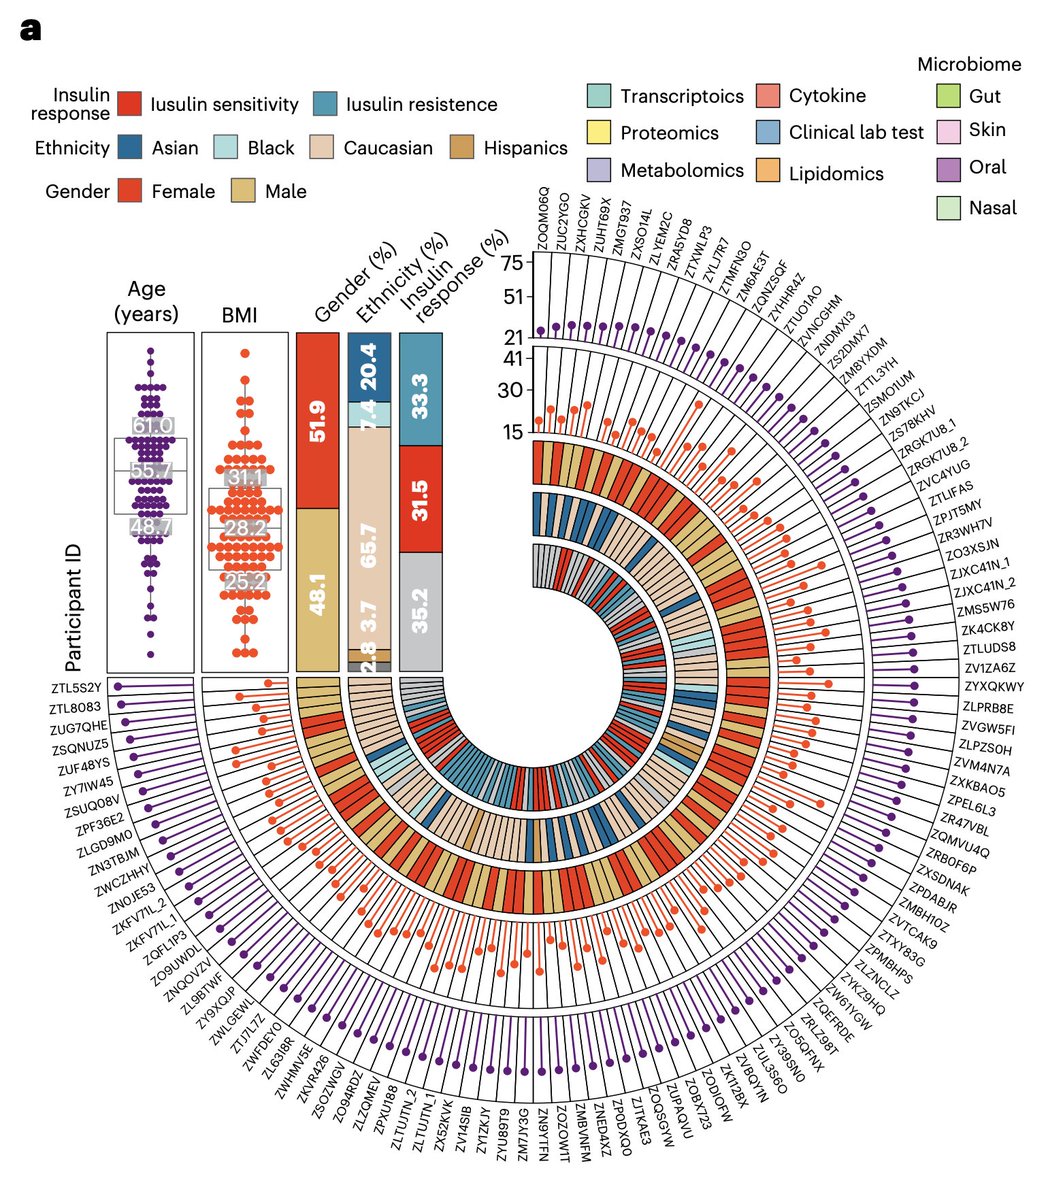
Speaking of the 108 individuals, they're described in Figure 1a.
Note that "Asian", "Black", and "Caucasian" are not ethnicities. They are races. 7/
Note that "Asian", "Black", and "Caucasian" are not ethnicities. They are races. 7/
This is the same issue that the All of Us consortium got wrong.
** an ethnically Hispanic or Latino person can be of any race. **
I don't think it's pedantic to care about this.
8/liorpachter.wordpress.com/2024/02/26/all…
** an ethnically Hispanic or Latino person can be of any race. **
I don't think it's pedantic to care about this.
8/liorpachter.wordpress.com/2024/02/26/all…
When looking at Fig. 1a, I'd already scanned the Methods and Supplement. That's what I do first. I already had a not great prior. Reads were aligned with Tophat. As the main PI behind the development of Tophat, I have something to say about that.. 9/

Actually I already had something to say about it in 2017. Don't use it! 10/
https://x.com/lpachter/status/937055346987712512
There was even an article written about this in @TheScientistLLC. 11/the-scientist.com/scientists-con…
I wanted to know which version of Tophat was used. So I went to look at the Github repo for the paper. Tl;dr, I never found out. 12/github.com/jaspershen-lab…
A minor thing, but the repo structure says there are five directories. There are only 4 (#2, the data, is missing). 13/


Anyway, I thought I'd find the data elsewhere, because the paper says that "both the raw and processed data are also available on the Stanford iPOP site": 14/med.stanford.edu/ipop.html
I was excited to find a link for downloading the RNA-seq data on the site. It's here:
15/hmp2-data.stanford.edu/script.php?tab…
15/hmp2-data.stanford.edu/script.php?tab…
Here's what I got when I clicked on any of the links for the reads. 16/

I stopped reading the paper after staring at Fig. 2a and Extended Data Fig 3 for a while. The metabolomics, cytokine and oral microbiome were brought forth in the paper as having the "strongest association with age". I hope this study didn't cost too much. 17/17


• • •
Missing some Tweet in this thread? You can try to
force a refresh