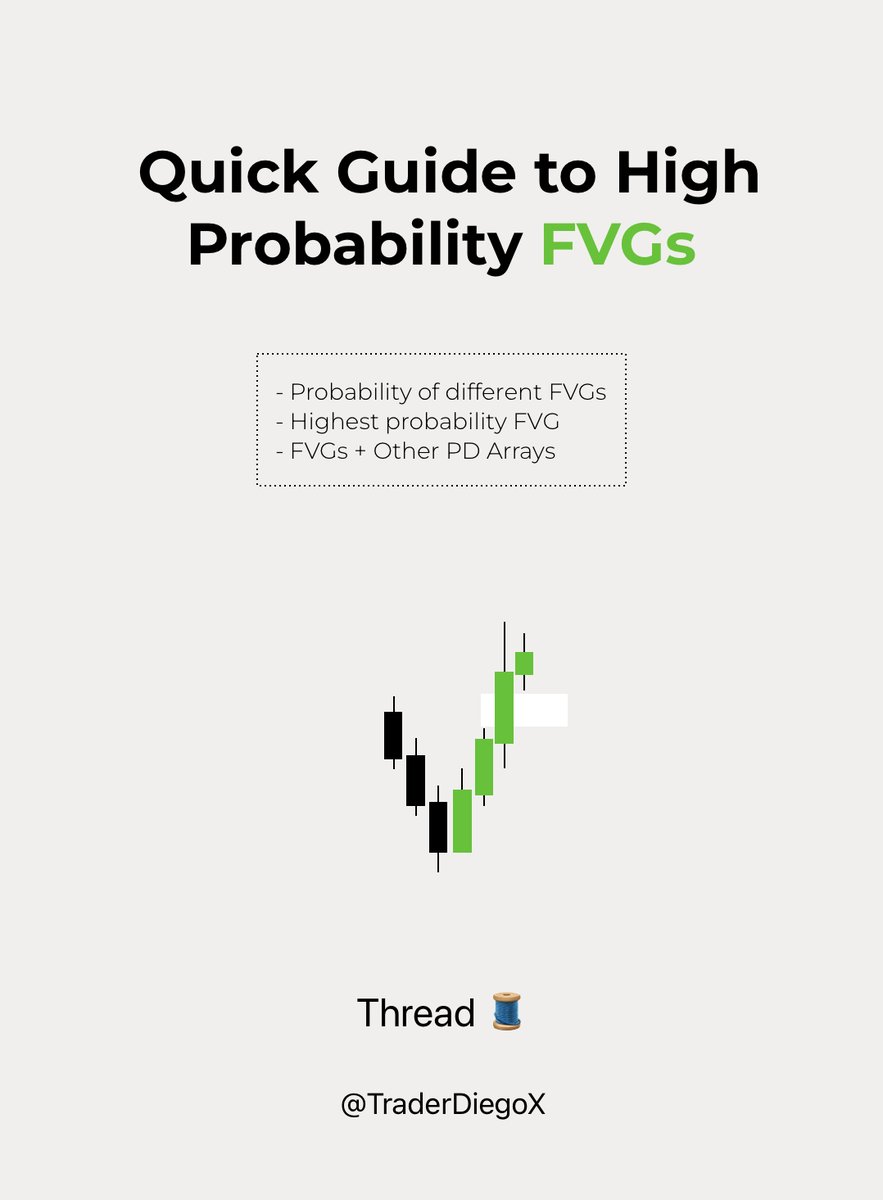
QUICK GUIDE TO HIGH PROBABILITY FVGs
(All Credits to ICT)
Like, Repost, Bookmark🔖
(All Credits to ICT)
Like, Repost, Bookmark🔖
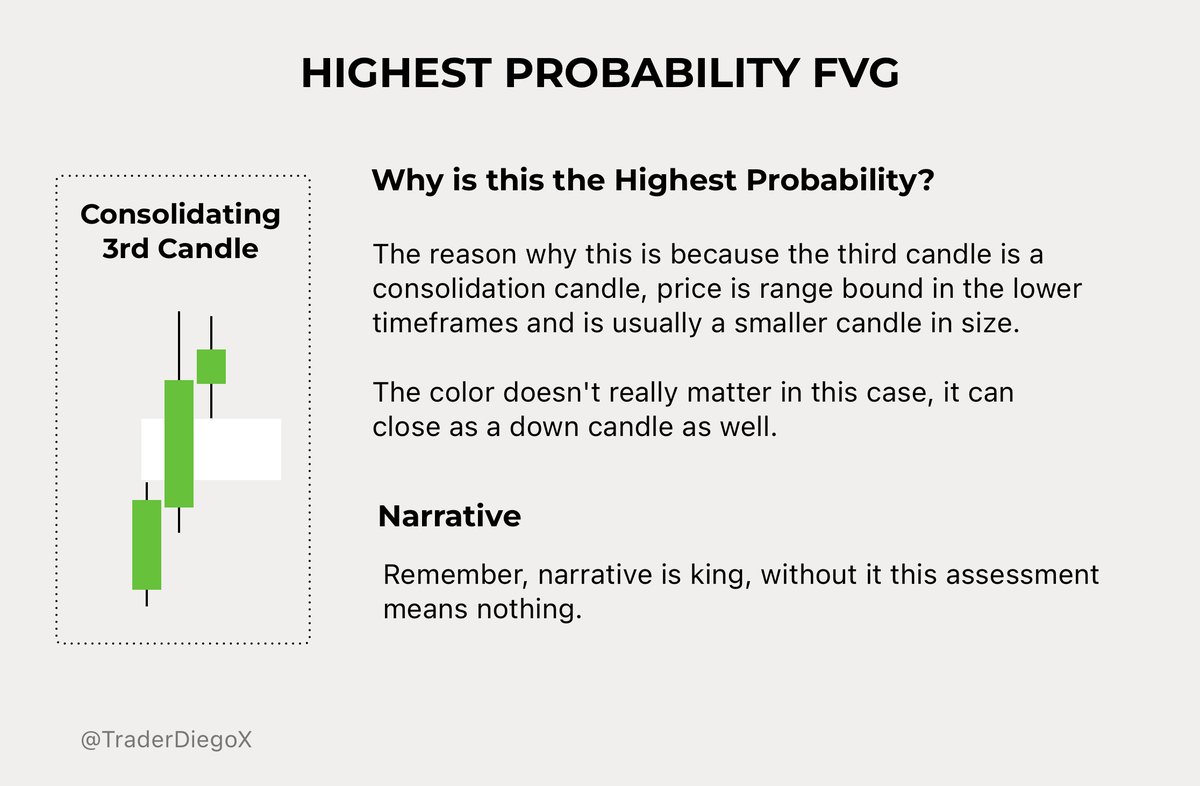
NARRATIVE IS KING:
Read this thread under the assumption that we have narrative on our side and we're currently moving towards a clear draw on liquidity.
These concepts alone are not enough but serve to understand narrative further.
Read this thread under the assumption that we have narrative on our side and we're currently moving towards a clear draw on liquidity.
These concepts alone are not enough but serve to understand narrative further.
THE PROBABILITY OF DIFFERENT FVG
- Not all FVGs are formed in the same way
- The key? It all comes down to the third candle.
All Credits to @arjoio, I first learned this nuances from him.
- Not all FVGs are formed in the same way
- The key? It all comes down to the third candle.
All Credits to @arjoio, I first learned this nuances from him.
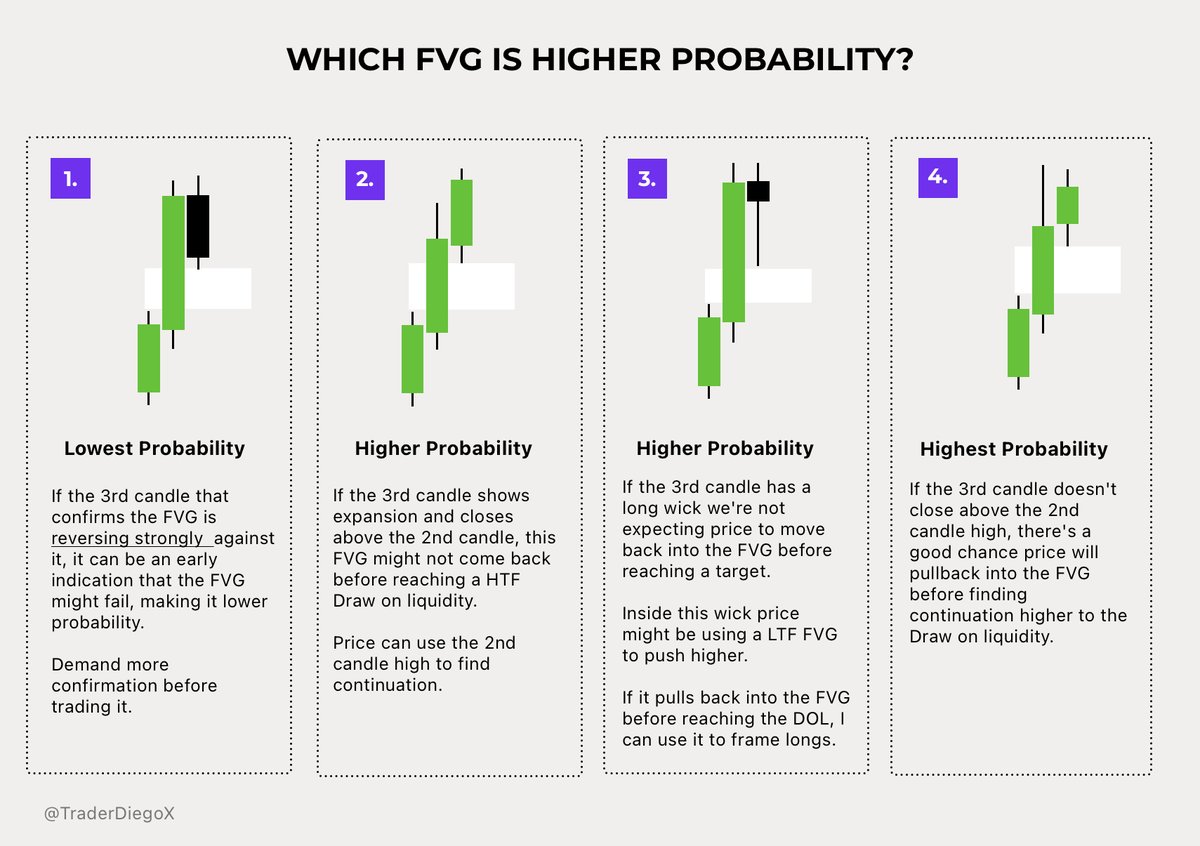
The narrative that lead to the formation of the third candle is key:
- Is the third candle rejecting?
- Is the third candle expanding?
- Is the third candle consolidating?
- Is the third candle rejecting?
- Is the third candle expanding?
- Is the third candle consolidating?
FVGs MAKE OTHER PD ARRAYS HIGHER PROBABILITY
These areas work both as places to frame trades and as magnets of price, they represent Fair Value and are likely to be revisited.
- IFVG + FVG
- Order Block + FVG
- Breaker Block + FVG
- Mitigation Block + FVG
- Swing High/Low + FVG
These areas work both as places to frame trades and as magnets of price, they represent Fair Value and are likely to be revisited.
- IFVG + FVG
- Order Block + FVG
- Breaker Block + FVG
- Mitigation Block + FVG
- Swing High/Low + FVG

• • •
Missing some Tweet in this thread? You can try to
force a refresh