Bravos Research Profile picture
Aug 22, 2024 14 tweets 4 min read Read on X
US gov. debt market collapse has started

This has MASSIVE implications for the economy

A thread 🧵 Image
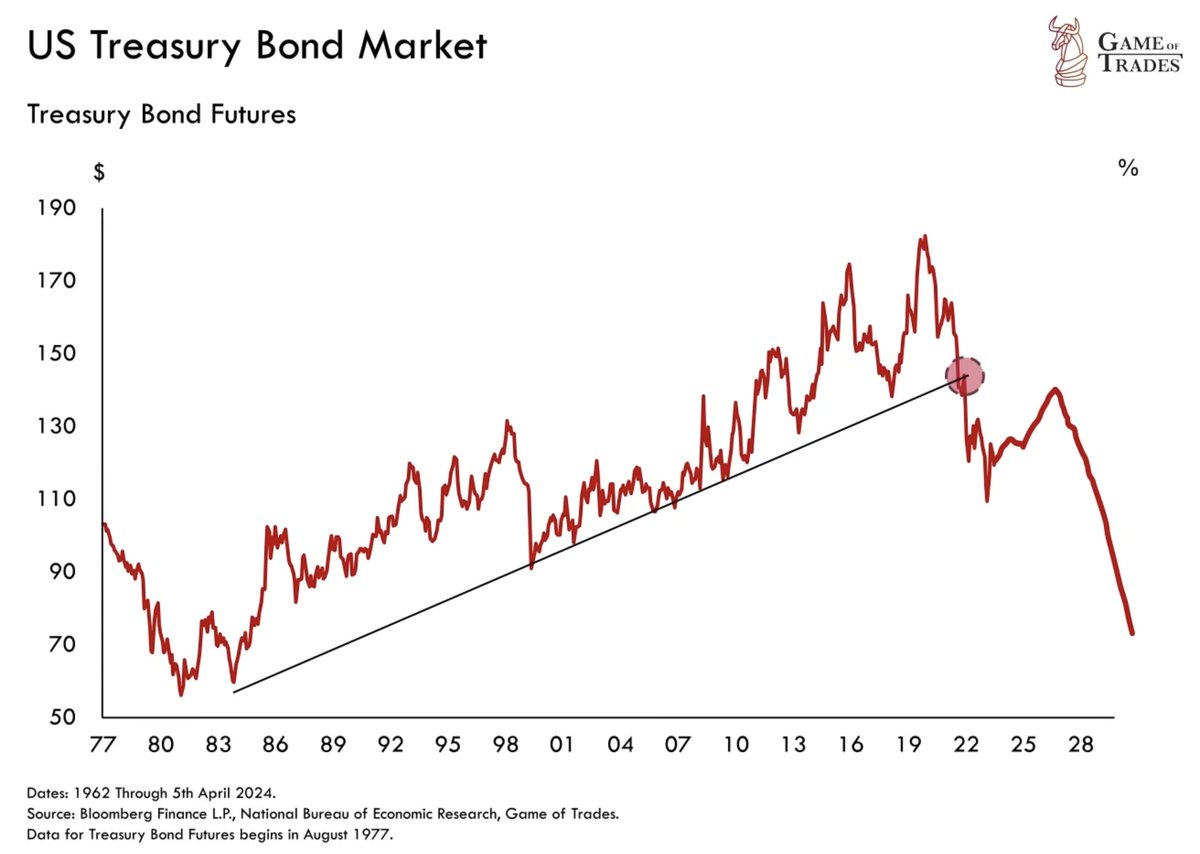
2/ US government bonds have broken below a 40-year uptrend

After experiencing one of the most aggressive bear market since the 1980s Image
3/ Treasury bonds, typically 40% of an investor's portfolio, have led to significant losses because of their sharp decline
4/ Since March 2020, gold has outperformed Treasury bonds by +100% amid surging government spending

Government expenditures have risen from $3.4 trillion to almost $4 trillion in just 2 years Image
5/ Constantly rising government spending, financed by issuing more Treasury bonds, is a BIG problem

This has caused bond prices to drop significantly
6/ Treasury bond issuance in 2024 is expected to hit $1.9 trillion

This level is higher than even the peak of the 2008 Financial Crisis levels Image
7/ Although we expect a bounce in bonds, our long-term outlook on it is bearish

You can find our latest Watchlist and all our Trade Setups with at:

bit.ly/GameofTrades
8/ A key factors that’s driving this long-term breakdown in Treasury bonds is the decline in labor force participation rate

This metric has shown a strong negative correlation to US government debt since 1999 Image
9/ The decreasing labor force participation + increasing government debt indicate economic strain

This is because of more people retiring and fewer people working

The combination has required the government to increase its spending Image
10/ With the aging US population and more people retiring

Labor force participation is likely to decline further

This would increase government debt even more, unless spending changes Image
11/ That’s why Gold has seen a lot of bullishness

Surging +35% since Oct 2023

Our members have already secured a 22% gain on $GDX when we booked partial profits on 23rd May

And continue to hold the rest for more upside Image
12/ You can check all our 2024 closed trades for FREE on our landing page

It's been a solid year for our members with an average win of 16.92% and average loss of just 3.93% Image
13/ Join us now for just $1.45/day to access our real-time Trade Alerts with full details:

- Long/Short position
- Allocation weight
- Entry
- Stop-loss
- Reasoning for the trade

bit.ly/GameofTrades
14/ Thanks for reading!

If you enjoyed this thread, please ❤️ and 🔁 the first tweet below

And follow @gameoftrades_ for more market insights, finance and investment strategies

• • •

Missing some Tweet in this thread? You can try to force a refresh
 

Keep Current with Bravos Research

Bravos Research Profile picture

Stay in touch and get notified when new unrolls are available from this author!

Read all threads

This Thread may be Removed Anytime!

PDF

Twitter may remove this content at anytime! Save it as PDF for later use!

Try unrolling a thread yourself!

how to unroll video
  1. Follow @ThreadReaderApp to mention us!

  2. From a Twitter thread mention us with a keyword "unroll"
@threadreaderapp unroll

Practice here first or read more on our help page!

More from @bravosresearch

Dec 9
Cash on the sidelines has just hit 25% of US GDP

History shows this does NOT end well…

A thread 🧵 Image
2/ This chart shows us the share of total US GDP comprised of cash.

Right now, 25% of the economy, or roughly $7.5 trillion, is invested in money market funds.

This is the money sitting on the sidelines.

That’s the highest level since April 2020, before that January 2009 and October 2001.Image
3/ These dates mark 3 of the biggest economic downturns of the last 20 years.

Coinciding with the 3 largest stock market crashes of the last 20 years.

Once these economic and market crashes ended, the sidelined cash got reinvested back in the markets.

Leading to long periods of economic stability and strong financial markets.Image
Read 24 tweets
Dec 2
The yield curve has now been steepening from an inversion

This has historically been a very reliable recessionary signal

It’s pointing to a MAJOR economic turning point in just 3 months

A thread 🧵 Image
2/ The yield curve has officially begun a countdown that will bring the economy to a major turning point in 3-months.

You see, exactly 1 year ago the yield curve did what we call a steepening.

It came out of one of the longest inversions on record, crossing back above the 0-lineImage
3/ This same pattern showed up in 2020 and was followed by a recession within a year.

It also happened in 2007, 2001, 1989 and even in 1929.

Yet here we are in 2025, a year after the steepening with:

- No NBER-declared recession.
- Stocks near all-time highs.
- Real GDP growth at 2–3%.Image
Read 25 tweets
Nov 24
Michael Burry just revealed 2 MASSIVE short positions tied directly to the AI Bubble

The last time we saw something similar was right before the 2008 Financial Crisis

This won’t end well…

A thread 🧵 Image
2/  This chart compares the euphoria of the 2025 AI boom with the Bitcoin frenzy of 2017 and the housing bubble of 2005 using Google search trends

What stands out are the dates:

August 2005 = housing market downturn

December 2017 = Bitcoin beginning an 80% drawdown Image
3/  Today, interest in the AI boom is already surpassing what we saw in those earlier episodes

Michael Burry, known for shorting the housing market in 2007, has now revealed he’s shorting 2 of the most AI-exposed stocks of 2025

There’s a reason why risk in the AI market has increased substantially

And why we may be close to seeing the first dominoes fallImage
Read 23 tweets
Jul 18
Bitcoin surged 5,000% in 2016, 1,000% in 2020

And crashed 70% in both 2018 and 2022

This 1 Macro signal flashed before all of these moves

A thread 🧵 Image
2/ It’s a force every investor knows exists, but very few actually know how to use

It’s called global liquidity Image
3/ We can track global liquidity using this chart of global M2 money supply

Which reflects the liquidity provided by the world’s 20 largest central banks

Right now, that money supply is breaking out to the highest level ever recorded Image
Read 16 tweets
Jul 16
This is actually happening on Bitcoin

Buckle up.

A thread 🧵 Image
2/ What if I told you there’s 1 macro force that’s appeared before every major move Bitcoin has made over the last decade?

It showed up before Bitcoin’s 5,000% rally in 2016–2017

Before the 1,000% surge in 2020–2021

And right before the 70% crashes in 2018 and 2022 Image
3/ It’s a force every investor knows exists, but very few actually know how to use

It’s called global liquidity

And believe it or not, it’s flashing another major signal right now that could tell us where Bitcoin is headed by August of this year Image
Read 31 tweets
Jul 11
US stock market has rallied +25% in just 60 trading days

This has only happened 8 times since the 1970s

Here’s what typically happens next

A thread 🧵 Image
2/ We just sold most of our US stock market exposure on our website

The S&P 500 is at all-time highs after a spectacular melt-up

We've been holding multiple tech and industrial trades over the last few months

But we've now sent out sell alerts to all of our clients Image
3/ We're making this move because we believe a major opportunity is coming in the next month

And we want to be ready to take advantage of it

Also, this is your last chance to use our 4th of July 30% DISCOUNT

Only a few hours left before it expires Image
Read 28 tweets

Did Thread Reader help you today?

Support us! We are indie developers!


This site is made by just two indie developers on a laptop doing marketing, support and development! Read more about the story.

Become a Premium Member ($3/month or $30/year) and get exclusive features!

Become Premium

Don't want to be a Premium member but still want to support us?

Make a small donation by buying us coffee ($5) or help with server cost ($10)

Donate via Paypal

Or Donate anonymously using crypto!

Ethereum

0xfe58350B80634f60Fa6Dc149a72b4DFbc17D341E copy

Bitcoin

3ATGMxNzCUFzxpMCHL5sWSt4DVtS8UqXpi copy

Thank you for your support!

Follow Us!

:(