In this THREAD I will explain “How to trade Liquidity”
1. What is a “Liquidation Heatmap”
2. How to TRADE using Heatmaps
3. Pools of Liquidity
4. Backtesting Liquidity
🧵(1/11)
1. What is a “Liquidation Heatmap”
2. How to TRADE using Heatmaps
3. Pools of Liquidity
4. Backtesting Liquidity
🧵(1/11)

1. What is a “Liquidation Heatmap”
The Liquidation Heatmap calculates the liquidation levels, based on market data and different leverage positions.
As more estimated liquidation levels are added to a certain price, the color of the heatmap changes
The Liquidation Heatmap calculates the liquidation levels, based on market data and different leverage positions.
As more estimated liquidation levels are added to a certain price, the color of the heatmap changes
1.2 What is a “Liquidation Heatmap”
The areas of greatest liquidity within the market are represented with a heatmap.
Functions as a magnet for the price.
The liquidity that has already ENTERED the market, is the one represented on Liquidation Pools
The areas of greatest liquidity within the market are represented with a heatmap.
Functions as a magnet for the price.
The liquidity that has already ENTERED the market, is the one represented on Liquidation Pools
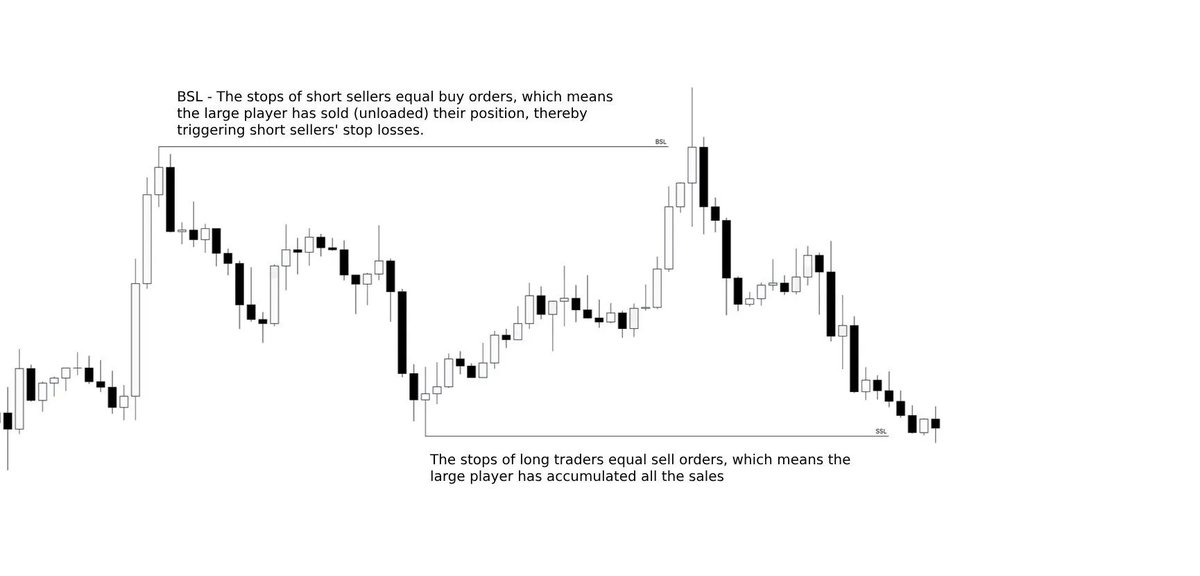
2. How to TRADE using “Heatmaps”
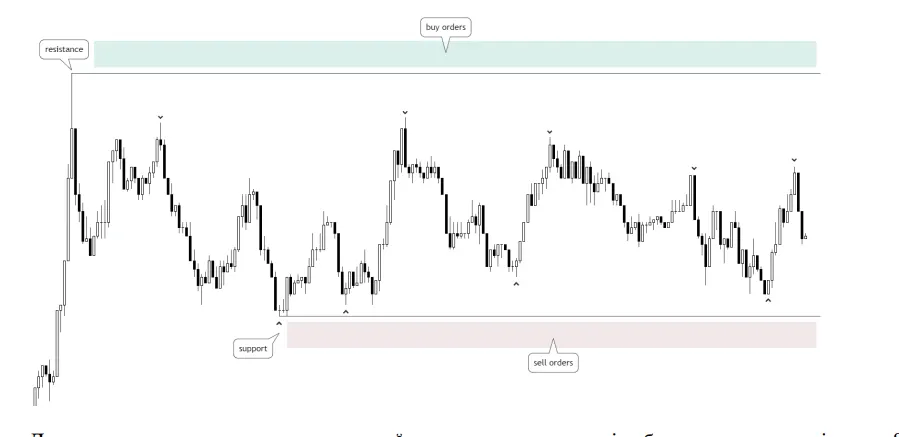
- Identify the pools of liquidity on the market structure
- Execute your trades when the price enters on those bubbles of liquidity
- Use this levels as stop loss/ invalidation
- Identify the pools of liquidity on the market structure
- Execute your trades when the price enters on those bubbles of liquidity
- Use this levels as stop loss/ invalidation
2.2 How to TRADE using “Heatmaps”
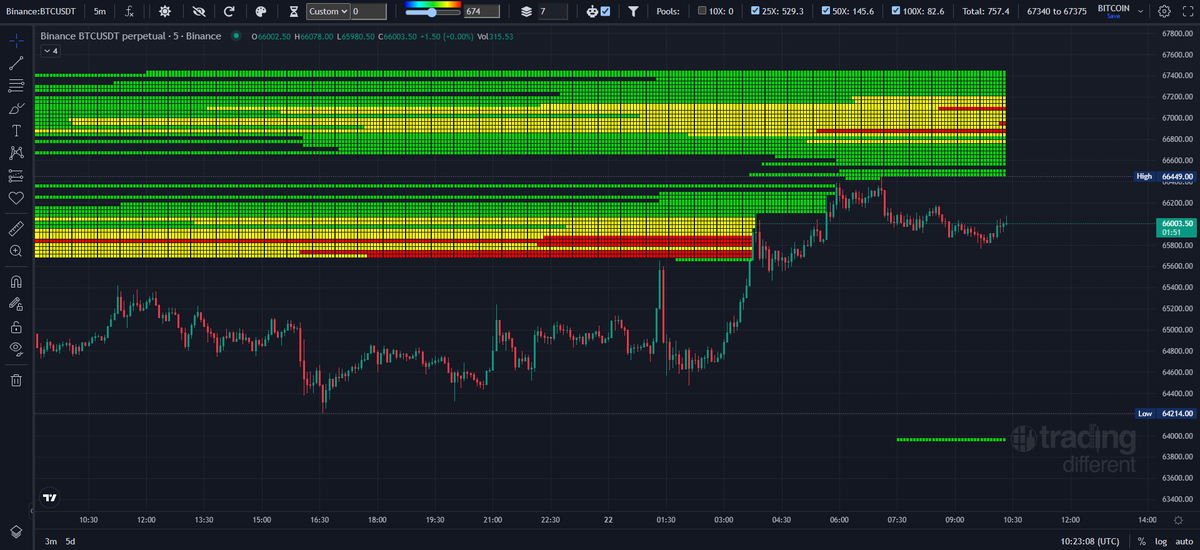
After Bitcoin sweeps the liquidity of leveraged traders by 25x, 50x and 100x, bounces at the end of the pool.
This bounce is accompanied with aggressive HF buying activity.
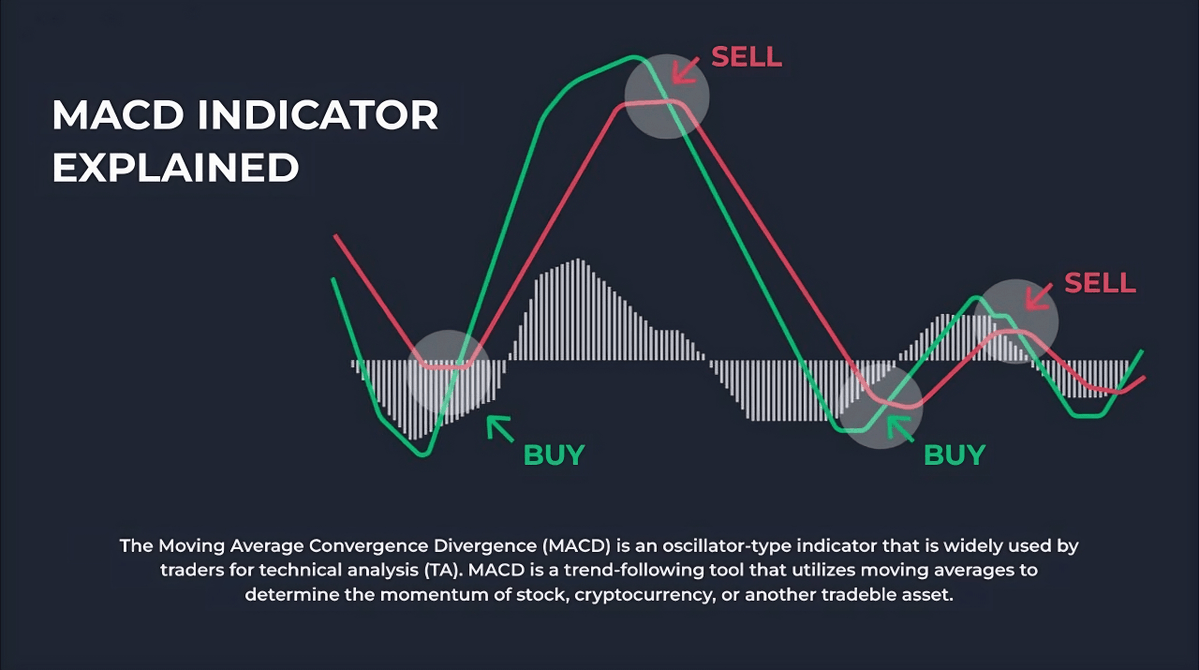
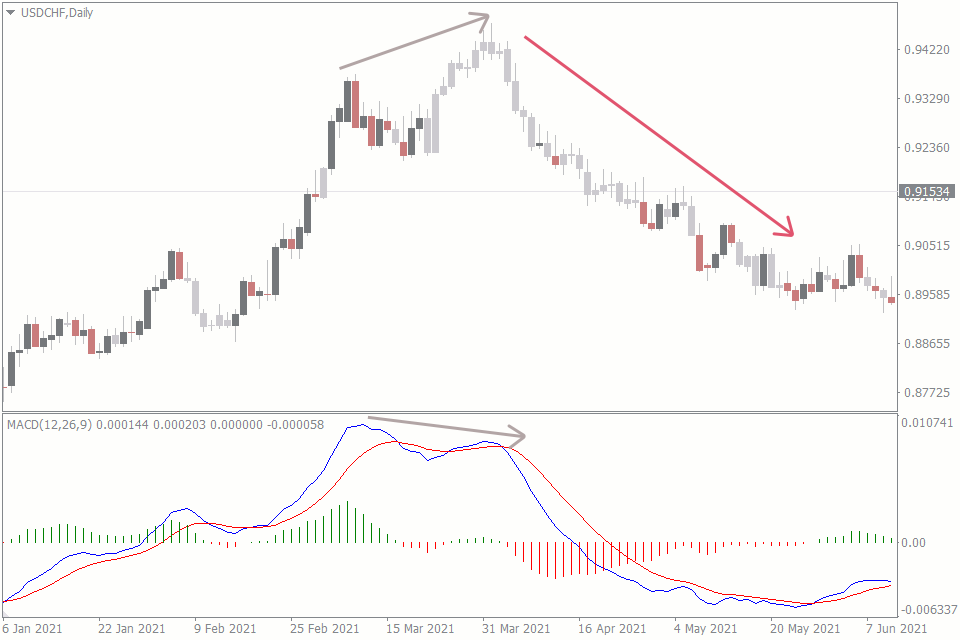
Use Indicators as confluence with Heatmaps
After Bitcoin sweeps the liquidity of leveraged traders by 25x, 50x and 100x, bounces at the end of the pool.
This bounce is accompanied with aggressive HF buying activity.
Use Indicators as confluence with Heatmaps
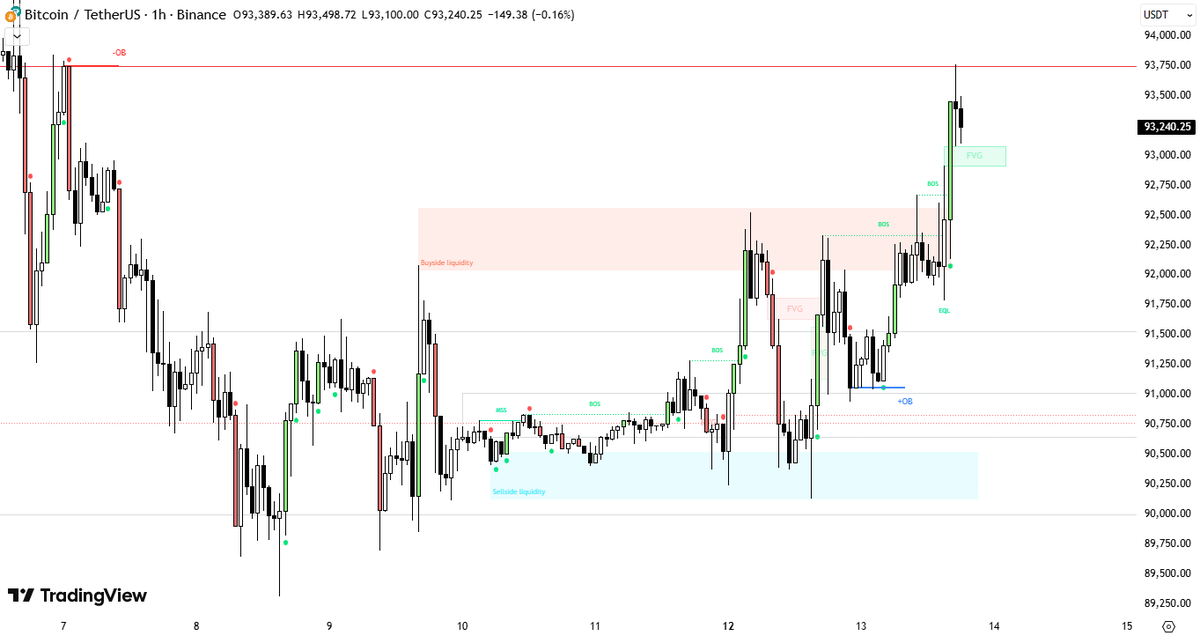
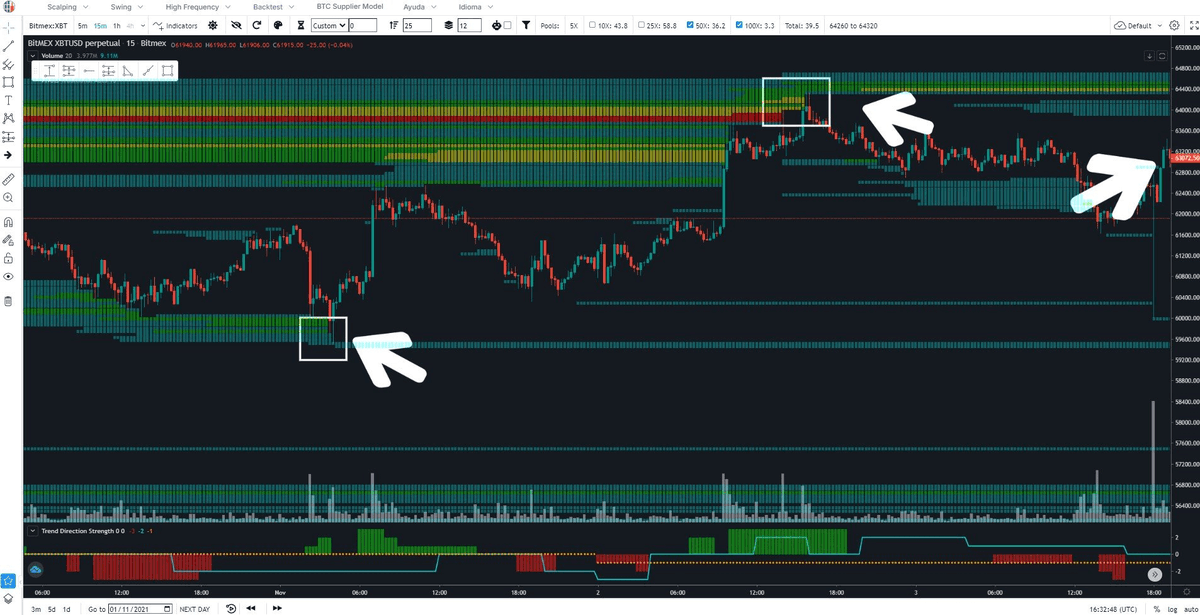
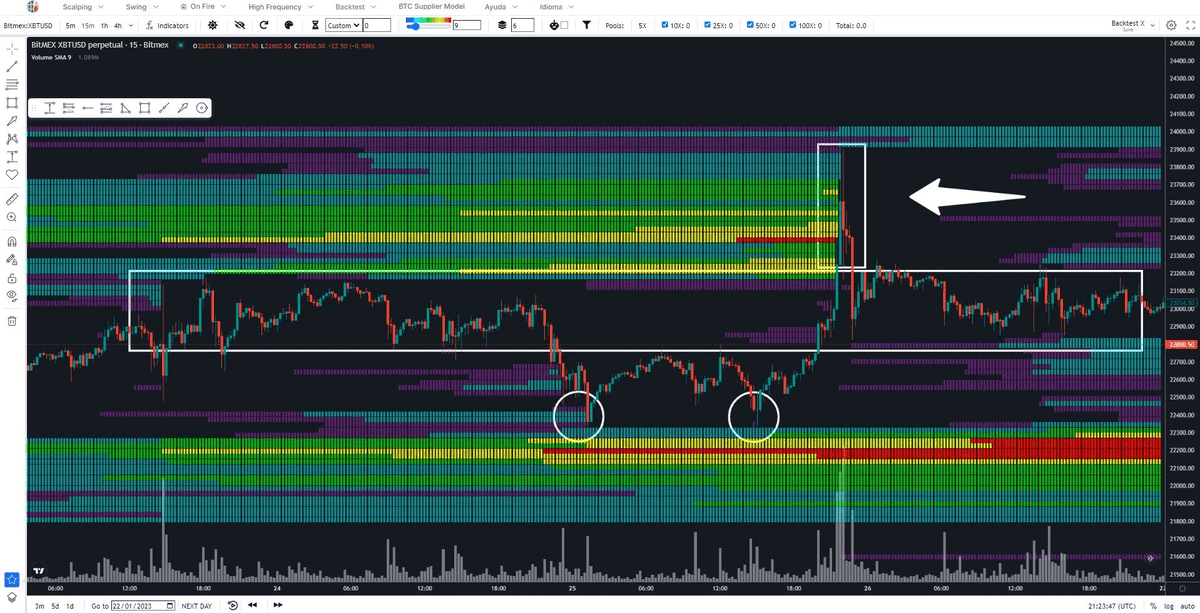
2.3 How to TRADE using “Heatmaps”
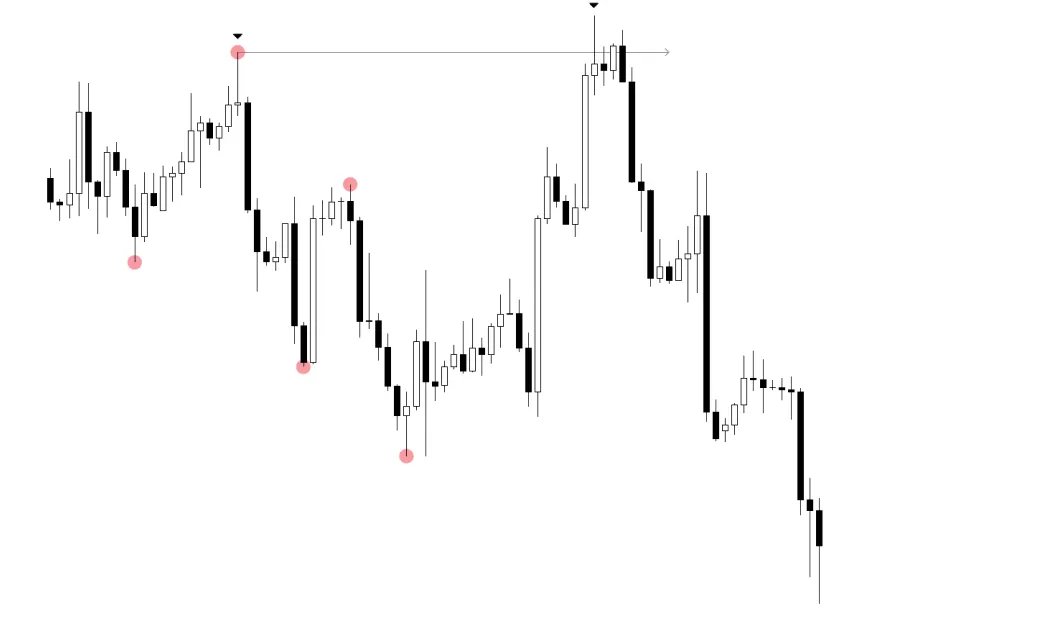
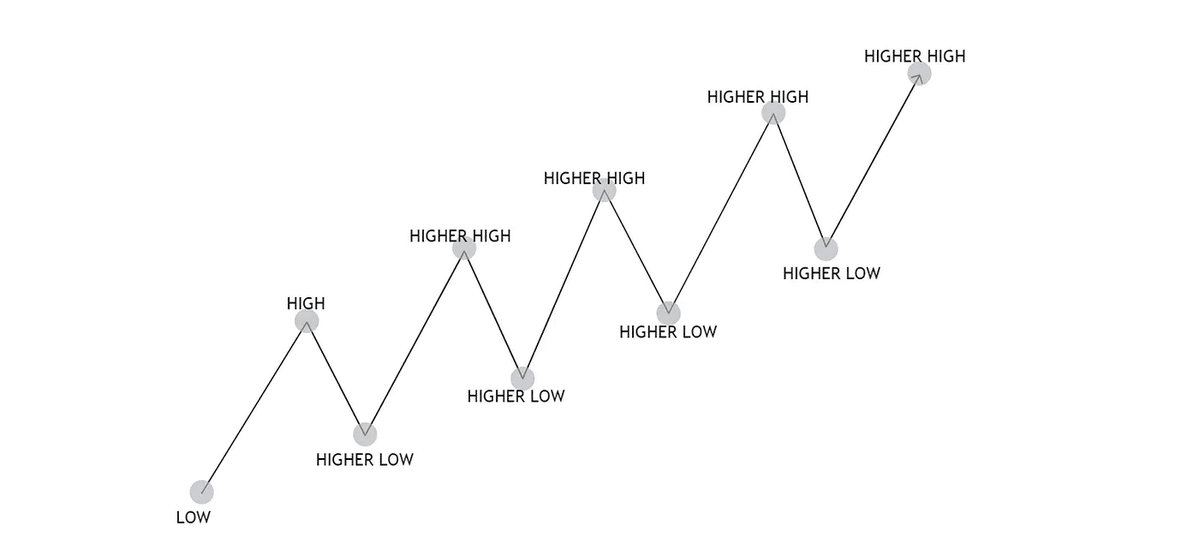
- Take LONG positions in the price action of the first box.
Took liquidity + buying pressure
- Take SHORT positions in the price action of the second box.
Highs are taken. When prior high to the HH is lost, take a short position.
- Take LONG positions in the price action of the first box.
Took liquidity + buying pressure
- Take SHORT positions in the price action of the second box.
Highs are taken. When prior high to the HH is lost, take a short position.
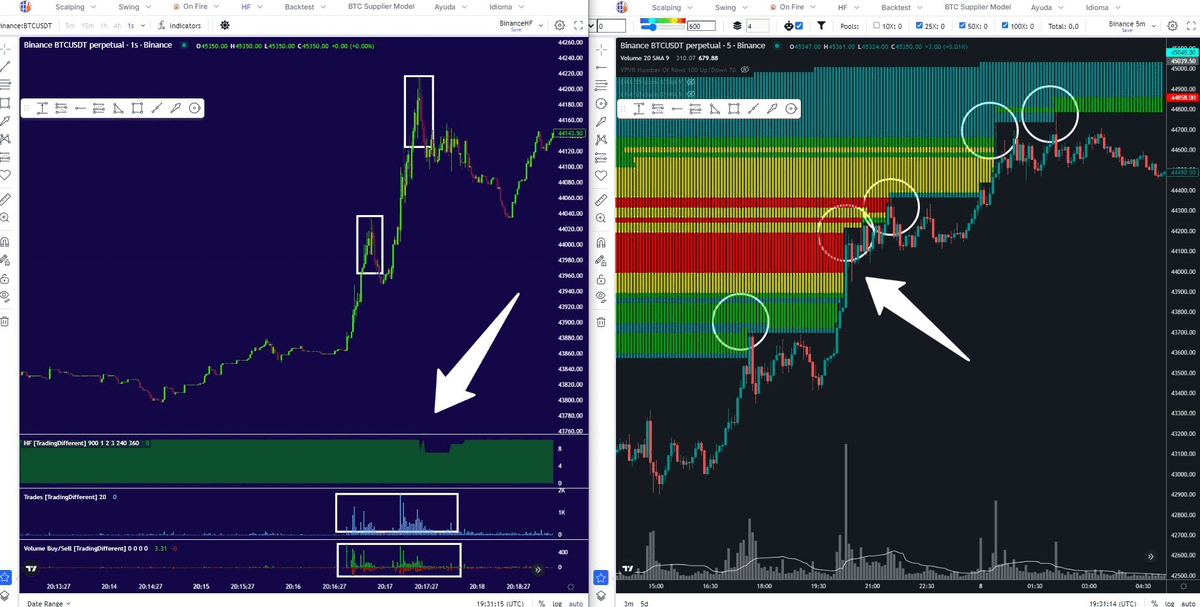
2.4 How to TRADE using “Heatmaps”
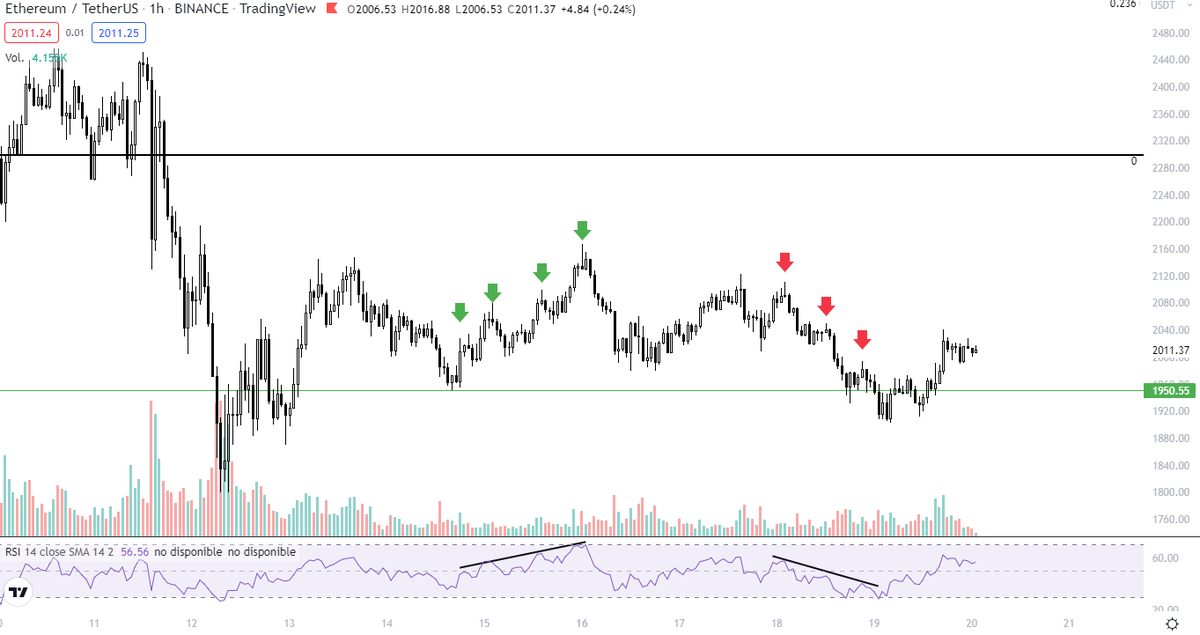
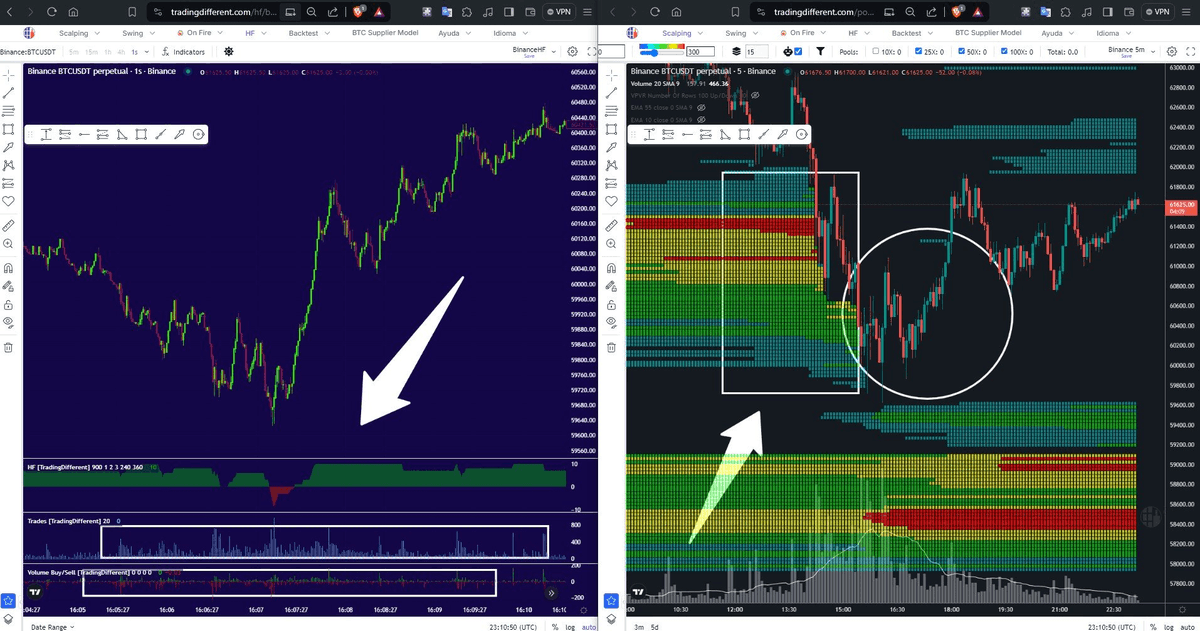
I’m using High Frequency tool.
There’s intention to take $BTC towards the upper zone, as you can see in the indicator.
Thousands of trades are taken per second. This Increases the probability of sweeping almost the entire pool
I’m using High Frequency tool.
There’s intention to take $BTC towards the upper zone, as you can see in the indicator.
Thousands of trades are taken per second. This Increases the probability of sweeping almost the entire pool
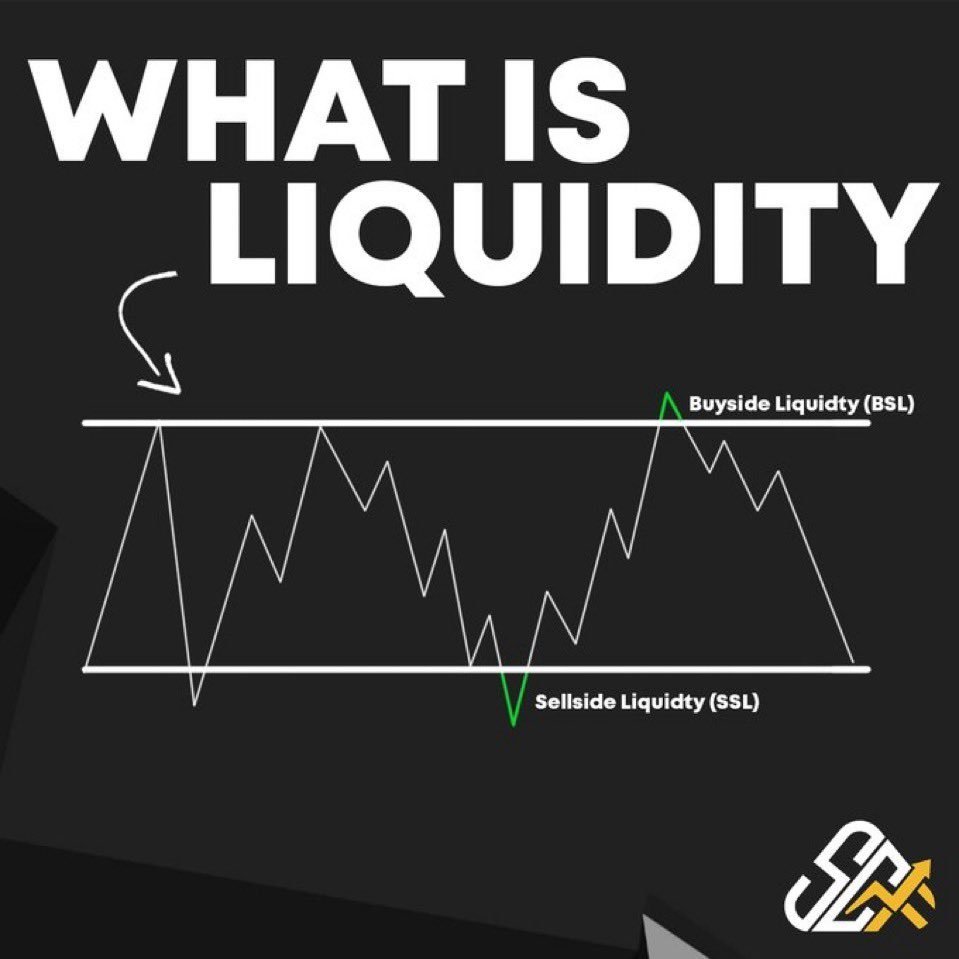
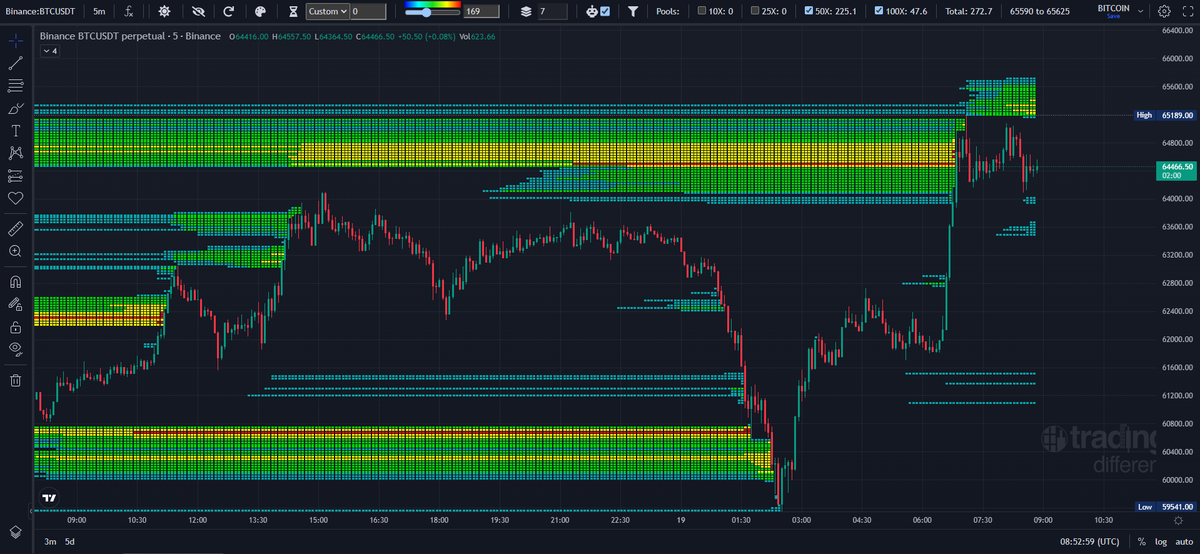
3. Pools of Liquidity
This movement happened on Bitcoin 4 months ago.
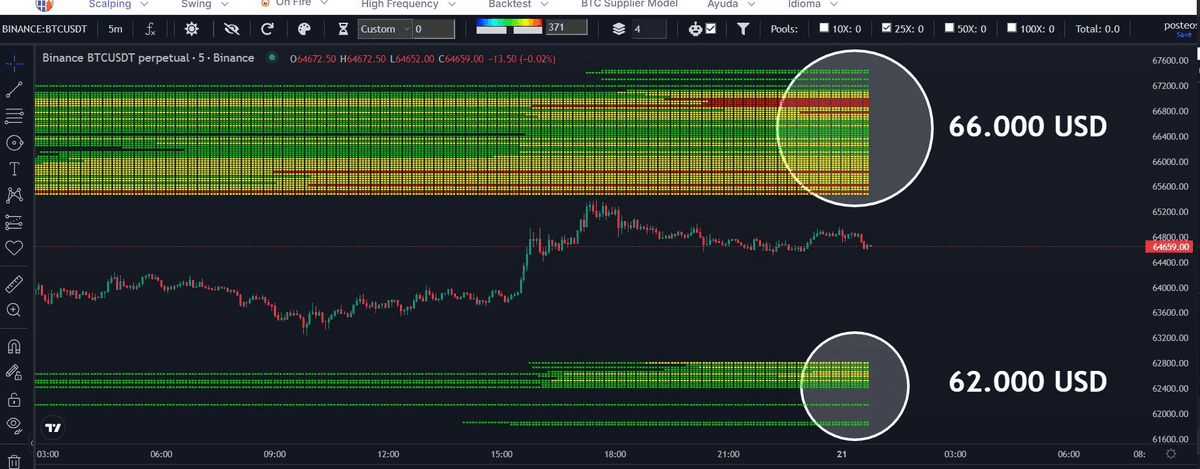
Dumps from $63,000 without retesting the upper pool (LONGS liquidated) $BTC dumps UNTIL where the liquidity is.
Liquidates shorts, and bounces. $BTC visited both Liquidity pools in 4H.
This movement happened on Bitcoin 4 months ago.
Dumps from $63,000 without retesting the upper pool (LONGS liquidated) $BTC dumps UNTIL where the liquidity is.
Liquidates shorts, and bounces. $BTC visited both Liquidity pools in 4H.
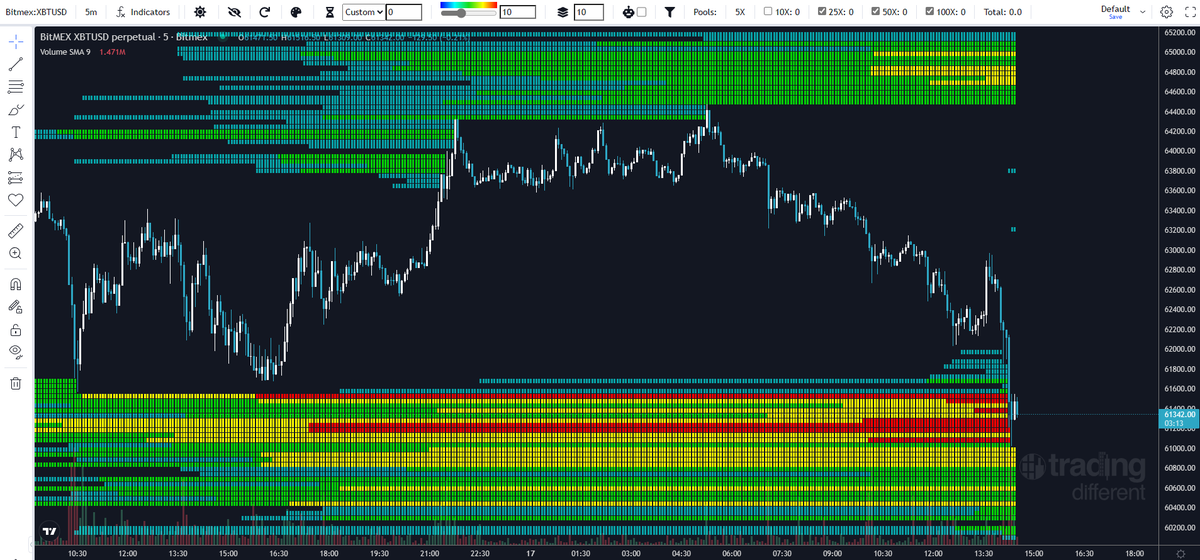
3.1 Pools of Liquidity
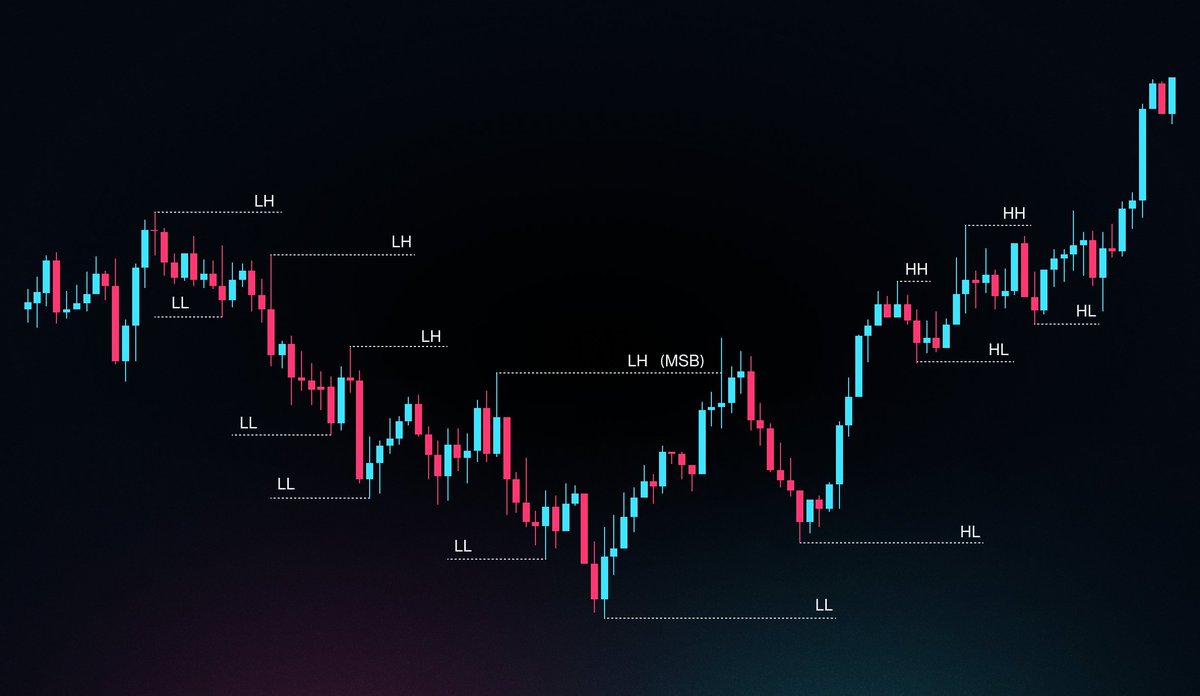
The price fails to sweep the upper liquidity, and after a rapid pullback, the movement followed is staggered.
The price get to sweep the pending area in the lower pool
Sometimes, price hasn’t need to retest upper liquidity in order to then retrace
The price fails to sweep the upper liquidity, and after a rapid pullback, the movement followed is staggered.
The price get to sweep the pending area in the lower pool
Sometimes, price hasn’t need to retest upper liquidity in order to then retrace
4. Backtesting Liquidity:
Backtesting is evaluating the effectiveness of a trading strategy by running it against historical data.
In this way a strategy can be evaluated.
Backtesting using Heatmaps will improve the placement of your stop loss
Backtesting is evaluating the effectiveness of a trading strategy by running it against historical data.
In this way a strategy can be evaluated.
Backtesting using Heatmaps will improve the placement of your stop loss
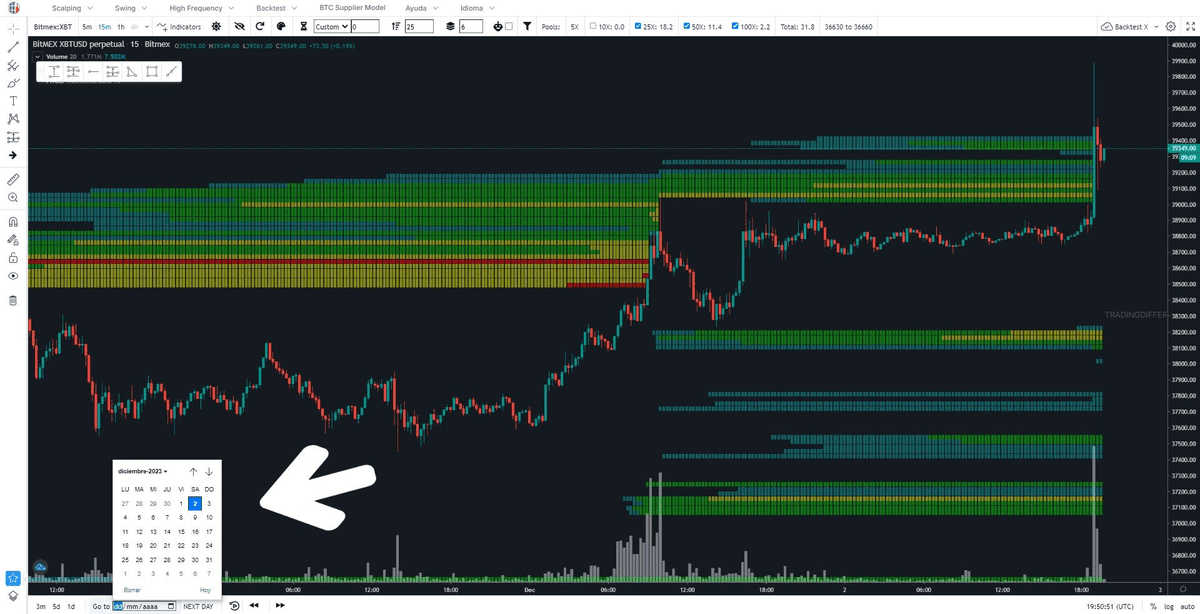
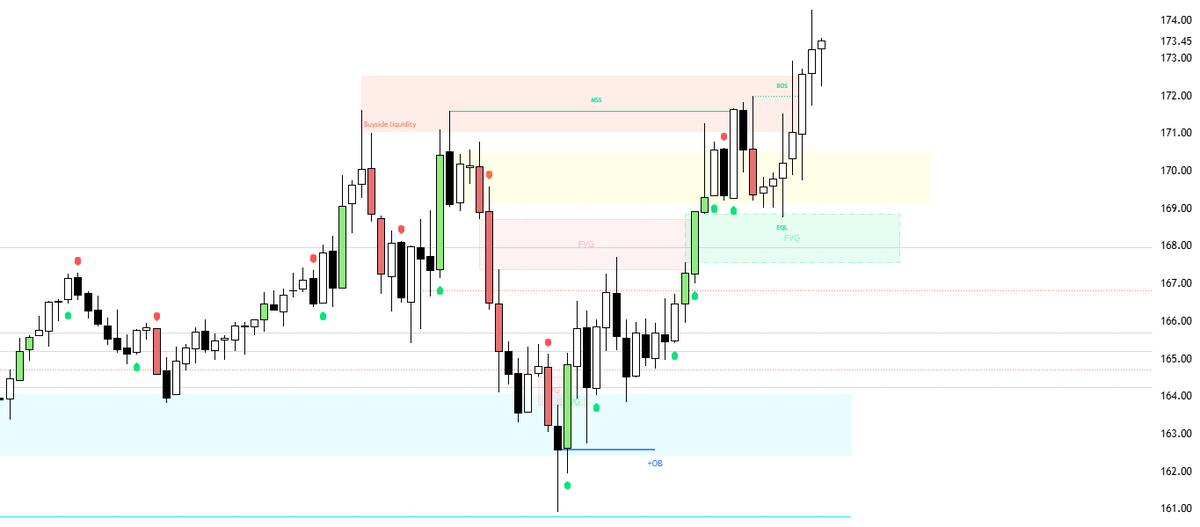
4.1 Backtesting Liquidity
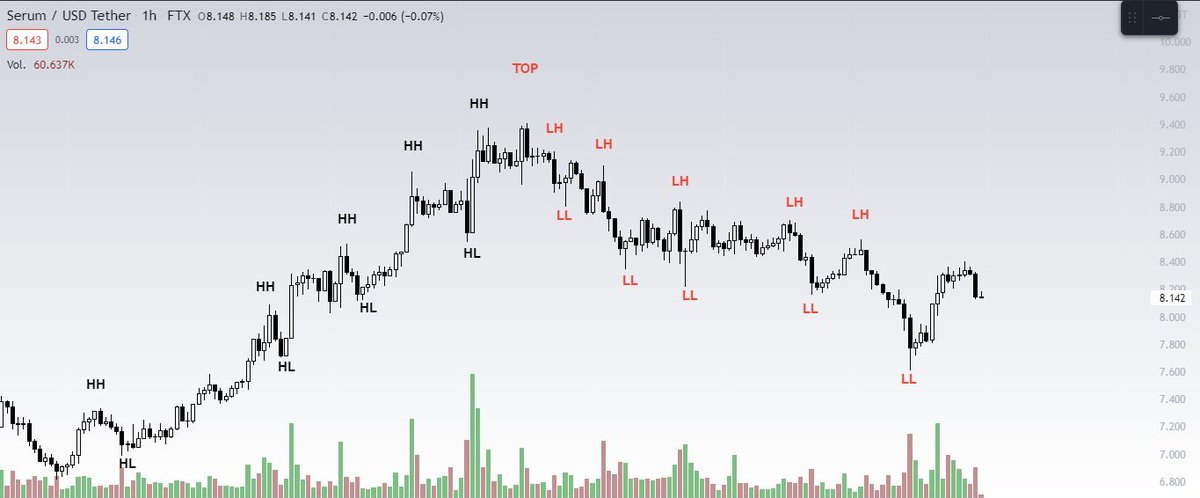
After a Range, and with the probability of reaching the higher liquidity, the price retraces to remove over-leveraged long traders.
This is a frequent scenario that shows manipulation.
After making a bottom, price reaches that higher liquidity
After a Range, and with the probability of reaching the higher liquidity, the price retraces to remove over-leveraged long traders.
This is a frequent scenario that shows manipulation.
After making a bottom, price reaches that higher liquidity
• • •
Missing some Tweet in this thread? You can try to
force a refresh