PMC COVID-19 Forecasting Model, August 26, 2024
🧵1/8
We're in uncharted territory during the back-to-school period.
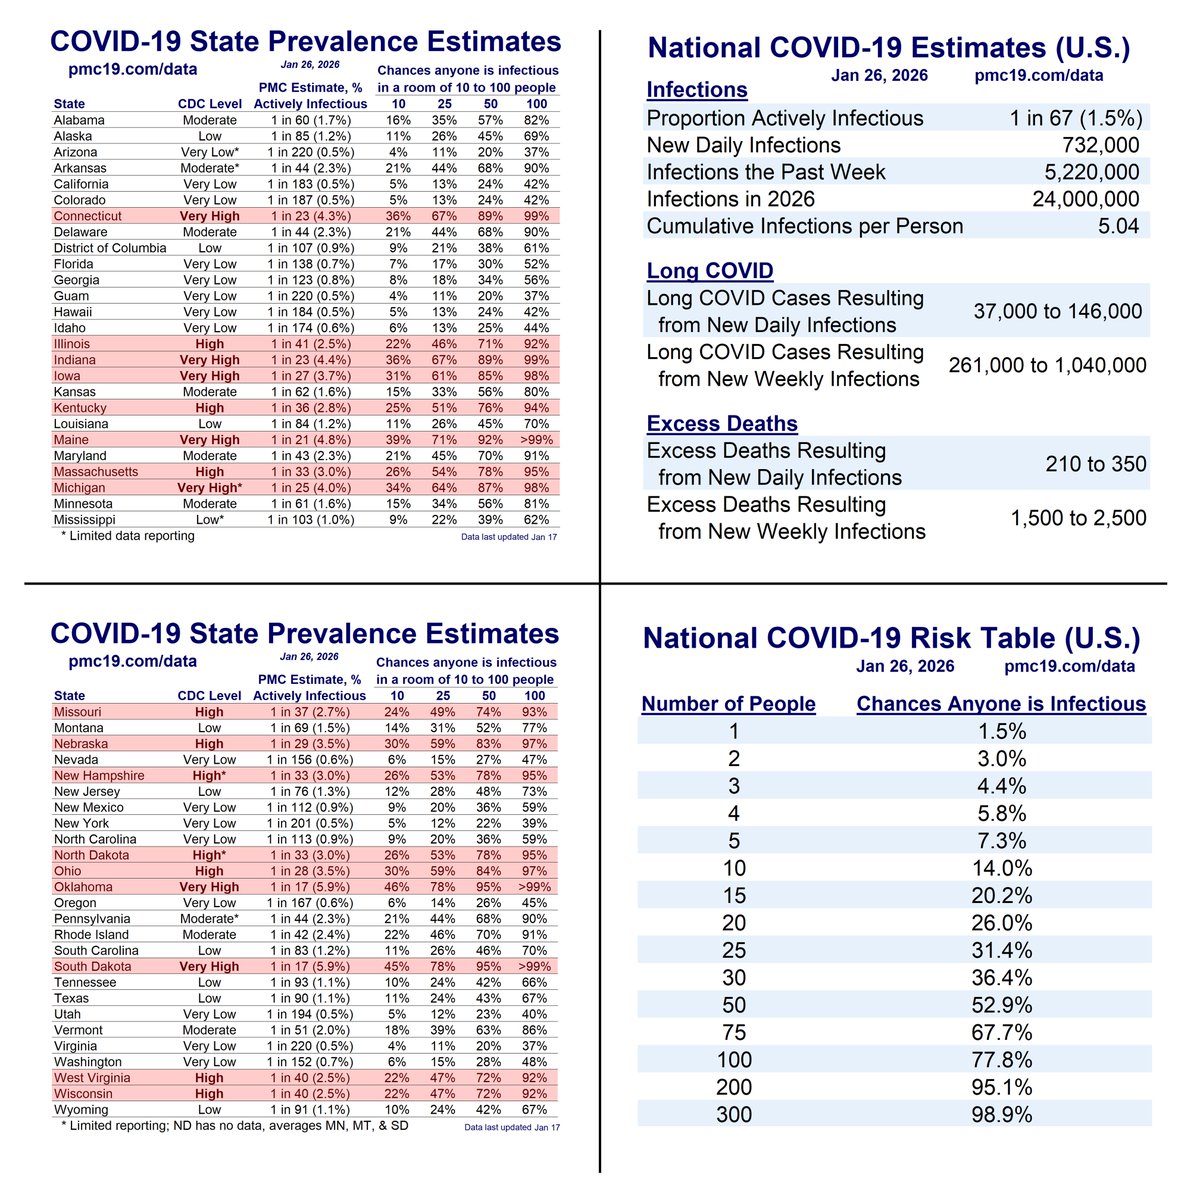
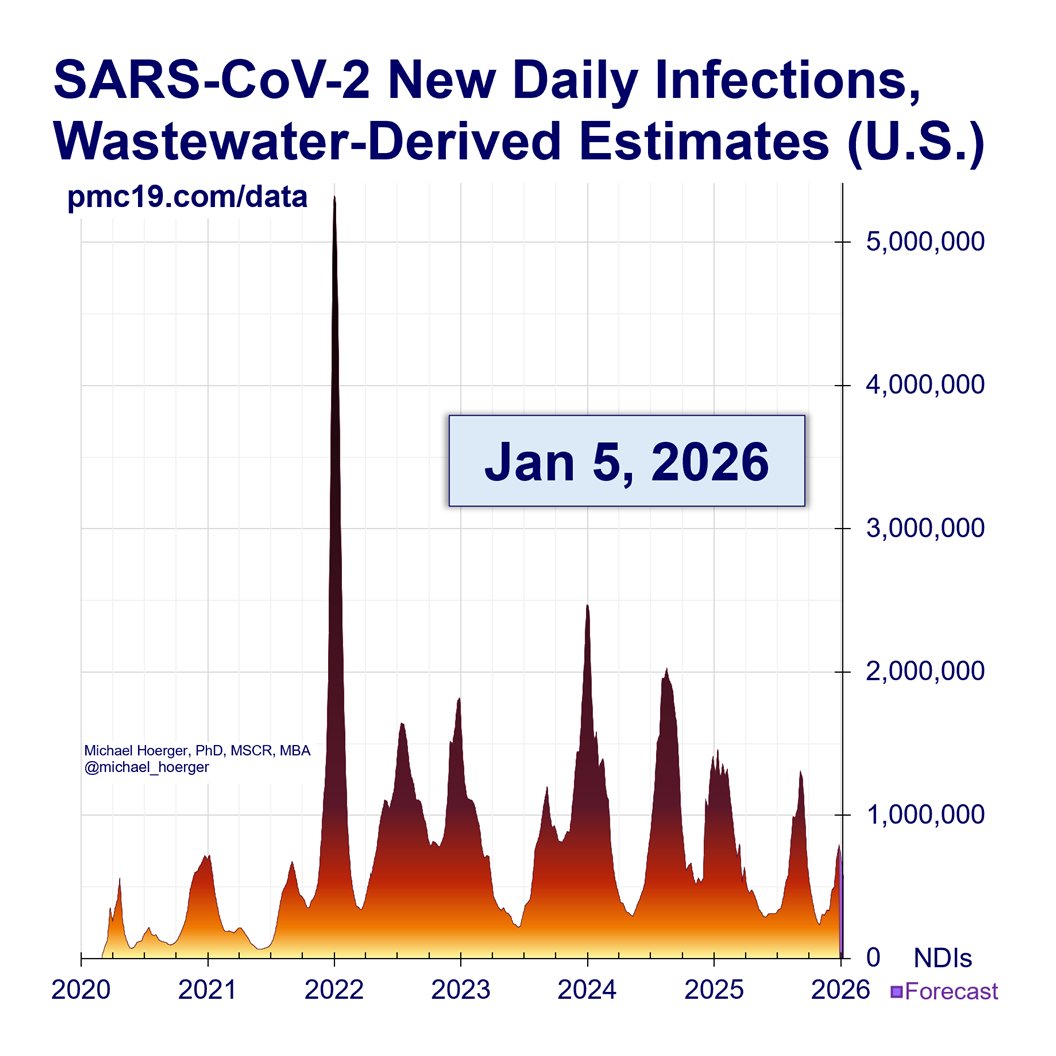
1.2 million people in the U.S. are getting infected per day.
1 in 41 people (2.5%) are actively infectious.
🧵1/8
We're in uncharted territory during the back-to-school period.
1.2 million people in the U.S. are getting infected per day.
1 in 41 people (2.5%) are actively infectious.

PMC COVID-19 Forecasting Model, August 26, 2024
🧵2/8
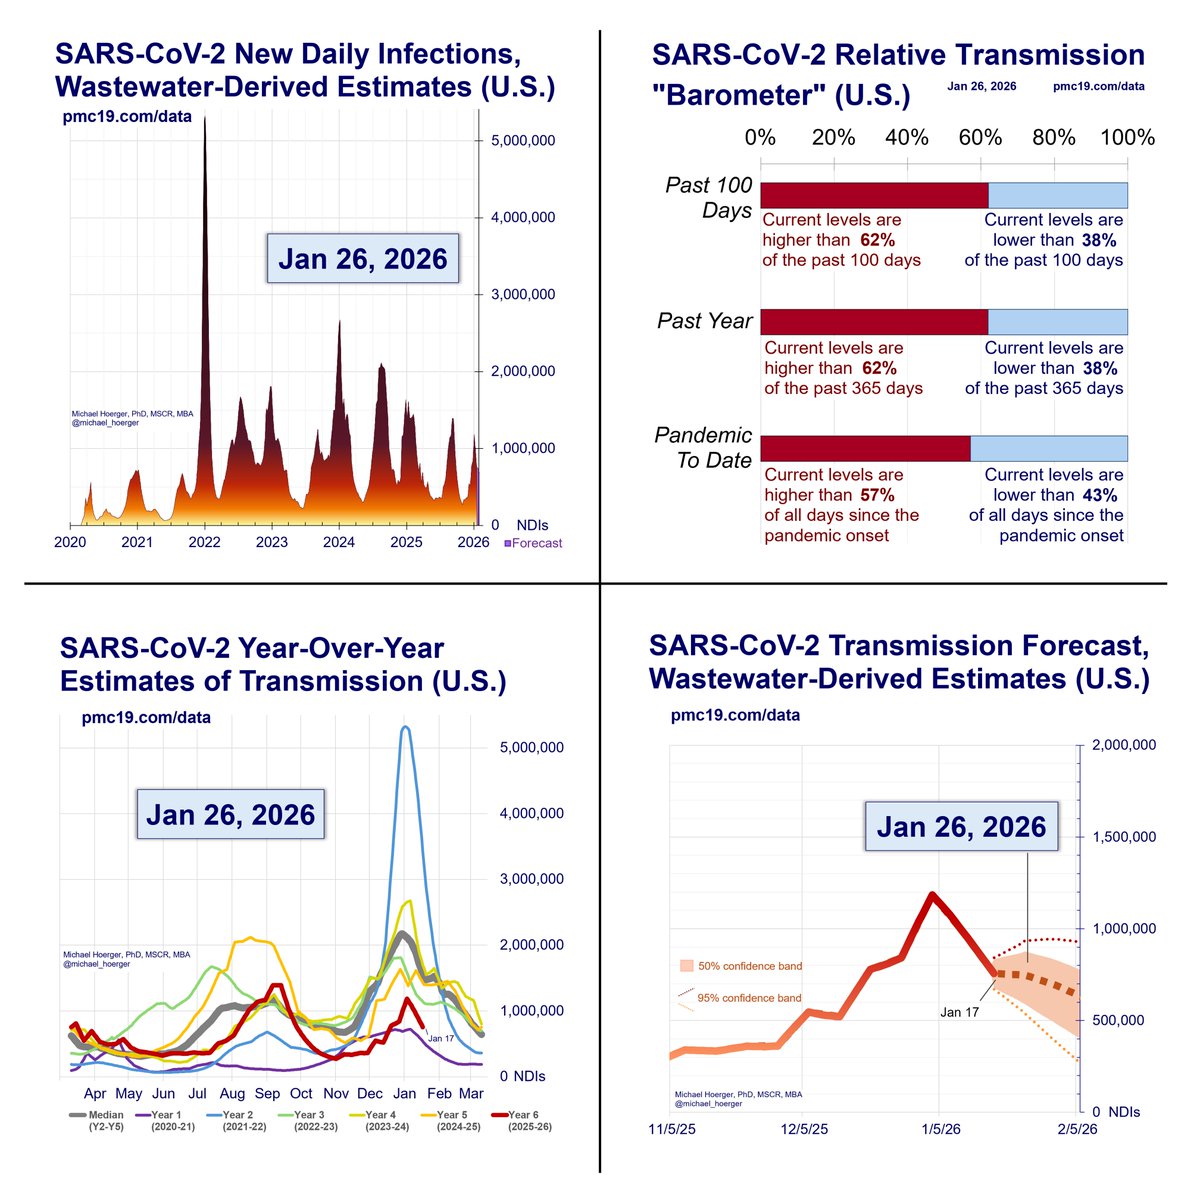
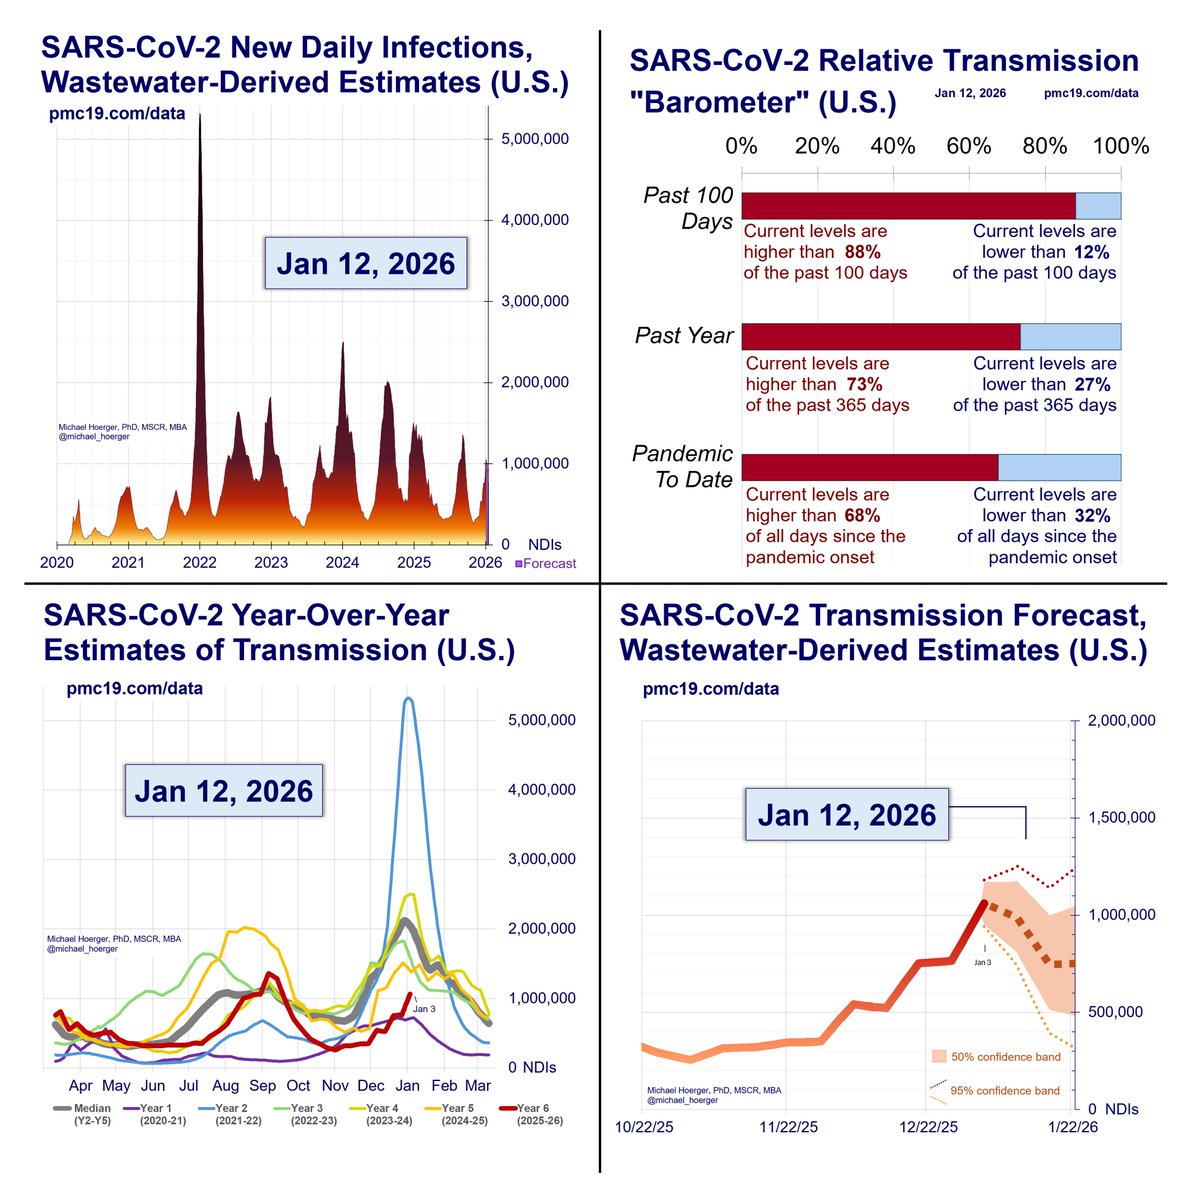
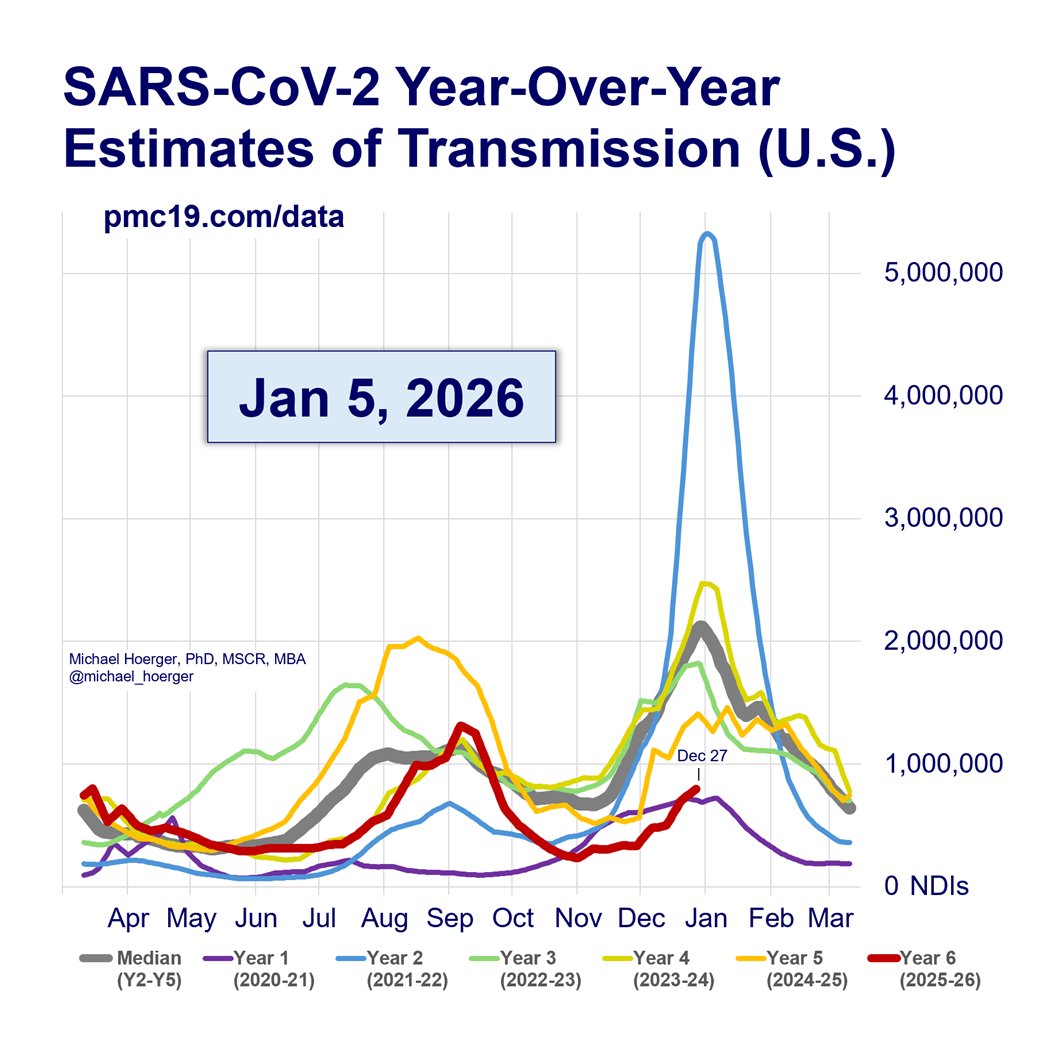
The year-over-year graphs shows that we are experiencing much high transmission than during previous back-to-school periods.
This is a much higher and wider wave than Y1, Y2, and Y4 of the pandemic. Year 3's summer wave was very bad, but much earlier.
The 1-day isolation period, decline in most other mitigation, and a culture of denialism ("post pandemic," "Covid is over,") will fuel many infections among young people, teachers, school staff, and parents.
Expect absences at schools. Expect substantial workforce problems related to sick parents.

PMC COVID-19 Forecasting Model, August 26, 2024
🧵3/8
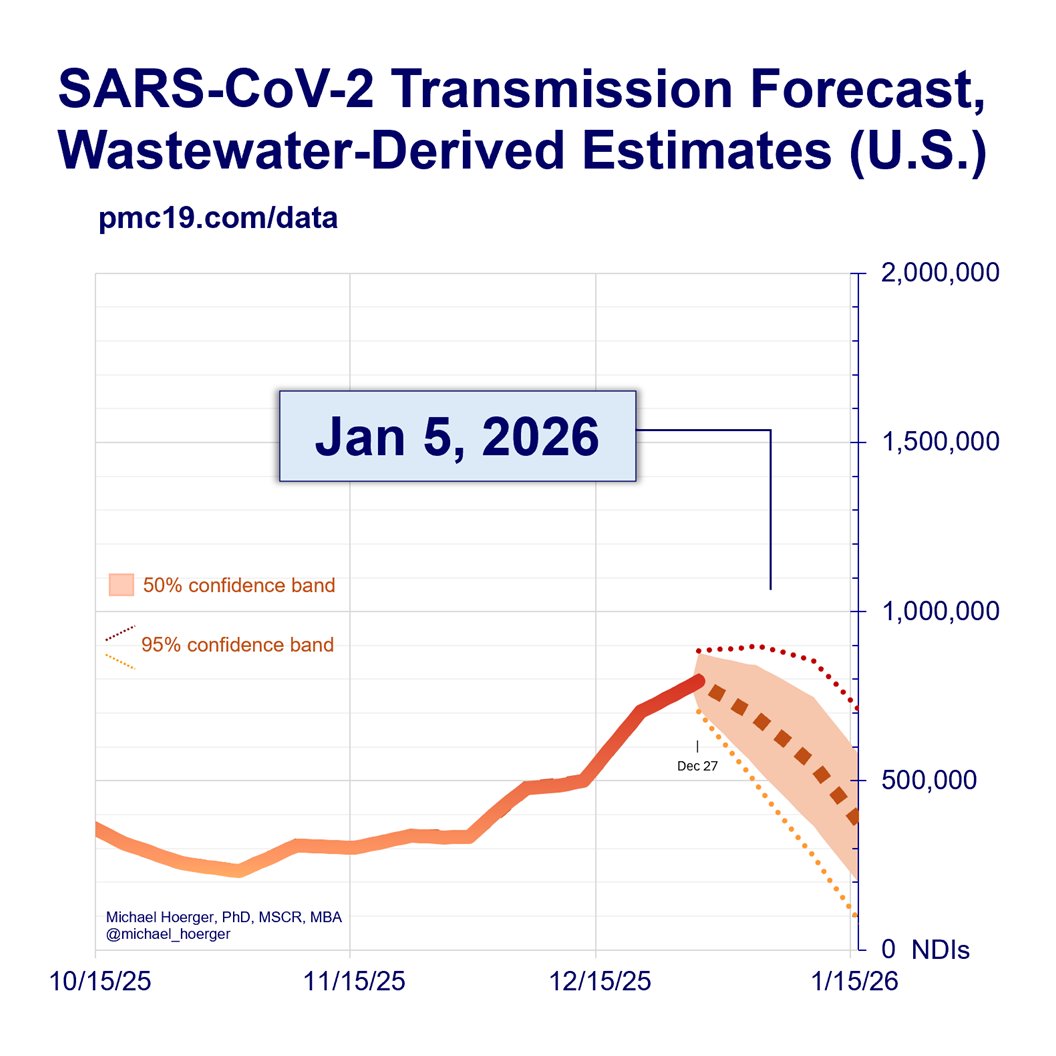
Here's a zoomed in version of current transmission and the forecast.
Notice that transmission will likely remain >1 million infections per day for the next month and counting.
Note that the national peak appears just behind us. The CDC graphs may suggest that we're currently peaking, but note their data are >1 week old. The forecast provides an updated best estimate for today. The peak and shape of the observed wave could change as CDC and Biobot retroactively correct numbers (perhaps a bigger, earlier spike). Alternatively, Biobot has been slow to update their data, and their data were suggesting a later peak. However, I suspect the current picture won't change terrible much in hindsight.
We're seeking a less spiky, more plateau-like peak because there is substantial regional variation. The West and South regions have extremely high transmission and have likely peaked. The Midwest and Northeast are lower but rising.
Keep an eye on regional or local data, and overall remember that local peaks could occur weeks before or after the national peak. Also, 50-60% of transmission commonly occurs on the back end of waves.

PMC COVID-19 Forecasting Model, August 26, 2024
🧵4/8
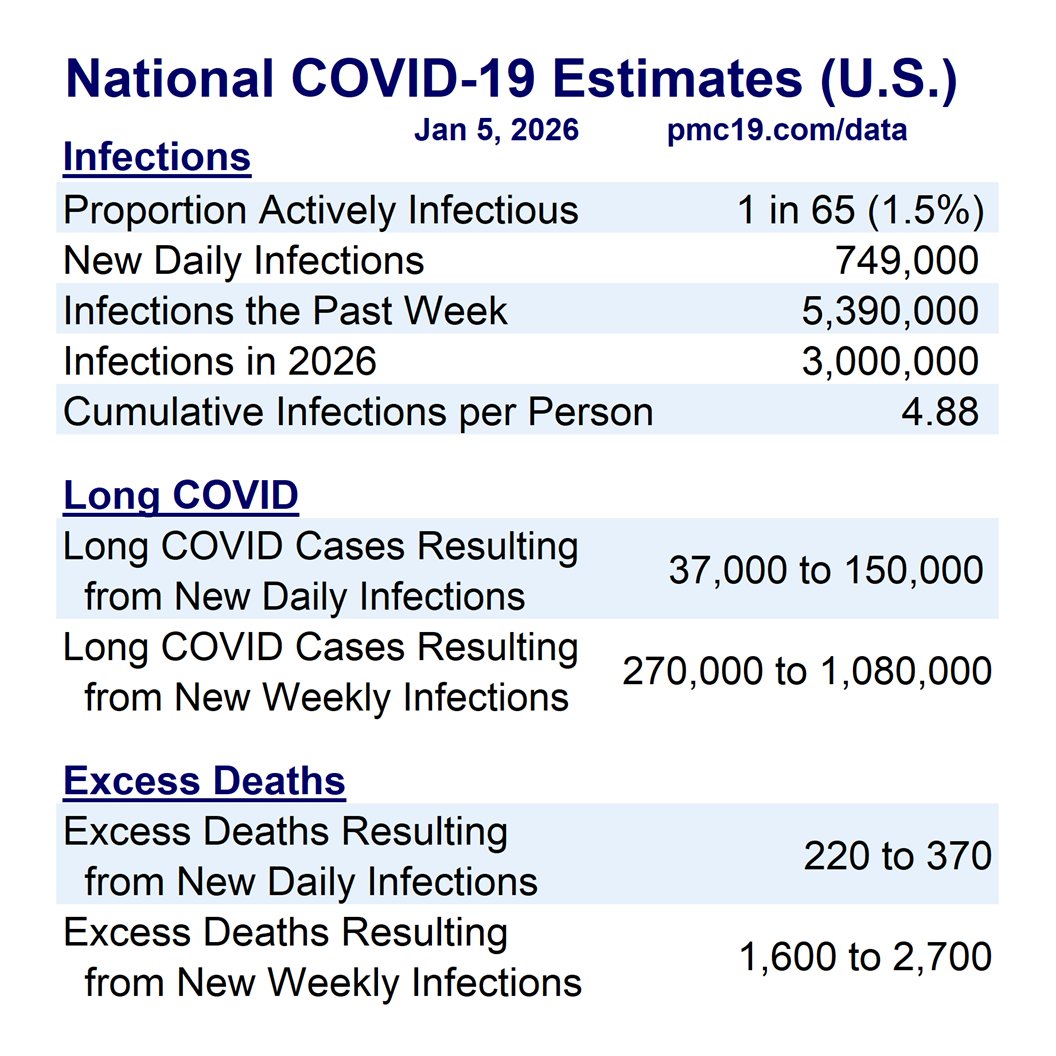
These statistics document the public health burden of the ongoing pandemic. Examples:
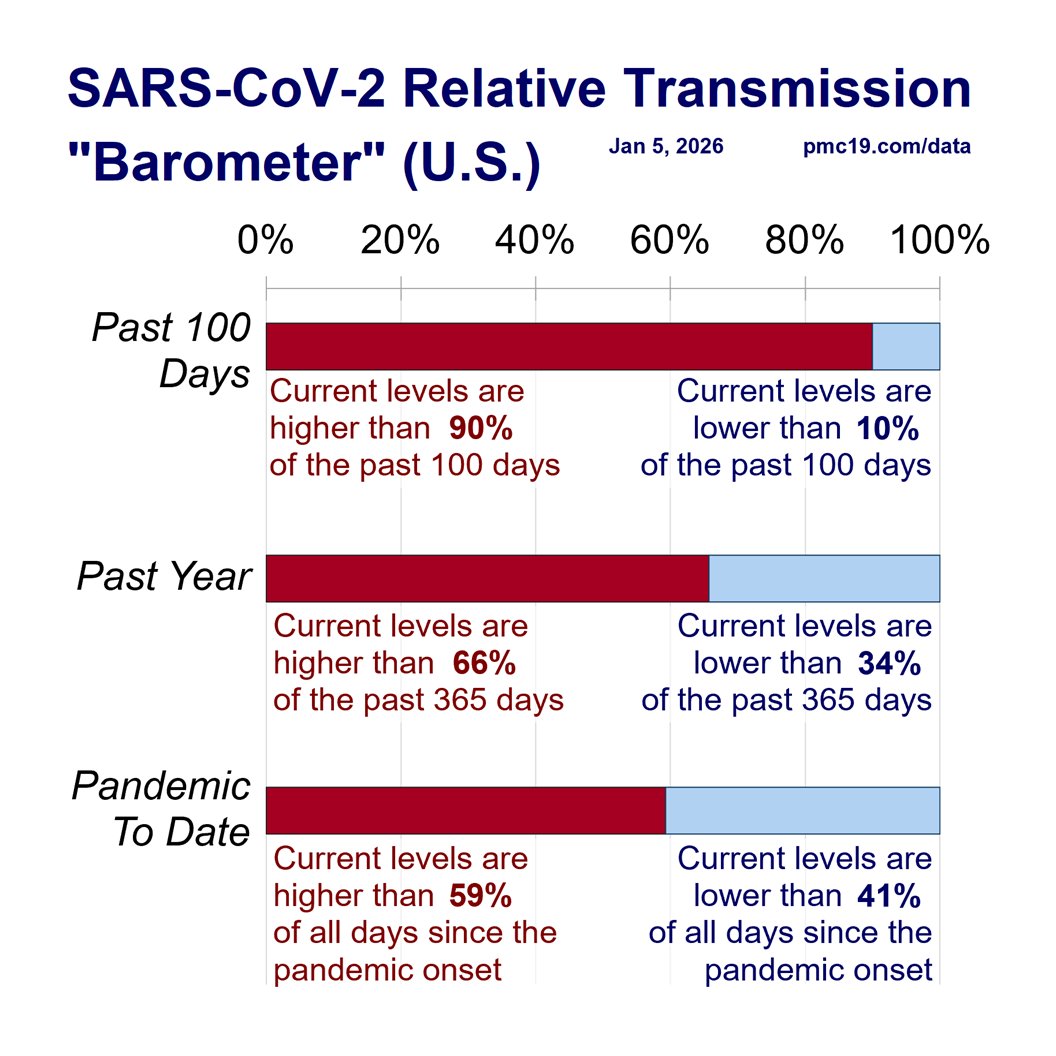
🔹Higher transmission than 86% of the pandemic
🔹34 million infections the next month
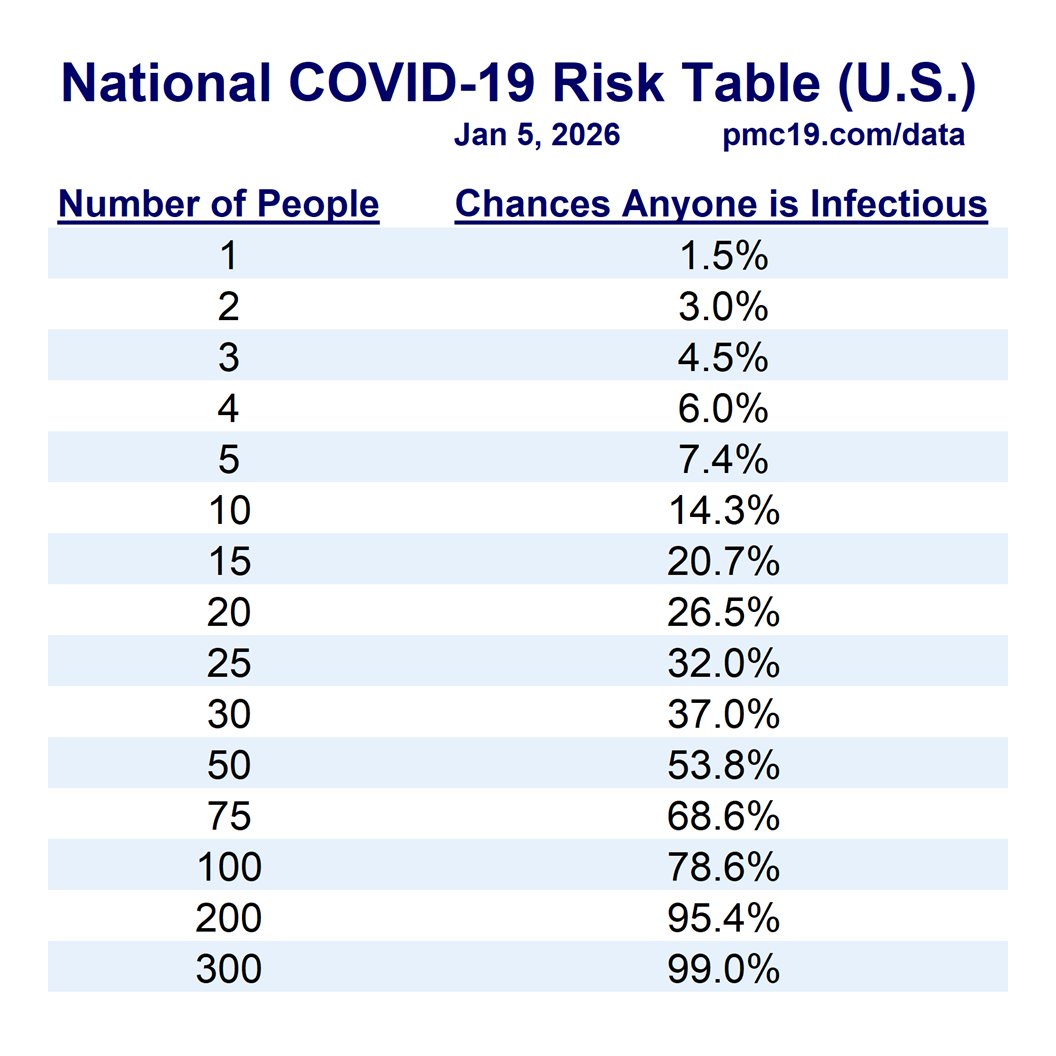
🔹>50% chance of a Covid exposure in a class of 30
🧵4/8
These statistics document the public health burden of the ongoing pandemic. Examples:
🔹Higher transmission than 86% of the pandemic
🔹34 million infections the next month
🔹>50% chance of a Covid exposure in a class of 30

PMC COVID-19 Forecasting Model, August 26, 2024
🧵5/8
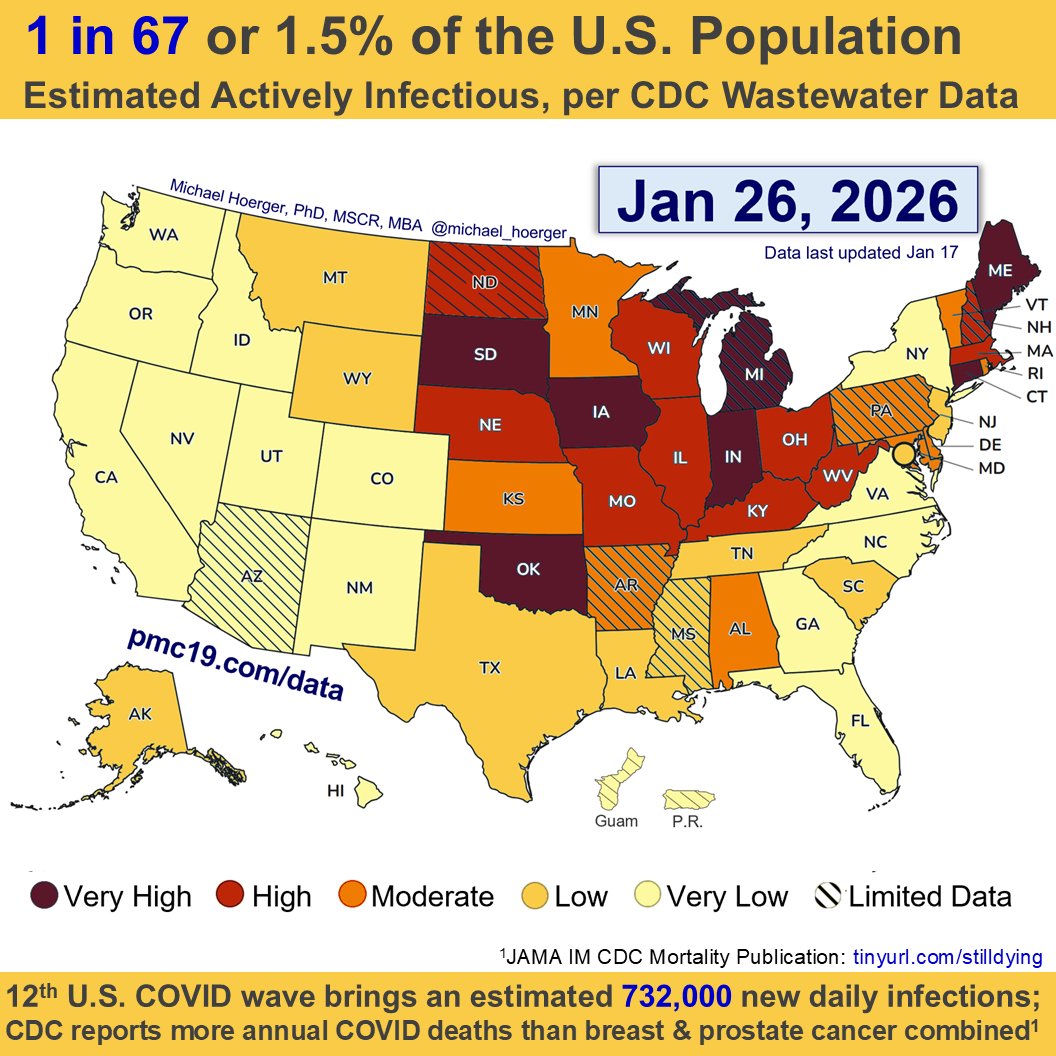
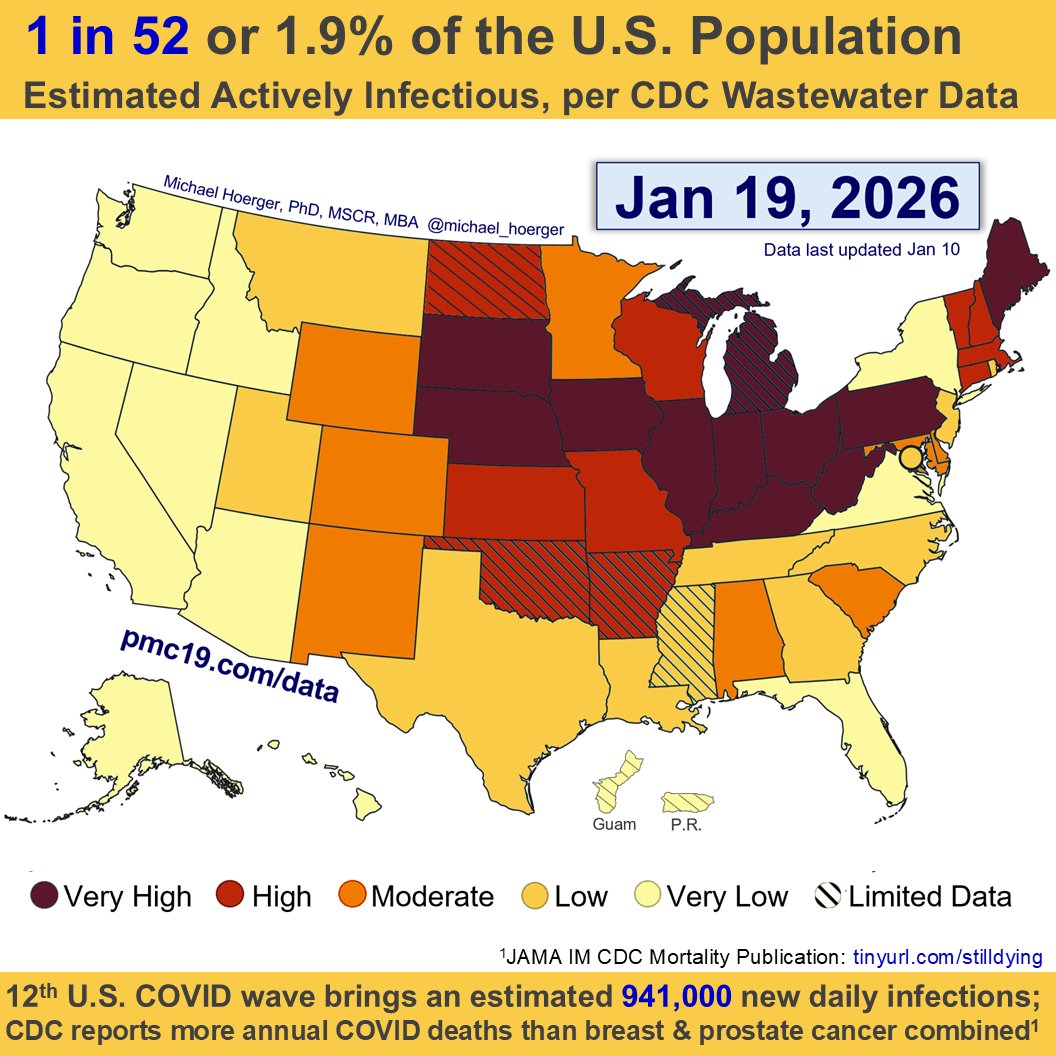
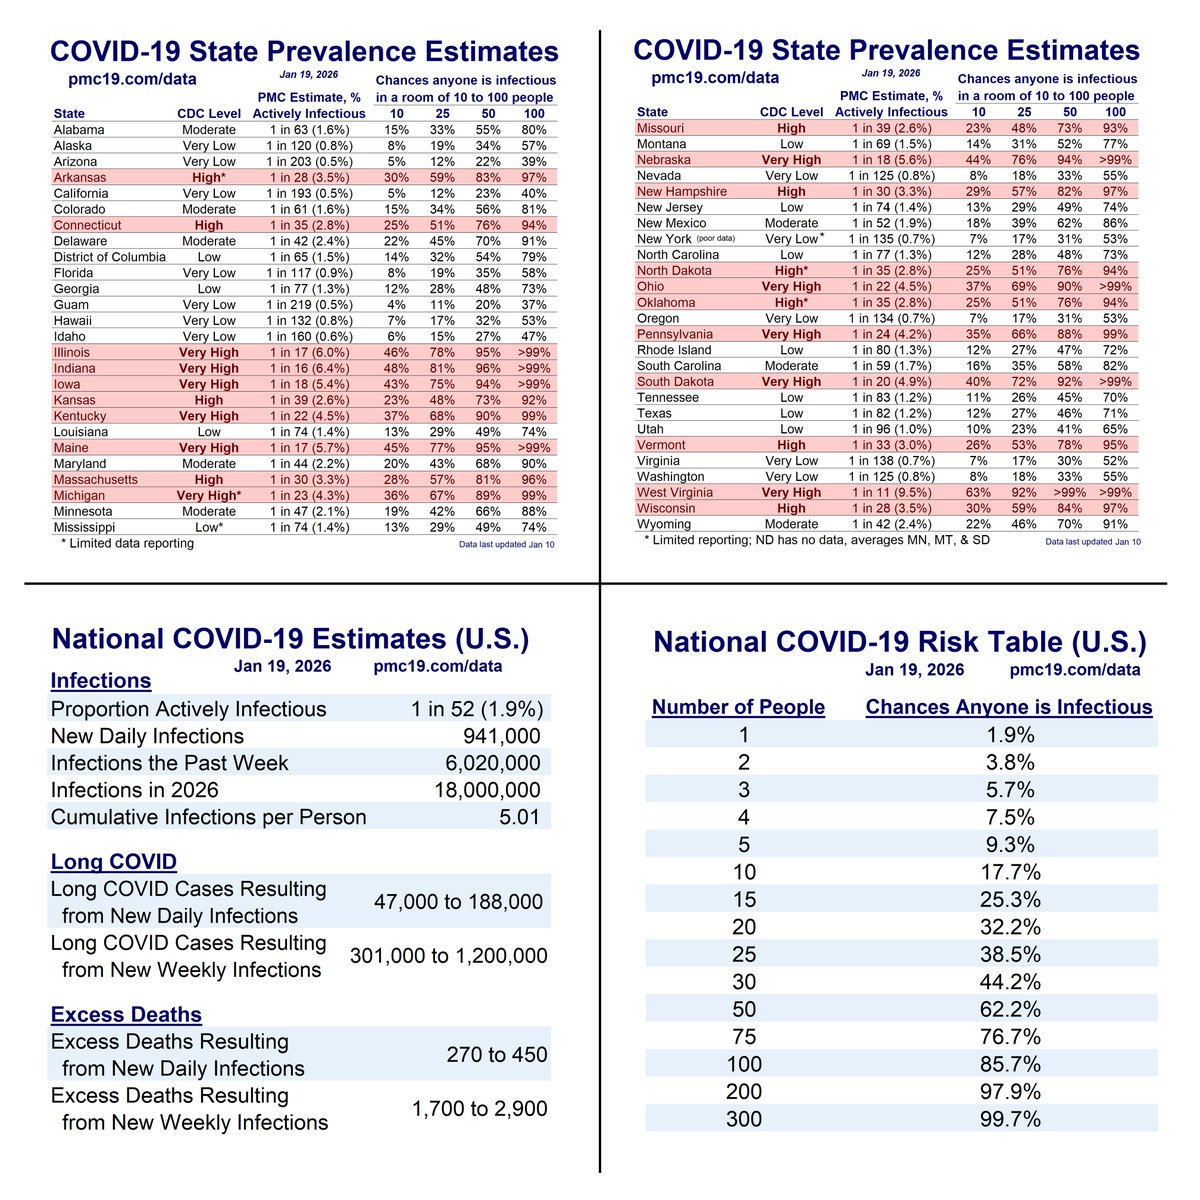
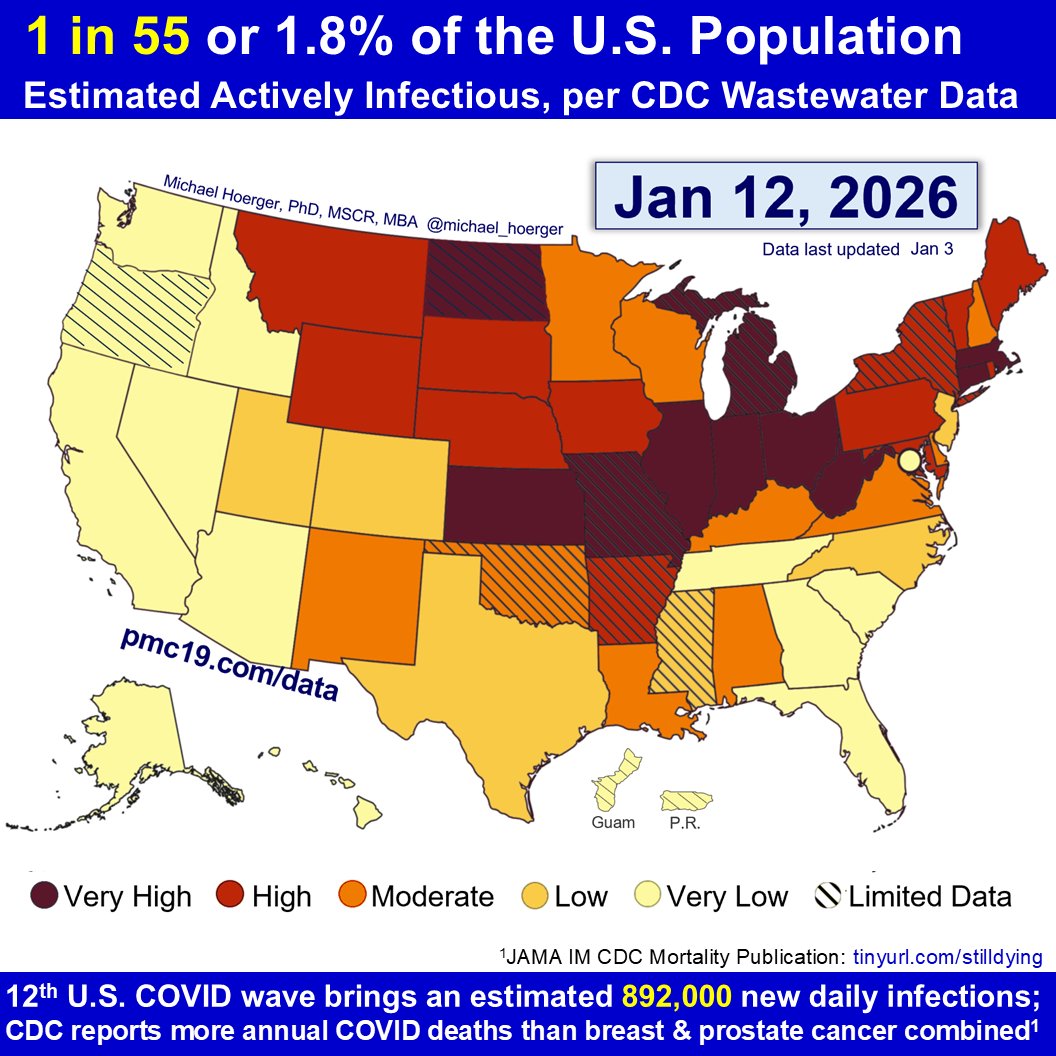
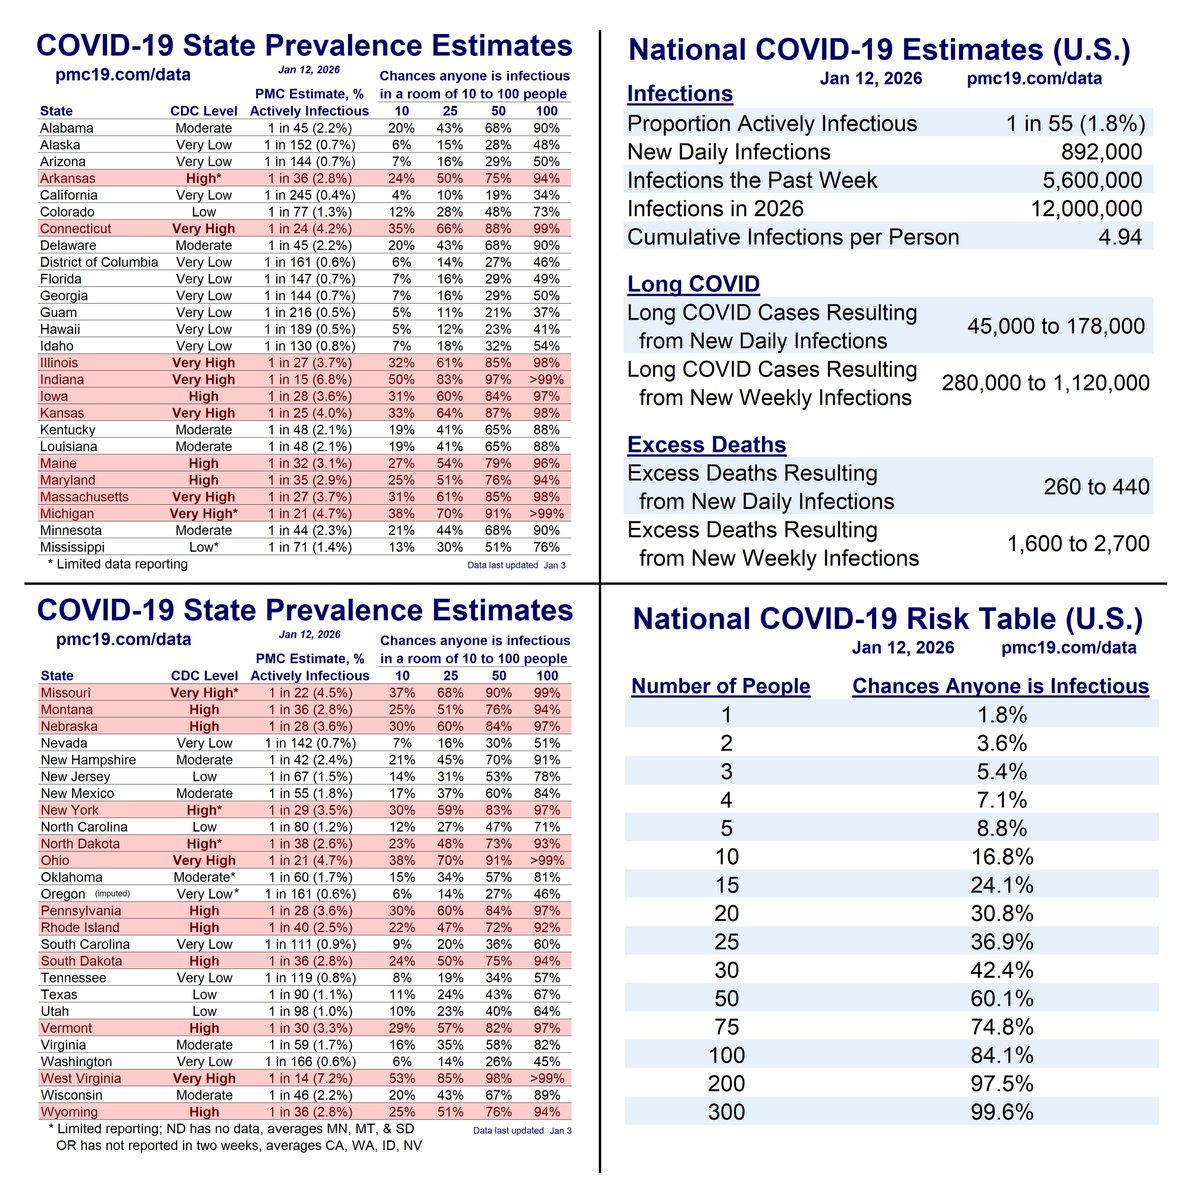
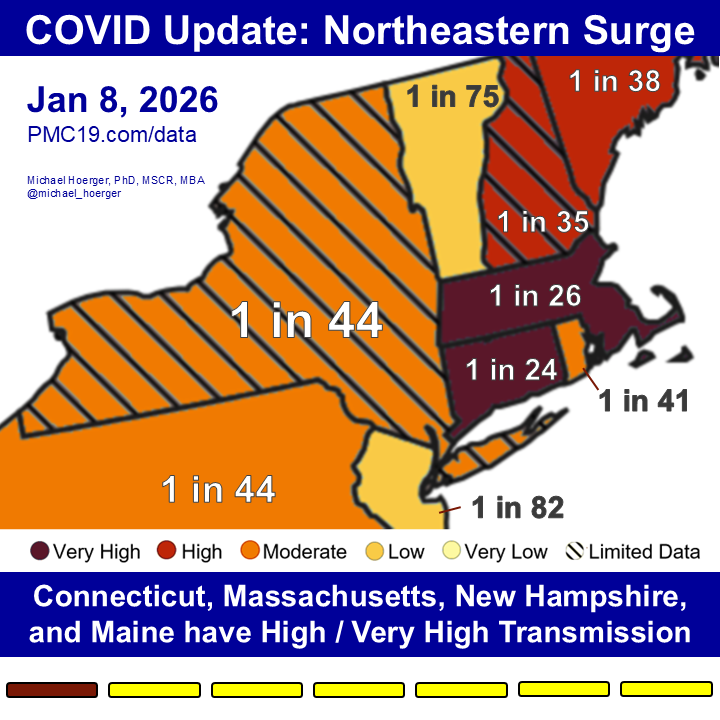
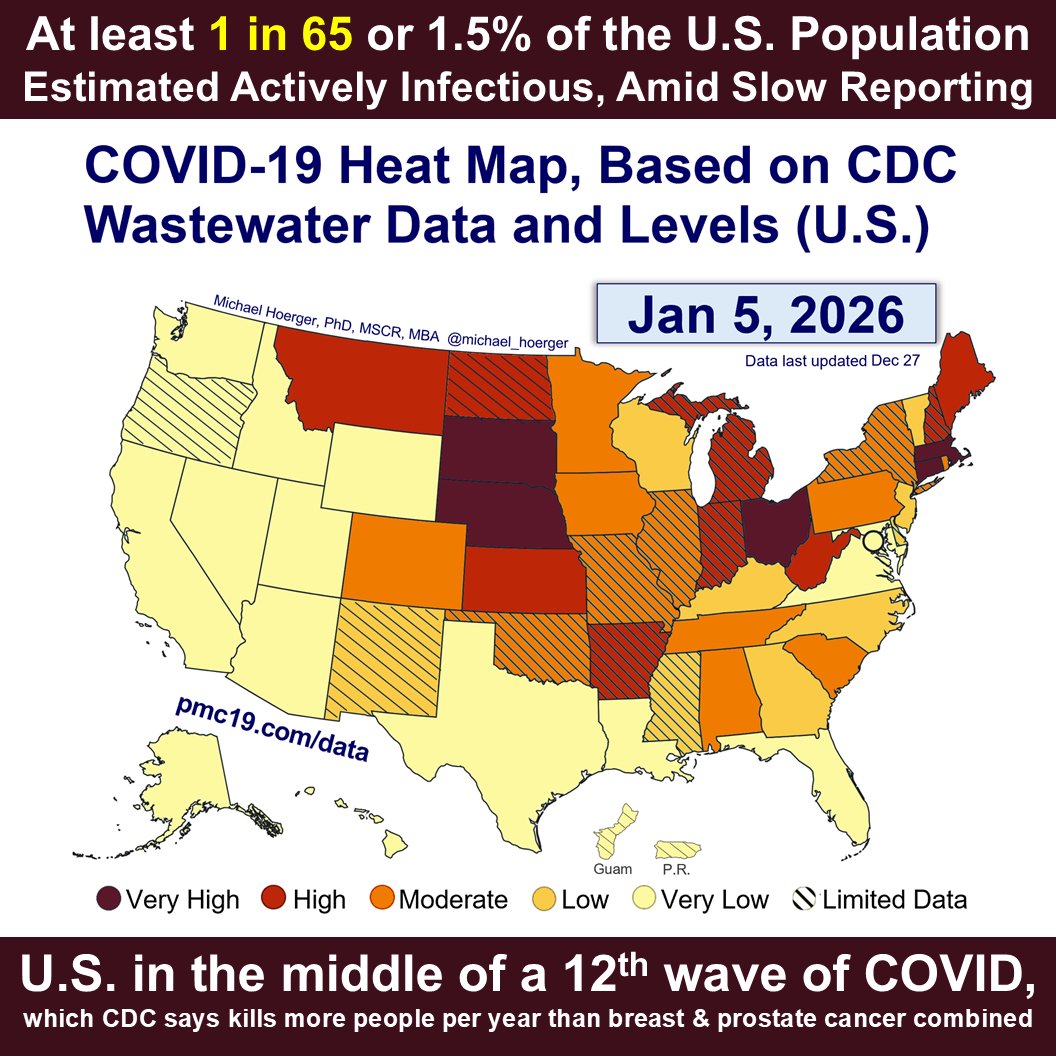
This is the current heat map for the U.S. The data are from the most recent CDC update.
ALT text includes estimates of the percentage actively infectious in each of the deep red states.
🧵5/8
This is the current heat map for the U.S. The data are from the most recent CDC update.
ALT text includes estimates of the percentage actively infectious in each of the deep red states.

PMC COVID-19 Forecasting Model, August 26, 2024
🧵6/8
These are estimates of the percentage of each region of the U.S. that is actively infectious with Covid.
For example, while about 2.5% of the U.S. is actively infectious, the figures are higher in the South and West regions, and lower in the Midwest and Northeast (though catching up).
The estimates on the left re-weight the CDC data by combining Biobot and CDC data and carry forward to the current date using modeling, even though the public data always have a reporting lag.
The values on the right are purely derived from the most recent data reported on the CDC website (>1 week old). Anyone can compute these. Find the current CDC level, and multiply it by the PMC Multiplier. Example in next Tweet.
In either case, you'll note the estimates are similar. Feel free to report either or a range.

PMC COVID-19 Forecasting Model, August 26, 2024
🧵7/8
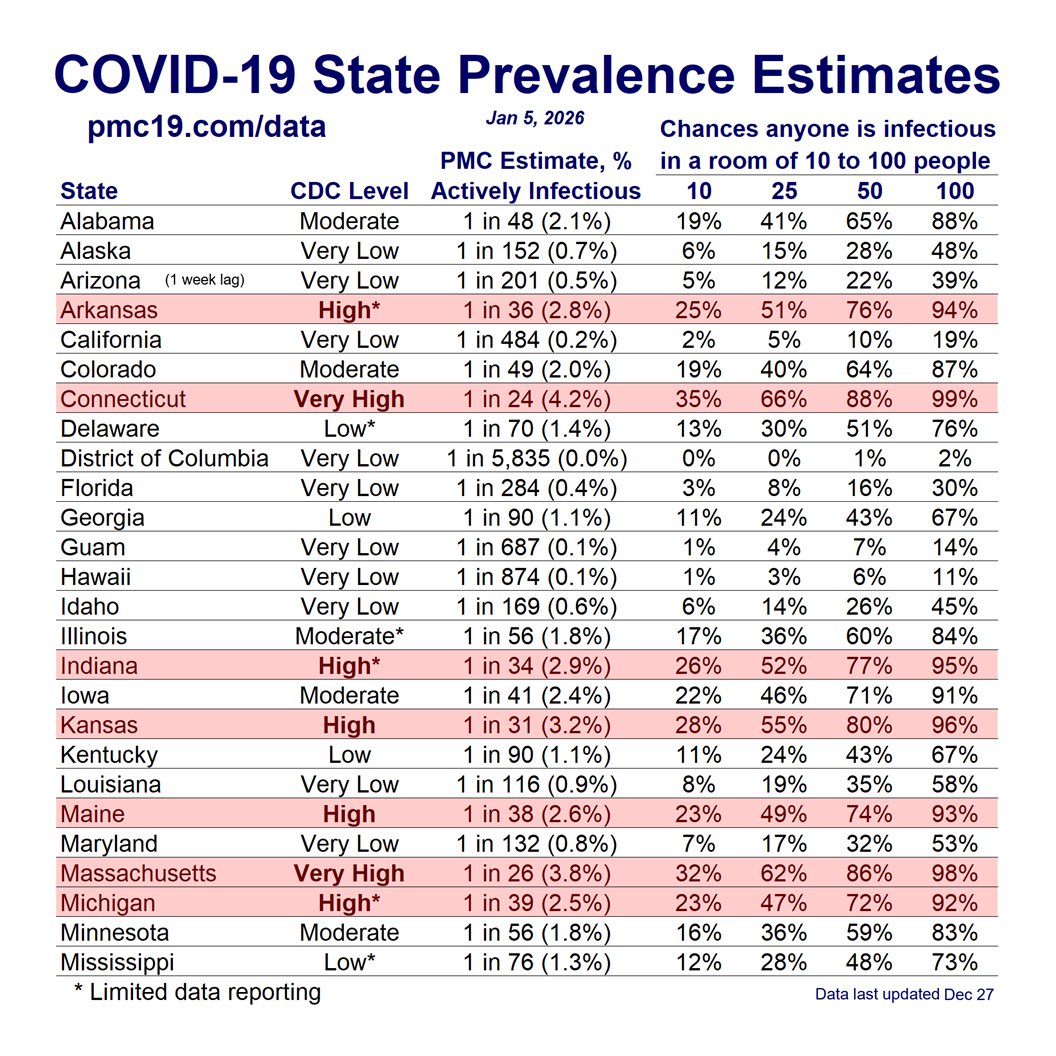
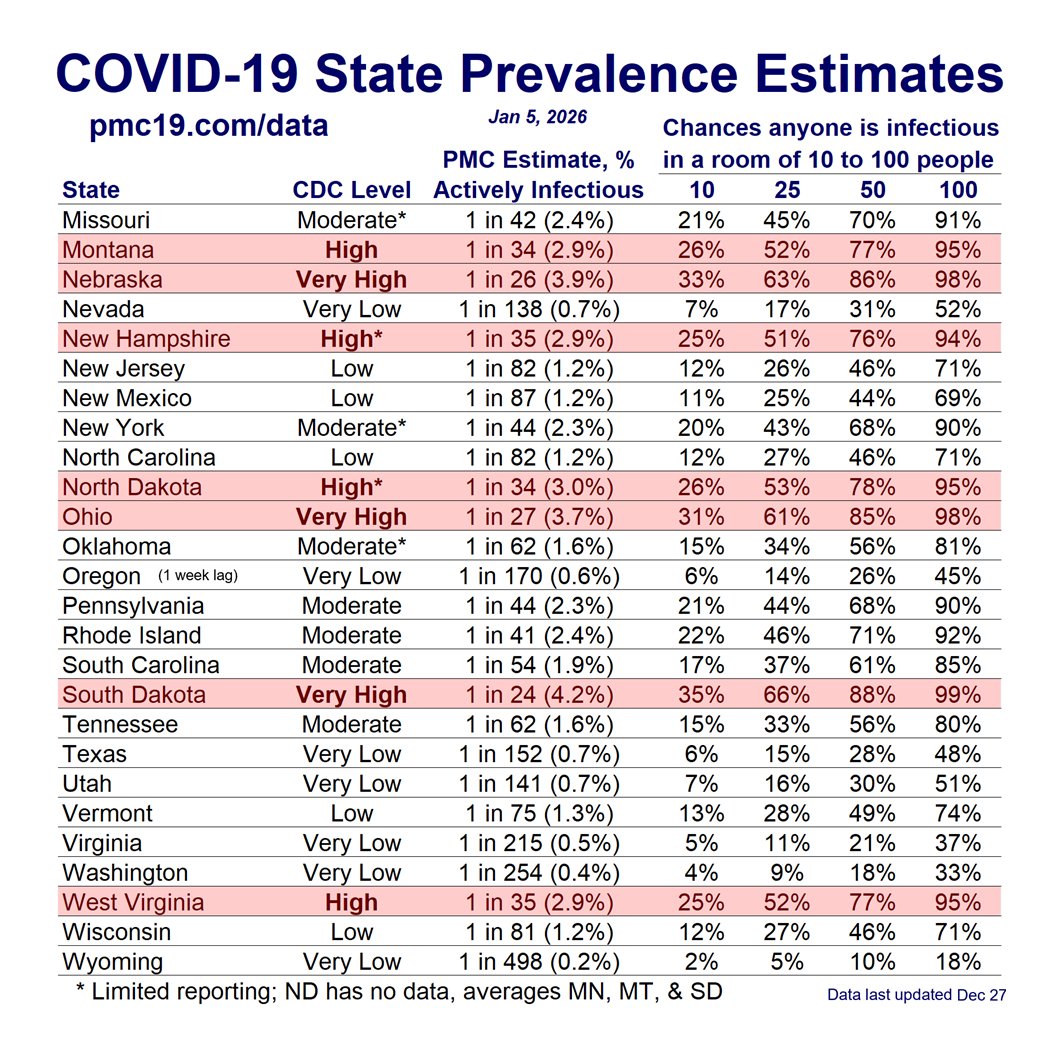
>5% of people in Oregon, DC, Minnesota, and Arkansas are estimated to have infectious Covid. 12 other states are close behind.
You can take the CDC levels for a geographic entity and multiple it by the PMC Multiplier to get an estimate of the percentage of the population infectious in that region.
Here are the states with the highest transmission, acknowledging the most recent CDC data are >1 week old.
Just take the CDC level and multiply by 0.329, e.g., 23.82 x 0.329 = 7.8, meaning 7.8% are infectious. Take 100/7.8 to get the 1 in ____ infectious number.
Note, these are point estimates. Assume broader confidence intervals when focusing on smaller geographic units, especially if they have fewer sites reporting. These should serve heuristic value in local conversations, particularly in states that are experiencing very high transmission.

PMC COVID-19 Forecasting Model, August 26, 2024
🧵8/8
The full PMC Dashboard documents the ongoing toll of the COVID-19 pandemic. Please screenshot, improve, and share any of this work across platforms. #MaskUp
Reports/Methods: pmc19.com/data/
🧵8/8
The full PMC Dashboard documents the ongoing toll of the COVID-19 pandemic. Please screenshot, improve, and share any of this work across platforms. #MaskUp
Reports/Methods: pmc19.com/data/

• • •
Missing some Tweet in this thread? You can try to
force a refresh


