Footprint & TPO / Market profile
[videos with timestamps]
Essentials & strategies...
a thread 🧵
[videos with timestamps]
Essentials & strategies...
a thread 🧵

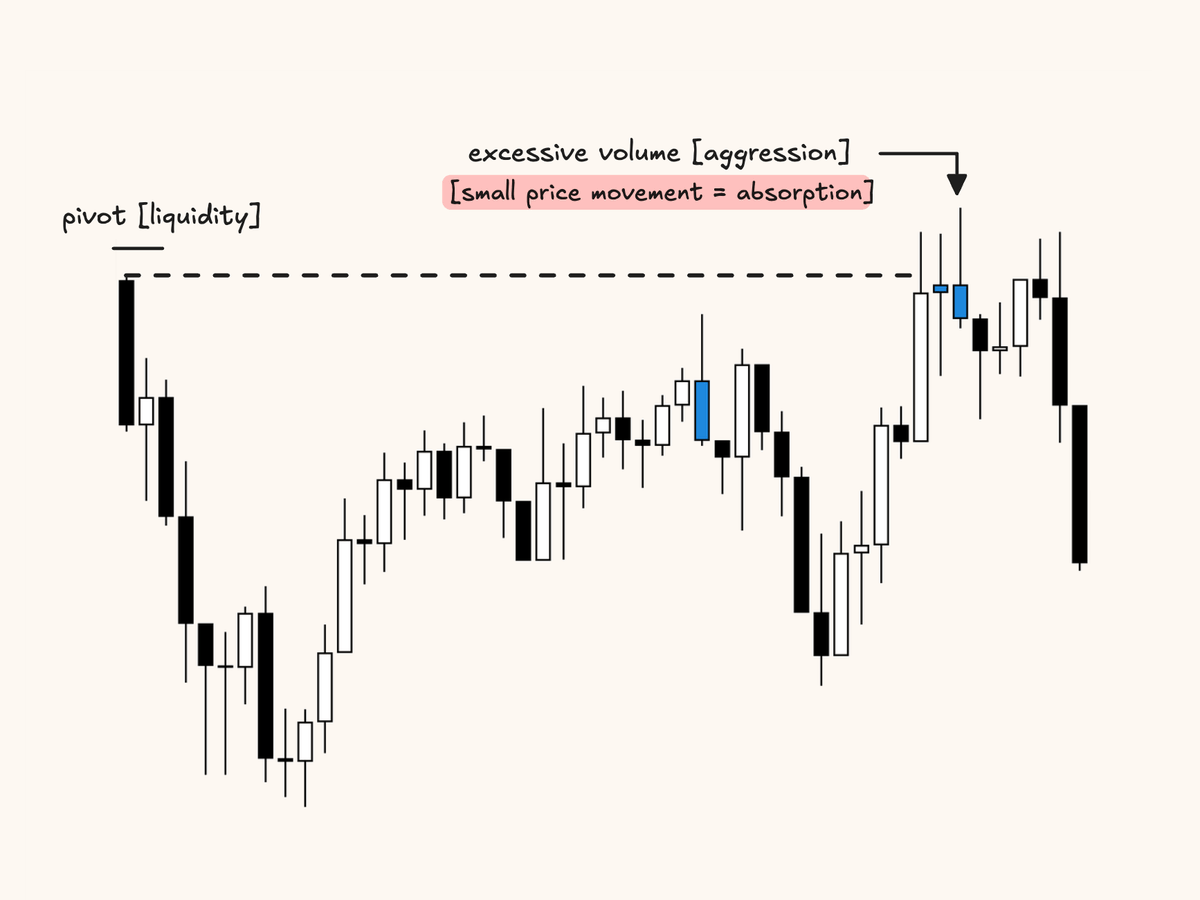
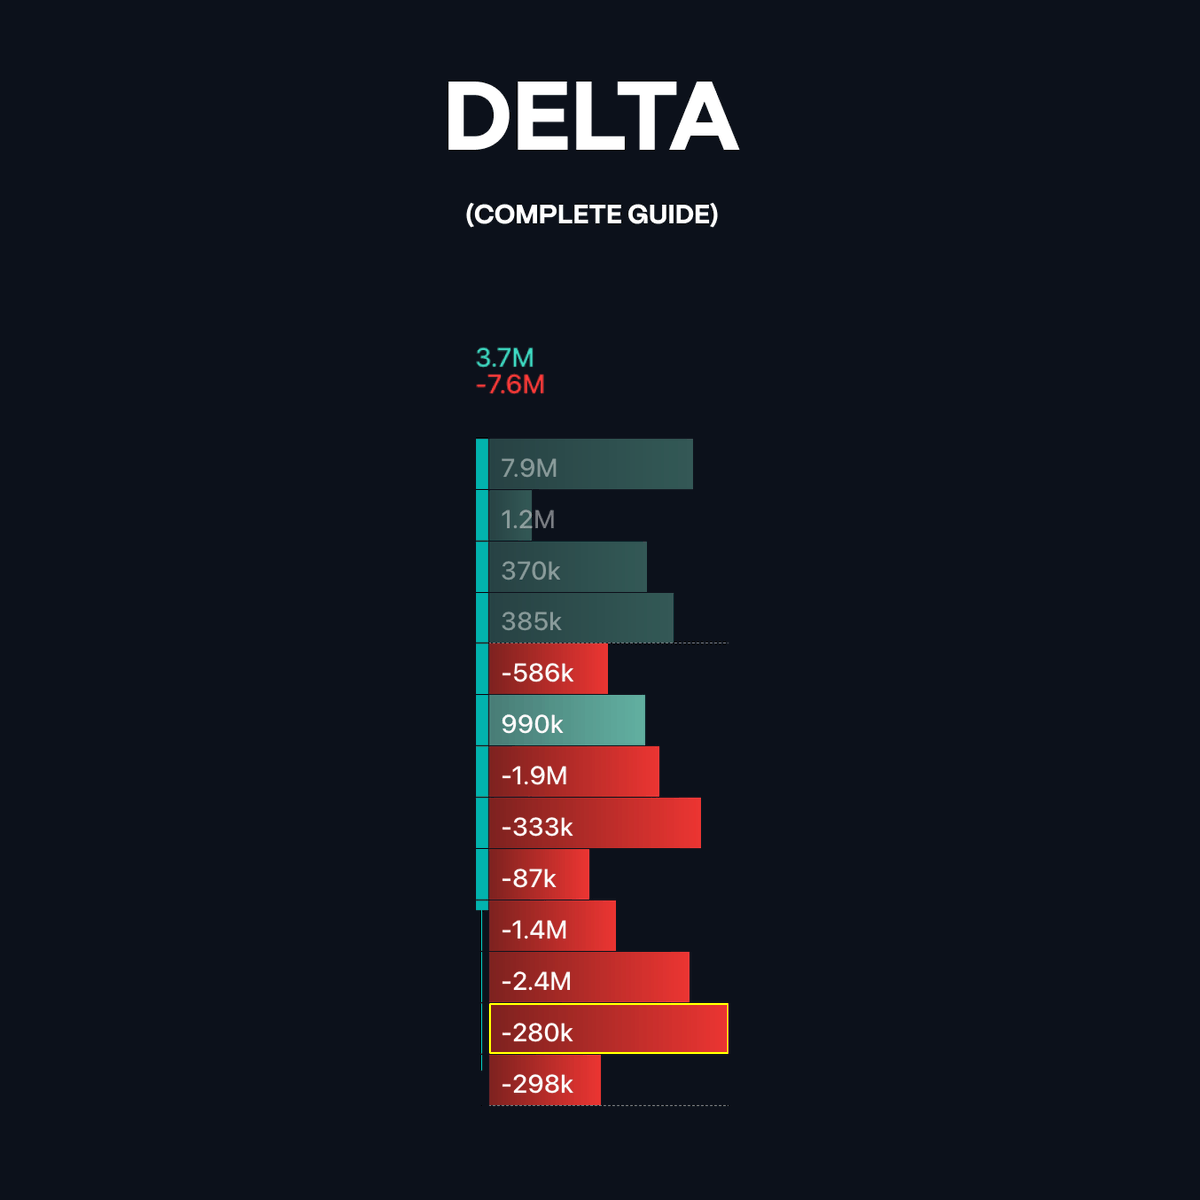
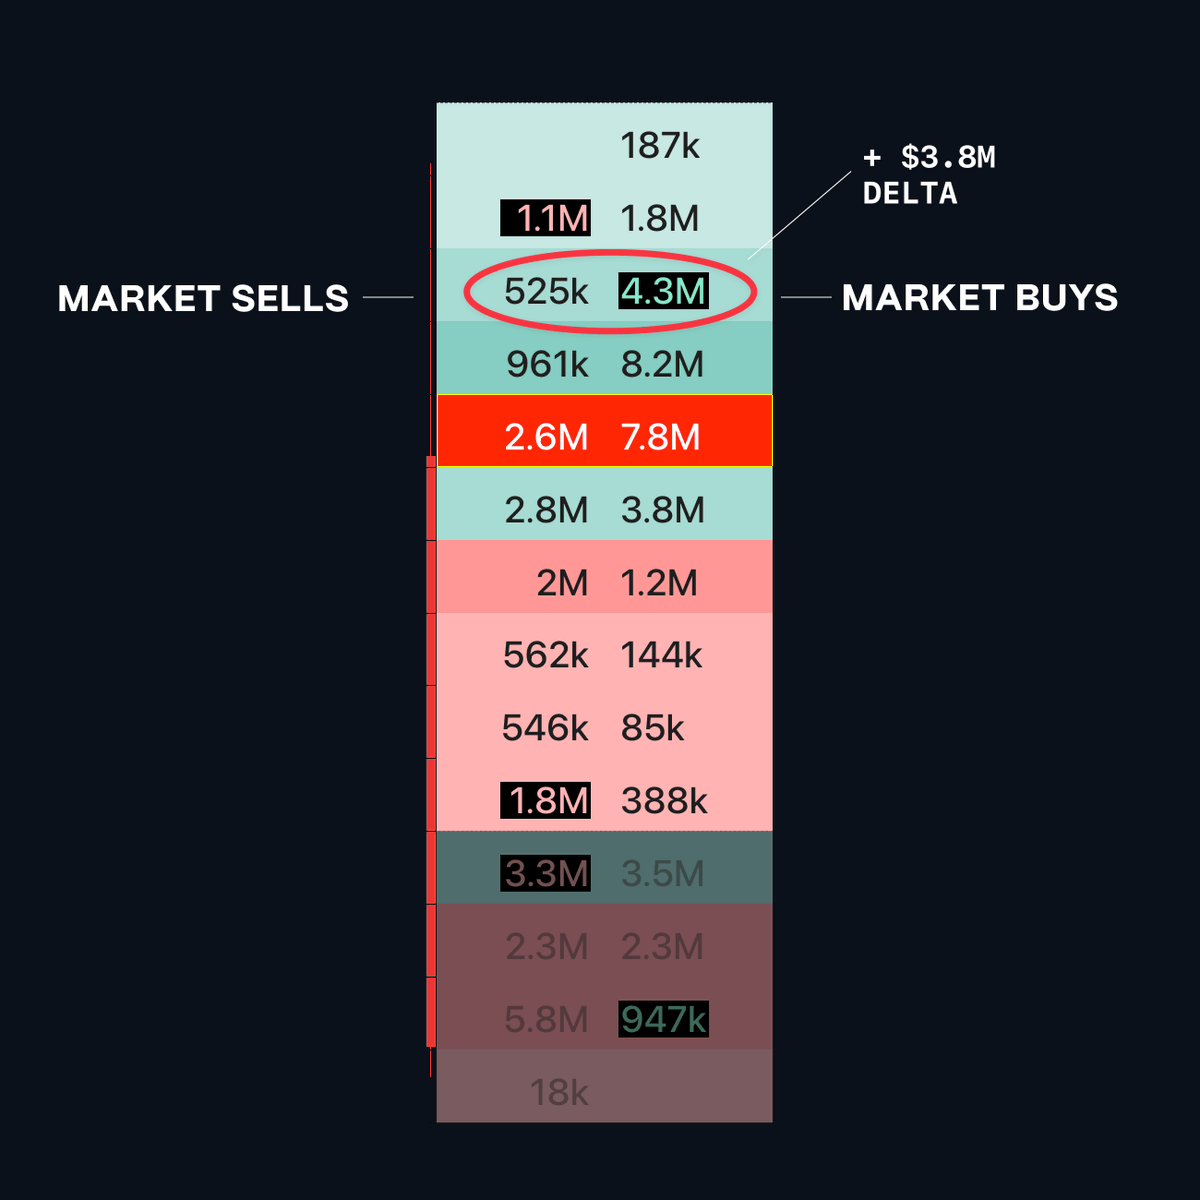
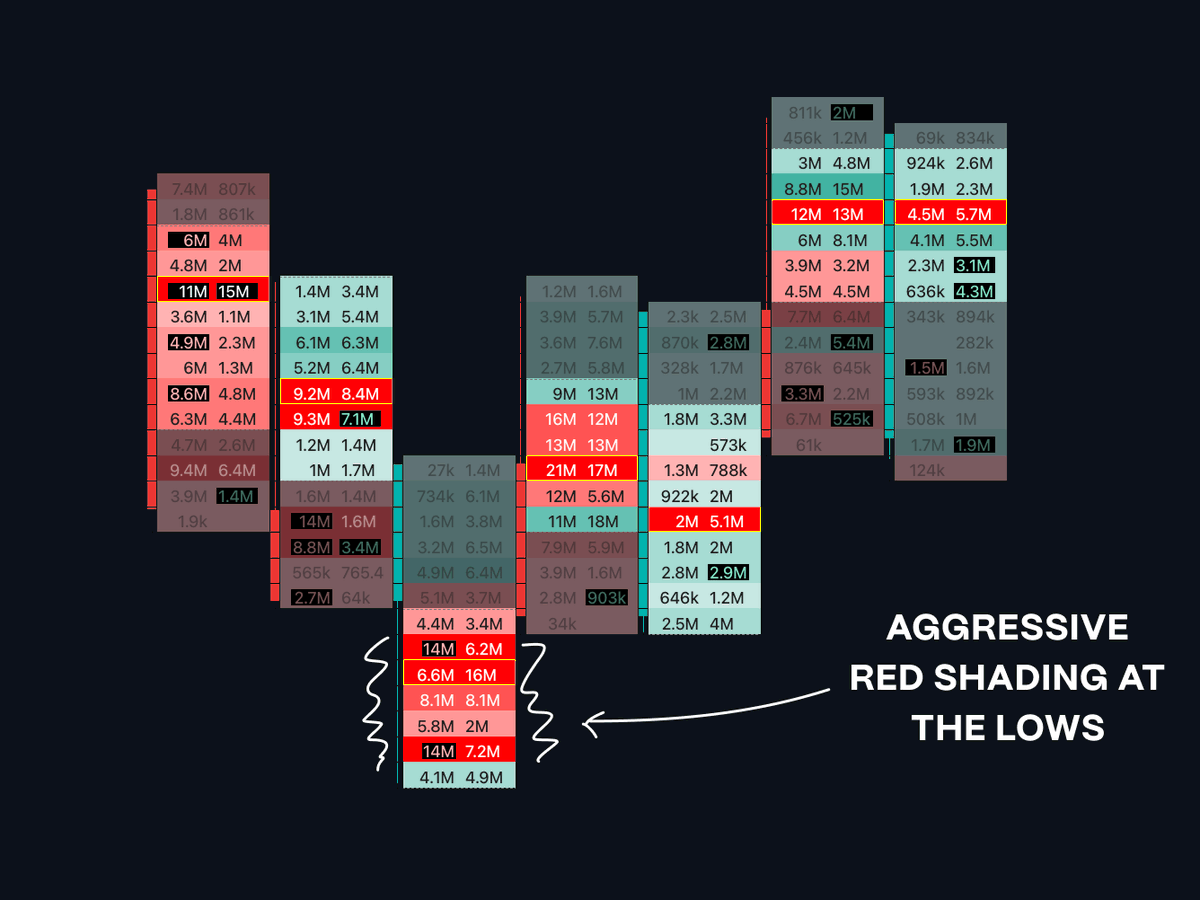
Orderflow & Footprint essentials
https://twitter.com/1468002736260235267/status/1770940317623075237
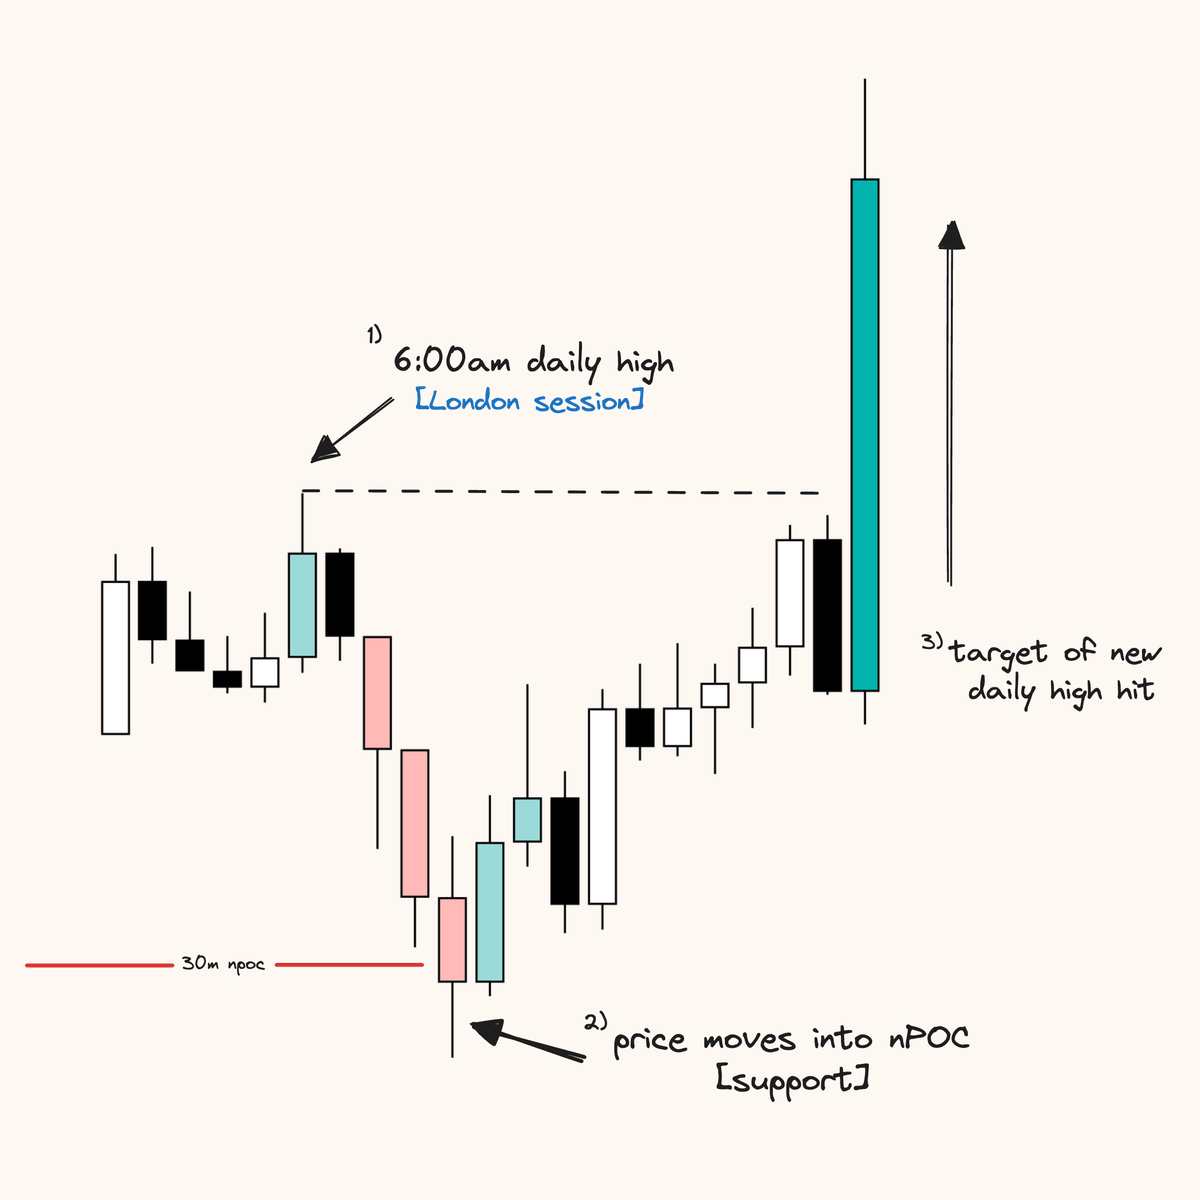
Entry triggers using Footprint charts
https://twitter.com/1468002736260235267/status/1779036177690927434
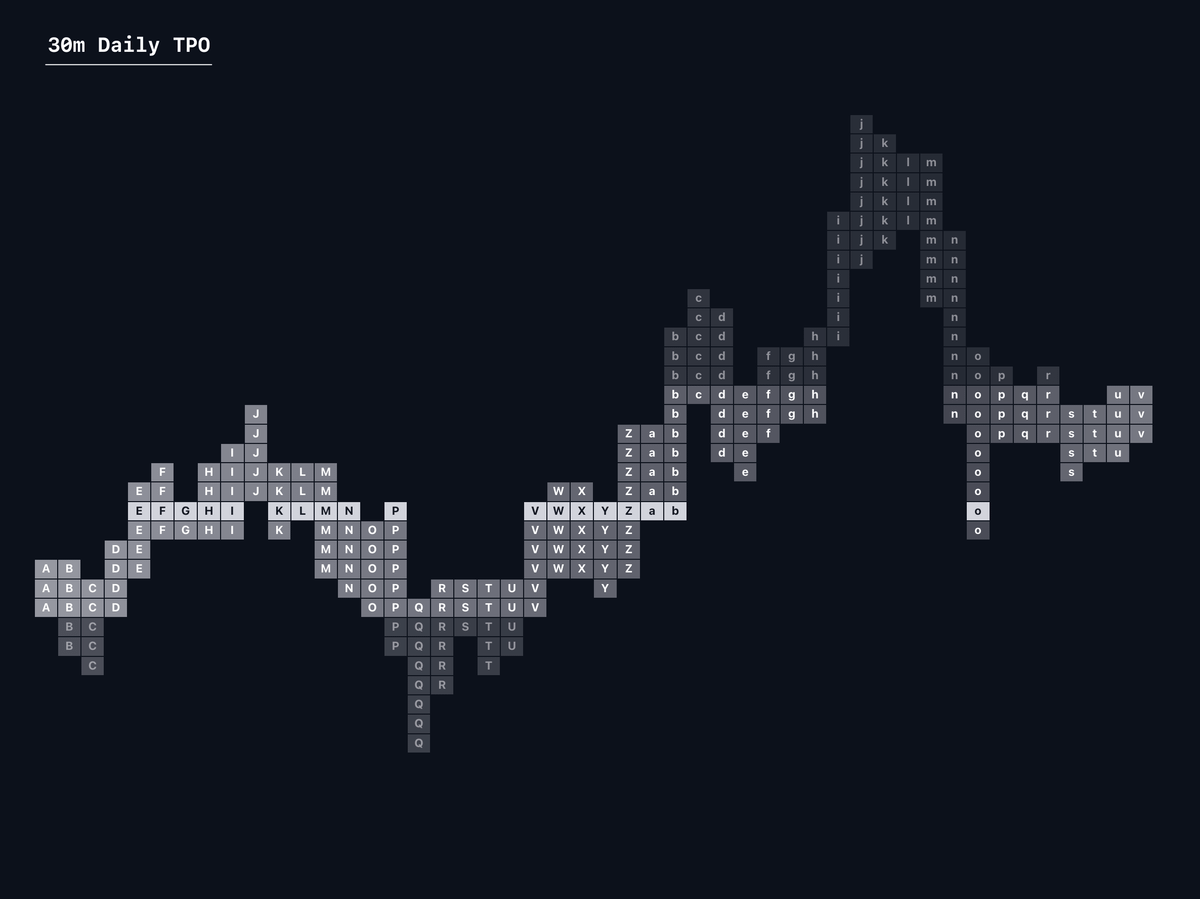
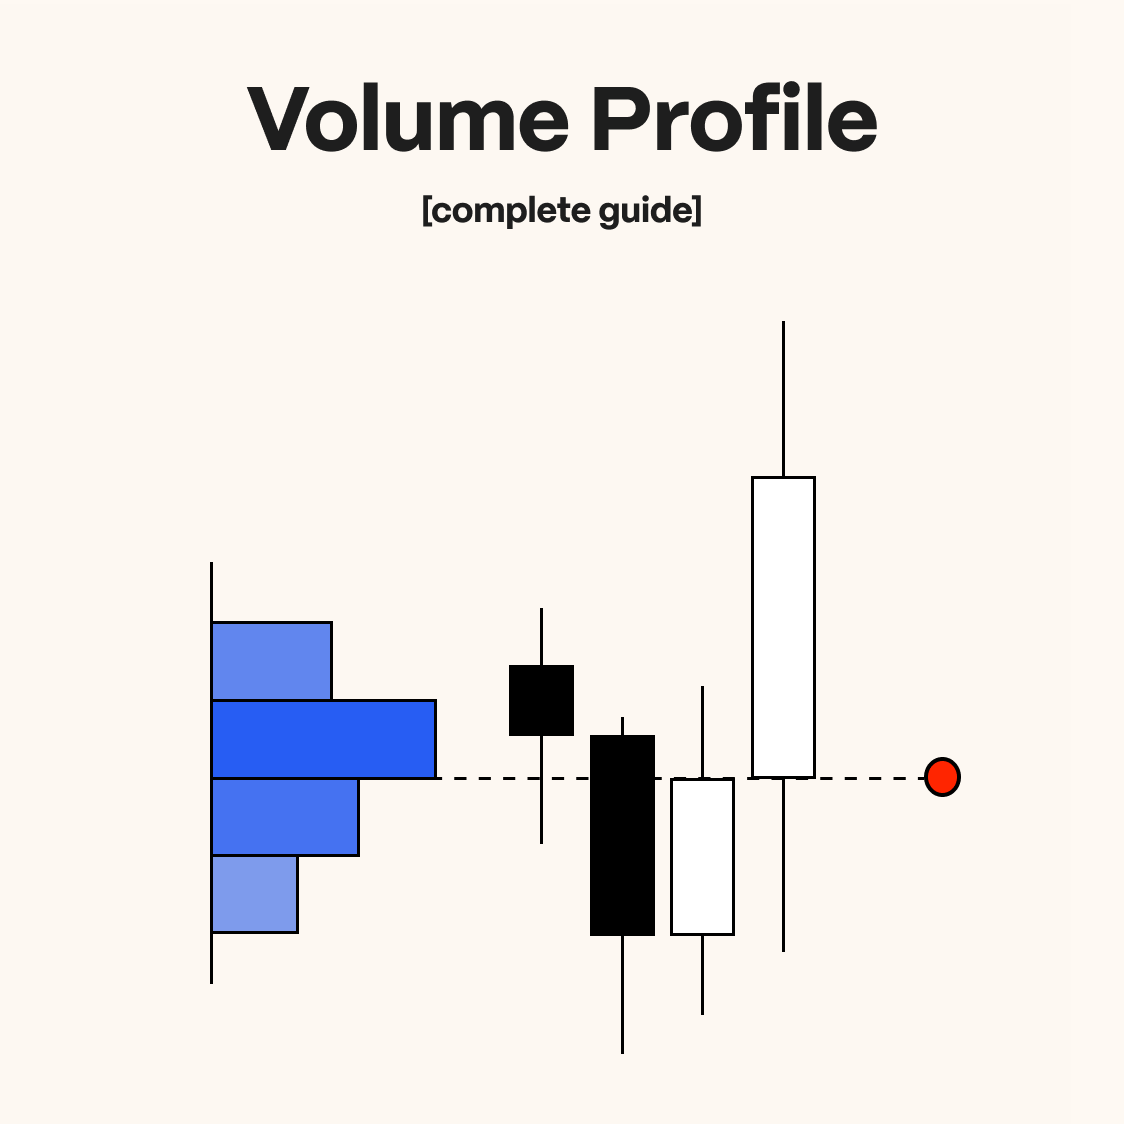
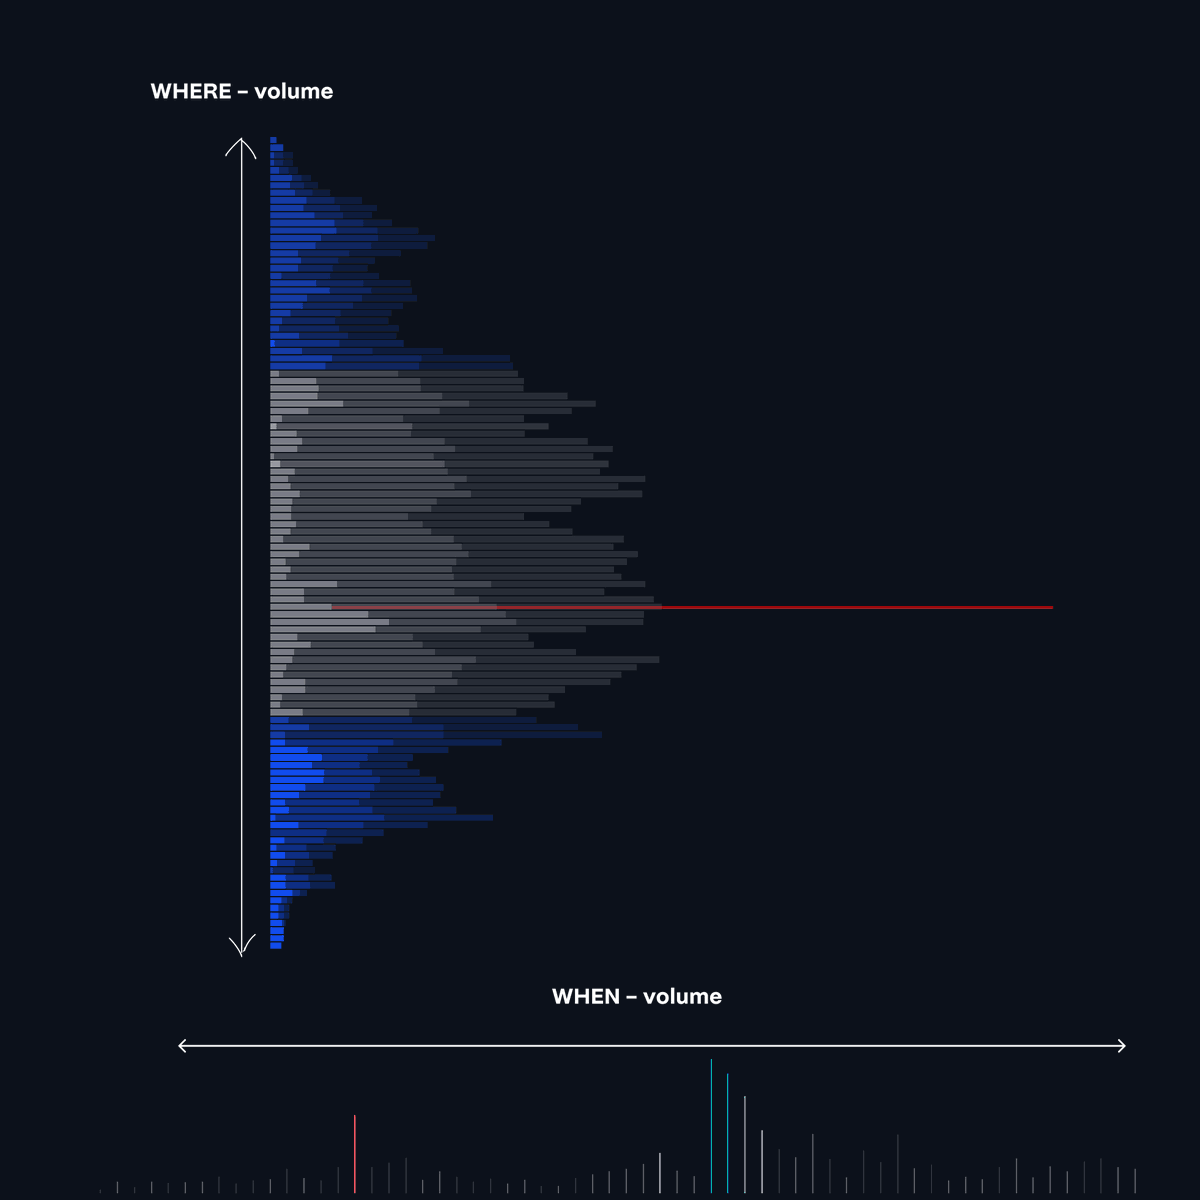
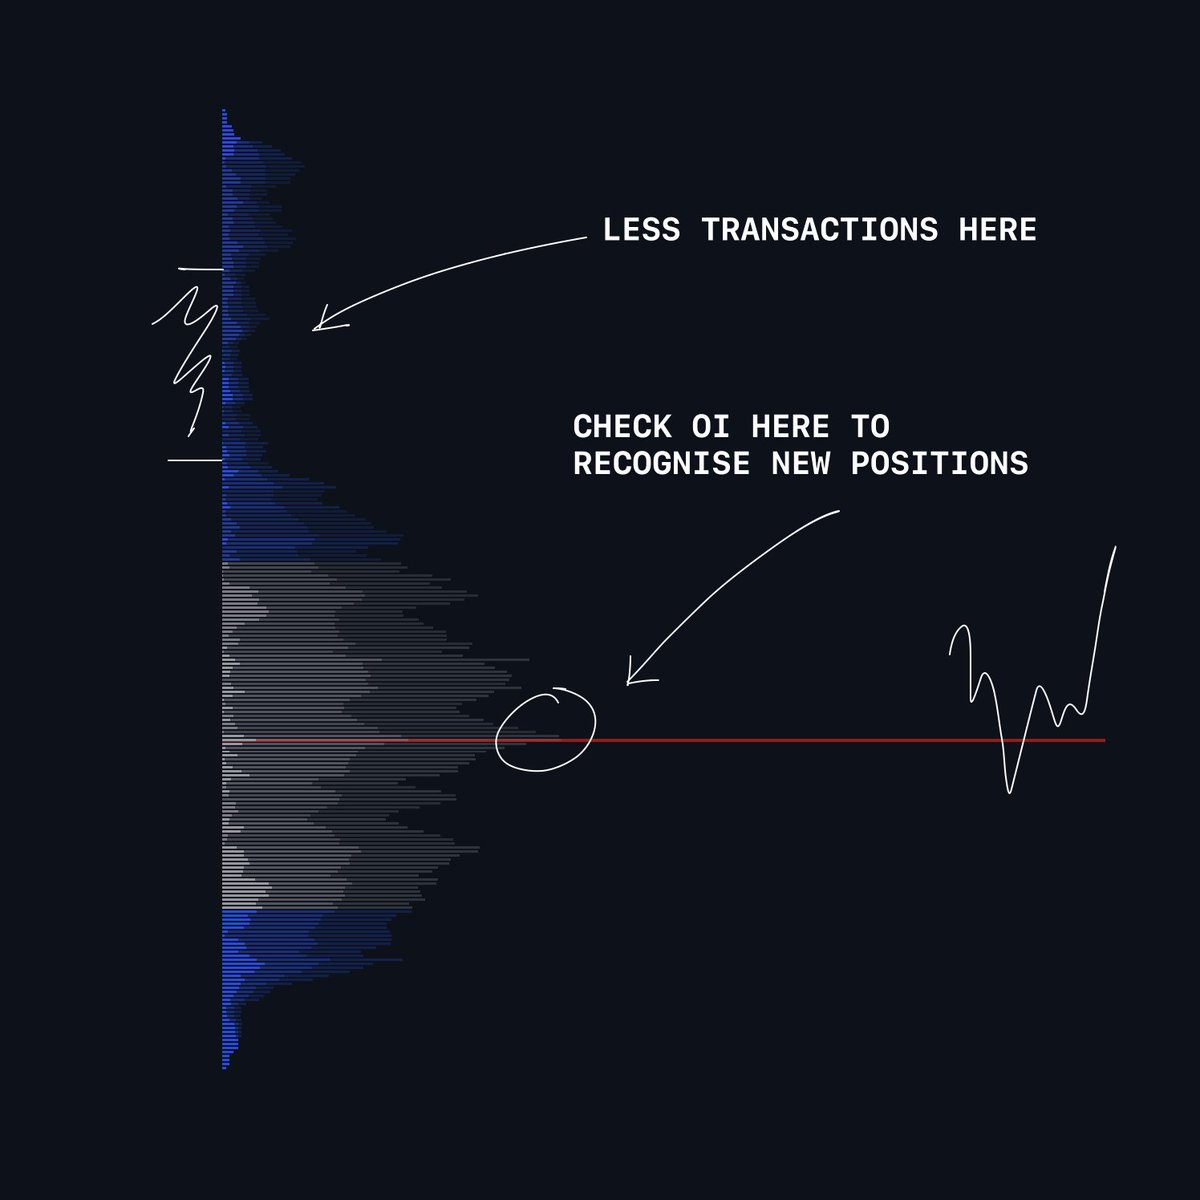
TPO & Market profile guide
https://twitter.com/1468002736260235267/status/1794307075960369272
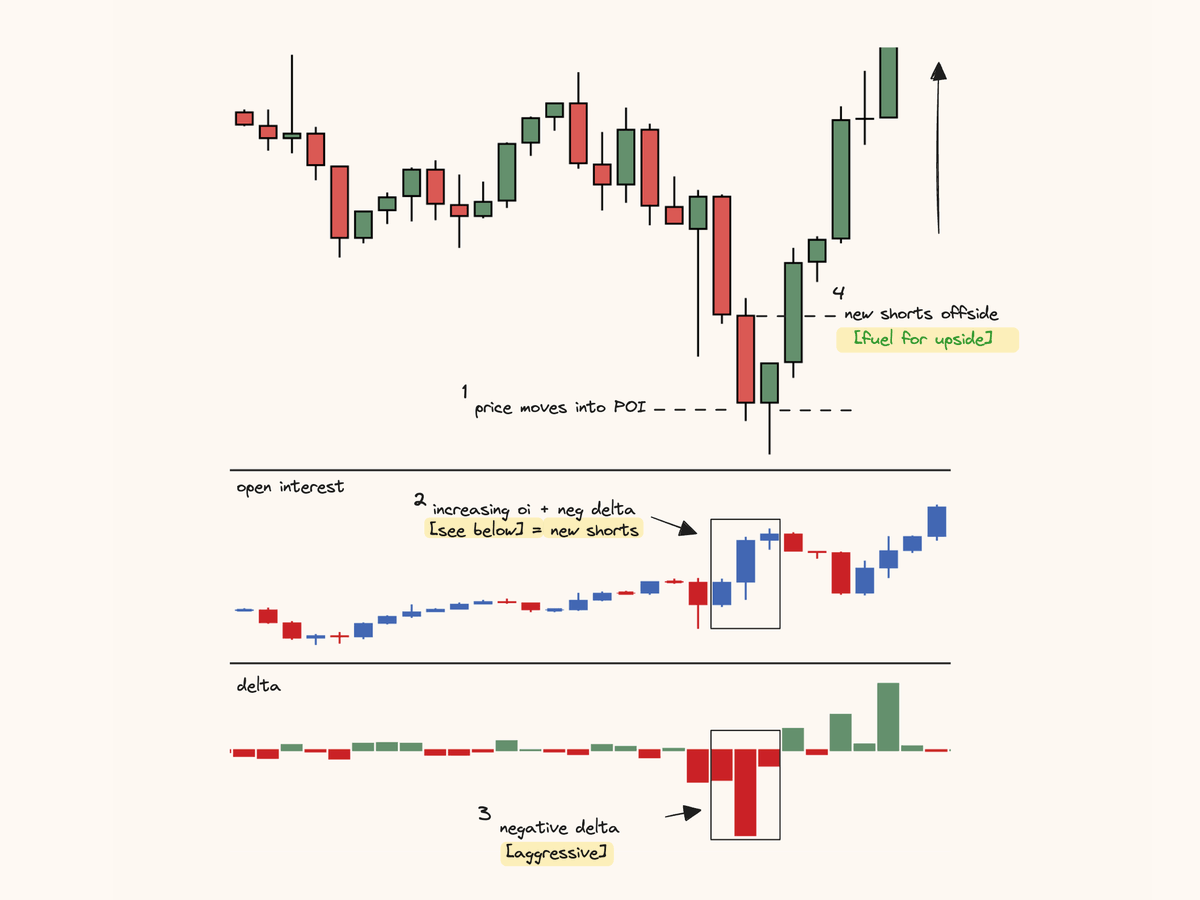
Trading with Onside Traders [footprint strategy]
https://twitter.com/1468002736260235267/status/1775801281342214488
All likes & reposts on the 1st post are appreciated.
If you find these useful be sure to bookmark 🔖 this thread for later.
Further materials [all free in my pinned post]
- footprint/tpo templates
- tradingview indicators list
- newsletter
- more videos [yt]
thank you again.
If you find these useful be sure to bookmark 🔖 this thread for later.
Further materials [all free in my pinned post]
- footprint/tpo templates
- tradingview indicators list
- newsletter
- more videos [yt]
thank you again.
• • •
Missing some Tweet in this thread? You can try to
force a refresh