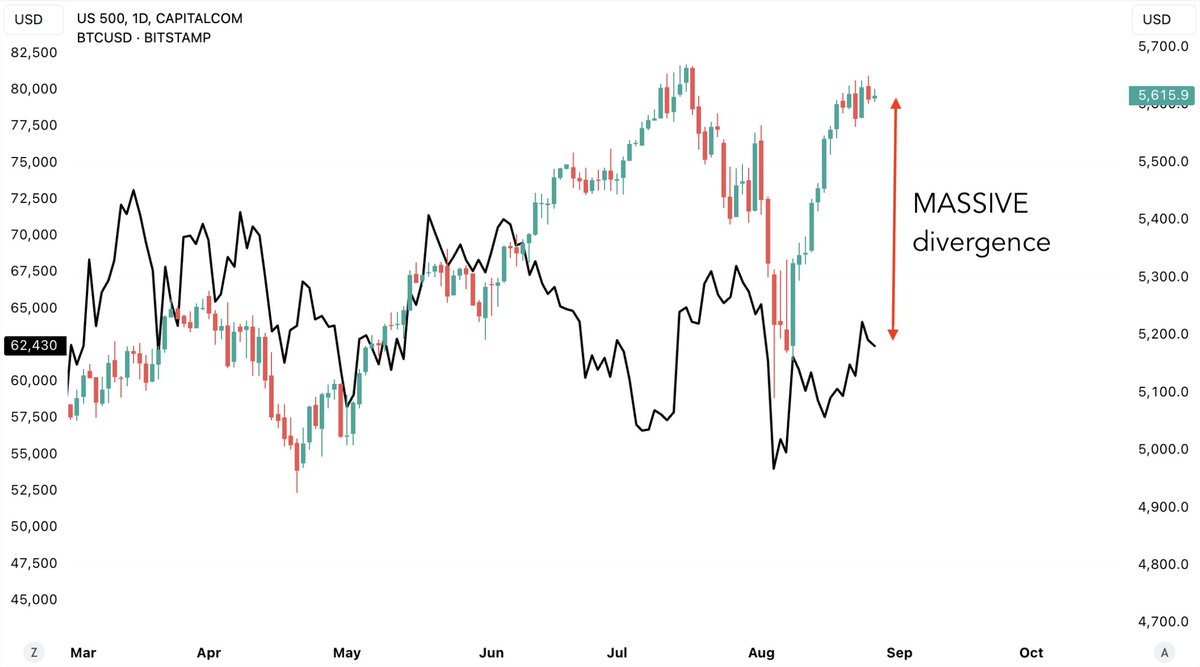
MASSIVE divergence between Bitcoin and stocks
What is happening?
A thread 🧵
What is happening?
A thread 🧵
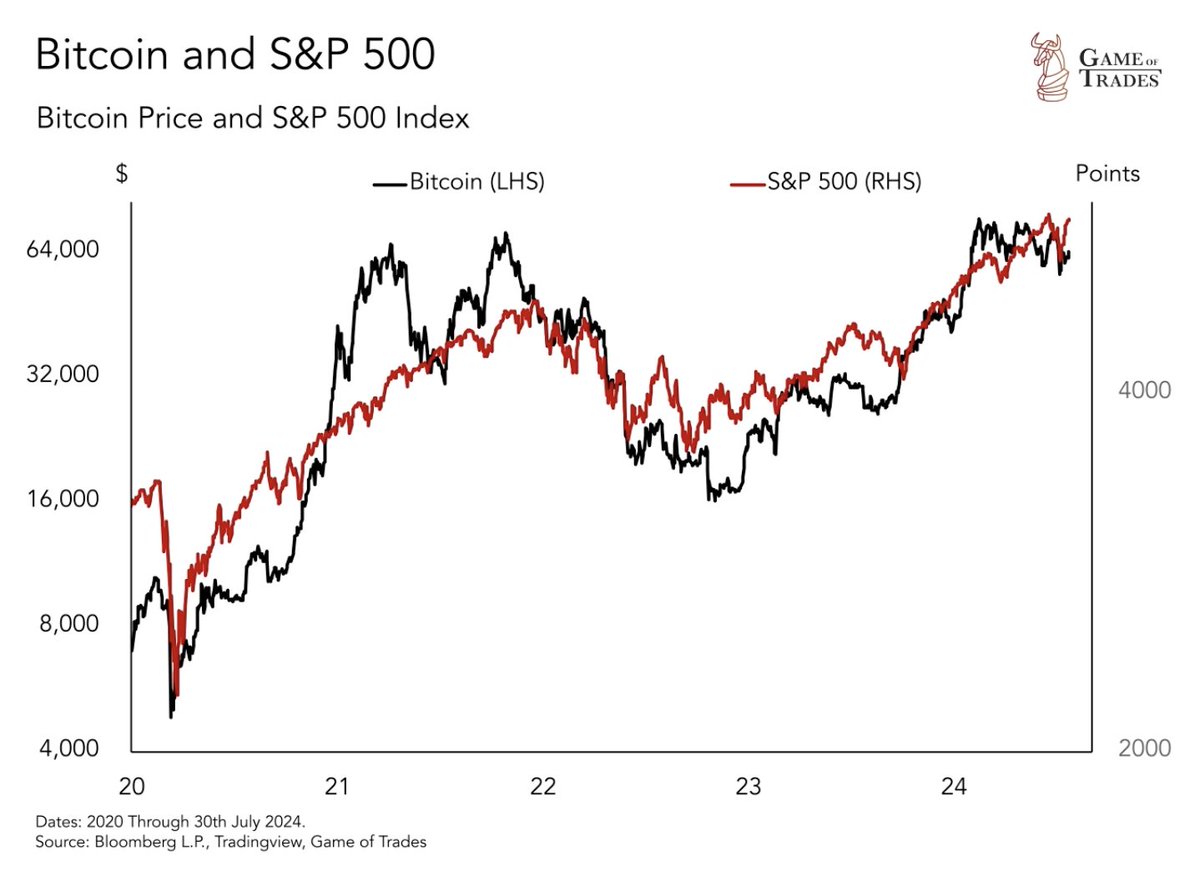
2/ Bitcoin’s trajectory typically mirrors that of the US stock market
When the S&P 500 rises, Bitcoin also climbs
Conversely, when the S&P 500 falls, Bitcoin follows suit
When the S&P 500 rises, Bitcoin also climbs
Conversely, when the S&P 500 falls, Bitcoin follows suit
3/ Bitcoin is influenced by the same factors as the stock market:
- Liquidity
- Risk-taking
- Investor optimism
- Liquidity
- Risk-taking
- Investor optimism

4/ That's why in August, when the market dropped 6% in 3 days due to recession fears
Bitcoin also fell around 30% in a short-time
Now, the market has recovered, trading near ATH’s
But, Bitcoin still remains significantly below its highs
Bitcoin also fell around 30% in a short-time
Now, the market has recovered, trading near ATH’s
But, Bitcoin still remains significantly below its highs

5/ We've discussed that the recent recession fears are likely temporary and the market's recovery was justified
Get access to 3 Premium Videos every week that cover our investment strategy
Join today and secure a 20% DISCOUNT at:
bit.ly/GameofTrades
Get access to 3 Premium Videos every week that cover our investment strategy
Join today and secure a 20% DISCOUNT at:
bit.ly/GameofTrades
6/ However, some argue that the rally is driven by a few companies, like Nvidia and Apple
Which masks the actual strength of the market
So, instead of looking at the S&P 500
Let’s consider RSP → an equal-weighted version of the S&P 500
Which masks the actual strength of the market
So, instead of looking at the S&P 500
Let’s consider RSP → an equal-weighted version of the S&P 500

7/ RSP recently:
- Broke above a downtrend line dating back to April
- Reached a new all-time high
- Has been consistently above key MA’s
This healthy structure indicates potential for further gains
- Broke above a downtrend line dating back to April
- Reached a new all-time high
- Has been consistently above key MA’s
This healthy structure indicates potential for further gains

8/ If the RSP moves higher, Bitcoin is likely to follow
Right now, there's a noticeable gap between Bitcoin and RSP
But this divergence could be similar to early 2024 when Bitcoin eventually caught up
Right now, there's a noticeable gap between Bitcoin and RSP
But this divergence could be similar to early 2024 when Bitcoin eventually caught up

9/ View all our closed crypto trades for FREE on our website
We actively scan the crypto market for attractive opportunities
Large volatility brings the potential for massive returns
But only if you manage your risk well
We actively scan the crypto market for attractive opportunities
Large volatility brings the potential for massive returns
But only if you manage your risk well
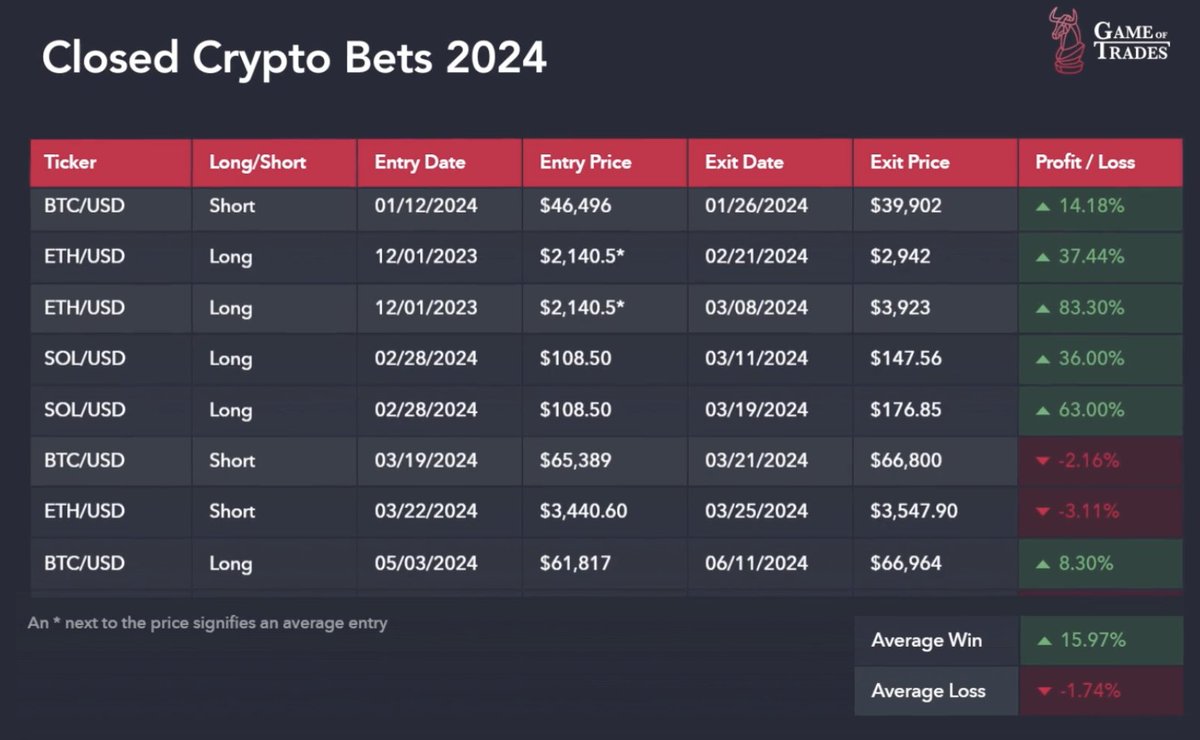
10/ Our strict & selective crypto trading has brought success to our clients
In 2024, our avg. crypto win is 15.97% and avg. crypto loss is only 1.74%
Get 20% OFF your membership today to get all our real-time Crypto and other assets’ Trade Alerts at:
bit.ly/GameofTrades
In 2024, our avg. crypto win is 15.97% and avg. crypto loss is only 1.74%
Get 20% OFF your membership today to get all our real-time Crypto and other assets’ Trade Alerts at:
bit.ly/GameofTrades
11/ Thanks for reading!
If you enjoyed this thread, please ❤️ and 🔁 the first tweet below
And follow @gameoftrades_ for more market insights, finance and investment strategies
If you enjoyed this thread, please ❤️ and 🔁 the first tweet below
And follow @gameoftrades_ for more market insights, finance and investment strategies
https://x.com/GameofTrades_/status/1828415996329390464
• • •
Missing some Tweet in this thread? You can try to
force a refresh