In this THREAD I will explain PO3 and how to trade it:
1. Accumulation, Distribution and Manipulation
2. Bearish PO3
3. Bullish PO3
4. Formation of PO3
🧵(1/8)
1. Accumulation, Distribution and Manipulation
2. Bearish PO3
3. Bullish PO3
4. Formation of PO3
🧵(1/8)
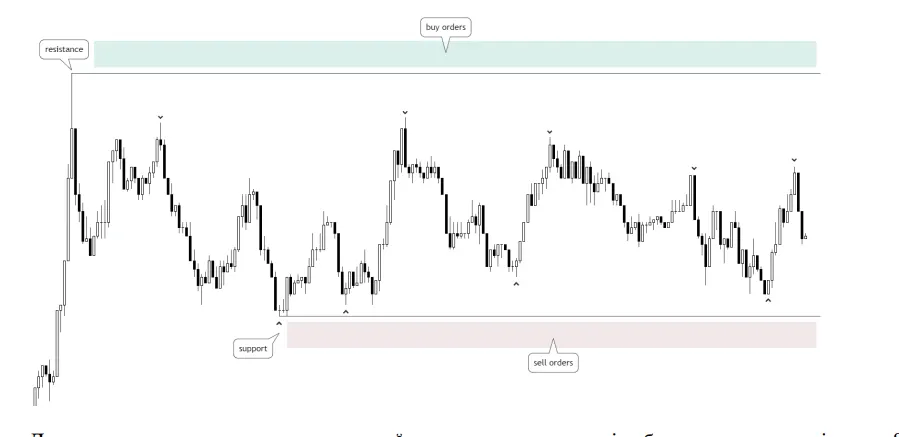
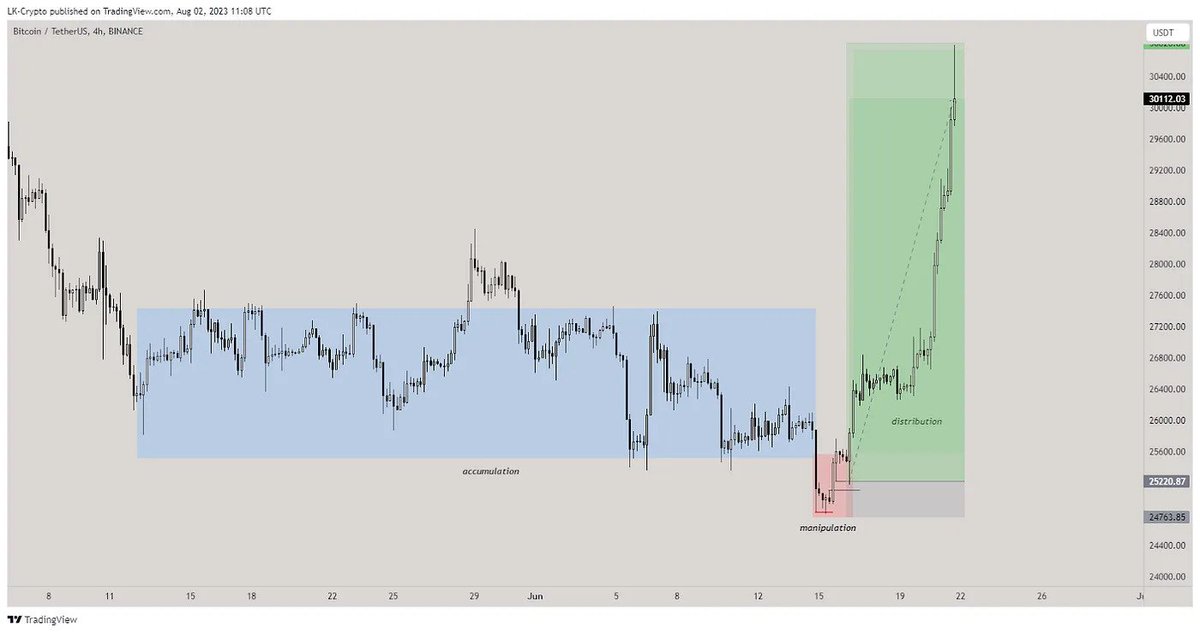
1. Accumulation
During this phase, large institutional traders and MM begin to build positions in anticipation of future price movements.
This stage creates a base of support or resistance.
During this phase, large institutional traders and MM begin to build positions in anticipation of future price movements.
This stage creates a base of support or resistance.
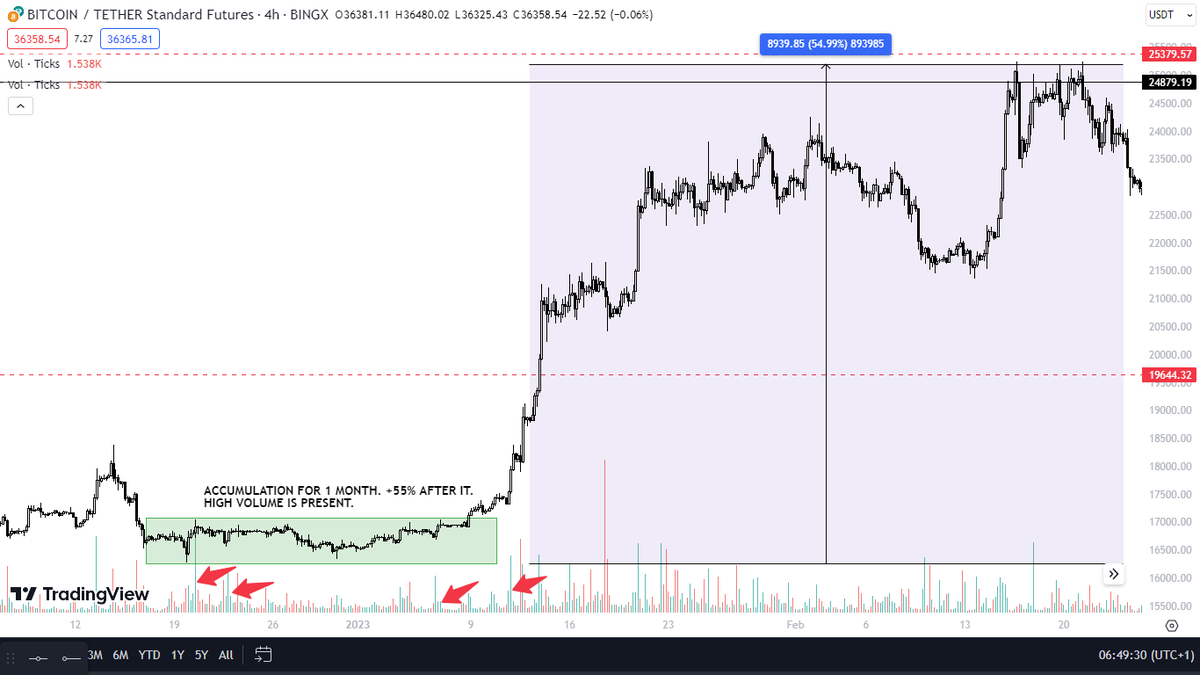
1.2 Distribution
The distribution phase is where the large players who accumulated positions begin to sell.
A clear trend begins to emerge in the direction of the institutional traders’ positions.
Trading volume typically increases as more market participants join the trend.
The distribution phase is where the large players who accumulated positions begin to sell.
A clear trend begins to emerge in the direction of the institutional traders’ positions.
Trading volume typically increases as more market participants join the trend.
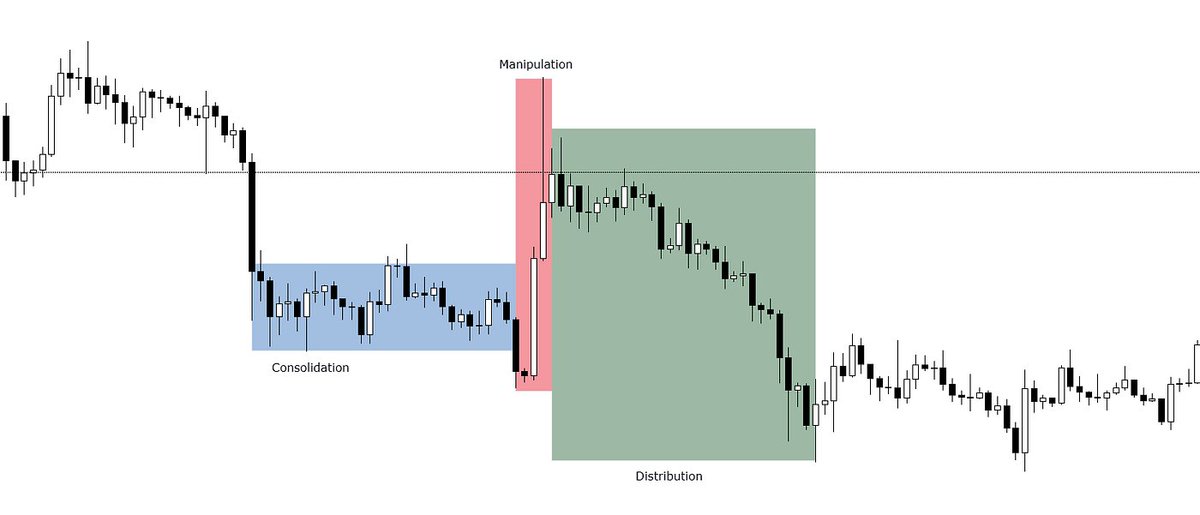
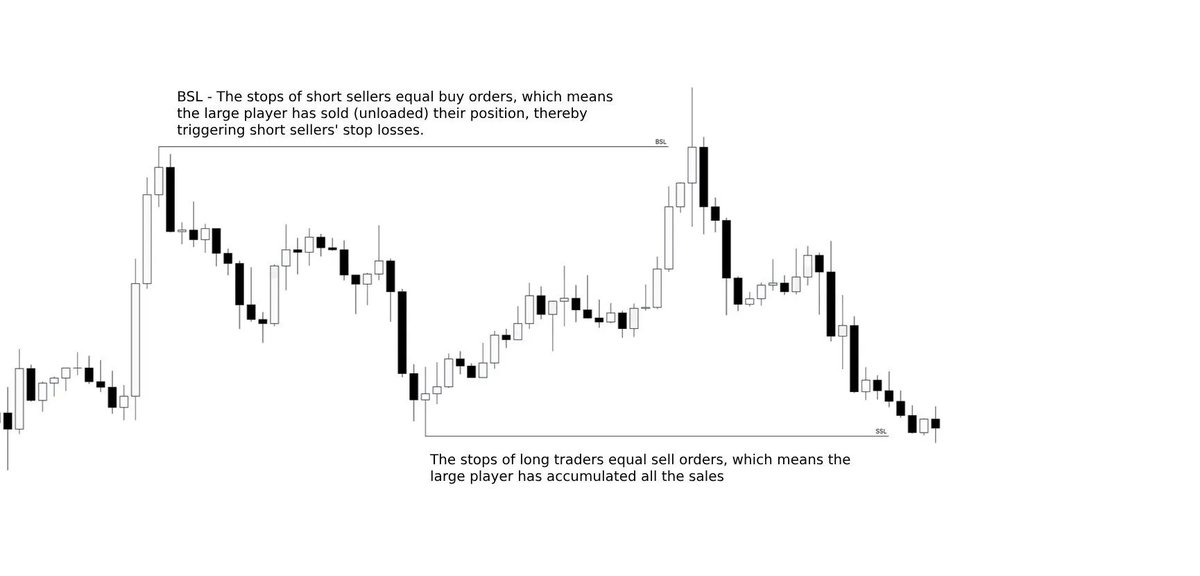
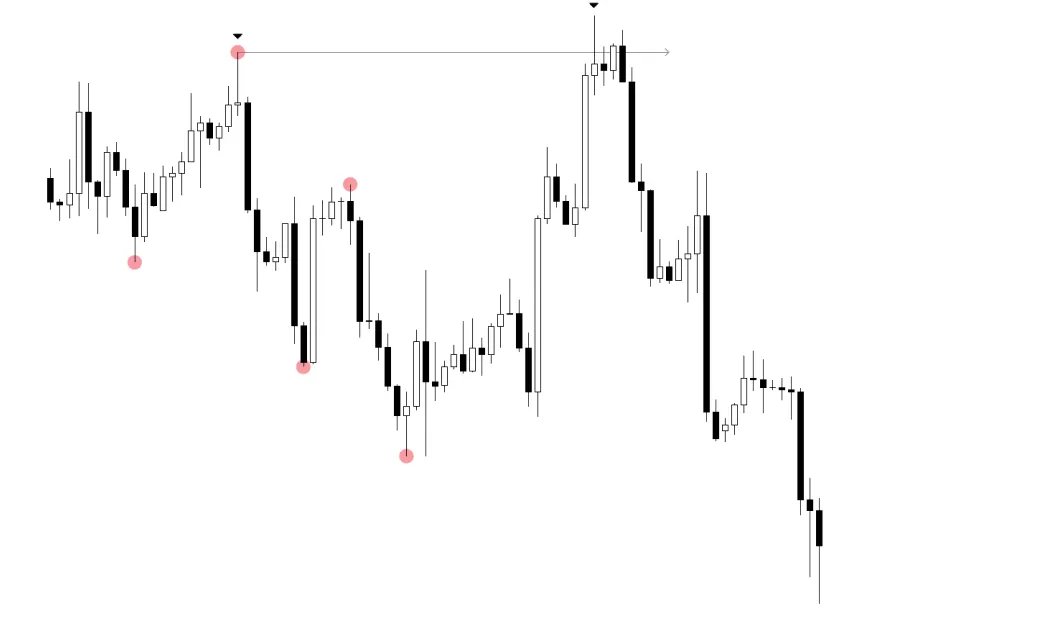
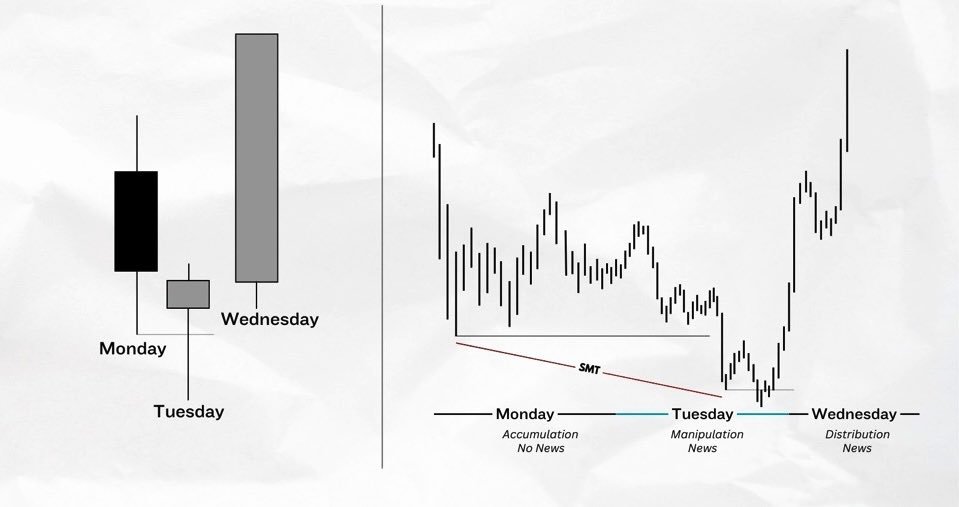
1.3 Manipulation
The Manipulation phase is where the market becomes more volatile and unpredictable.
During this phase, large players attempt to move the price.
In a way that triggers retail traders’ SL and creates liquidity for their larger positions.
The Manipulation phase is where the market becomes more volatile and unpredictable.
During this phase, large players attempt to move the price.
In a way that triggers retail traders’ SL and creates liquidity for their larger positions.
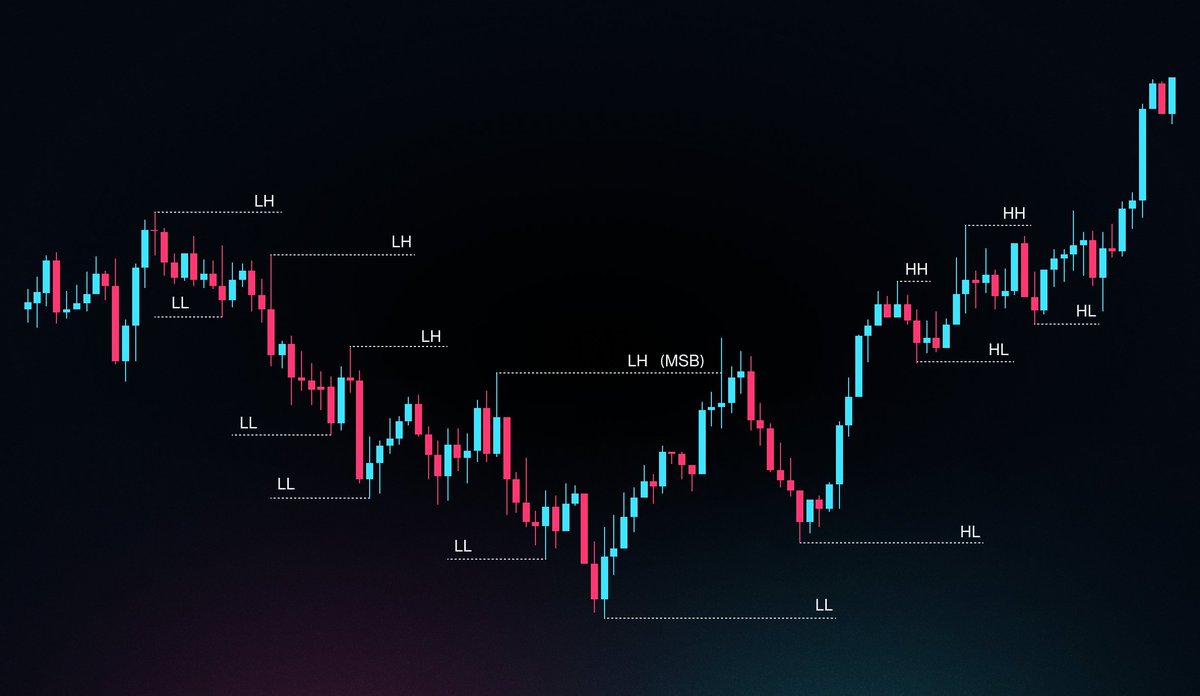
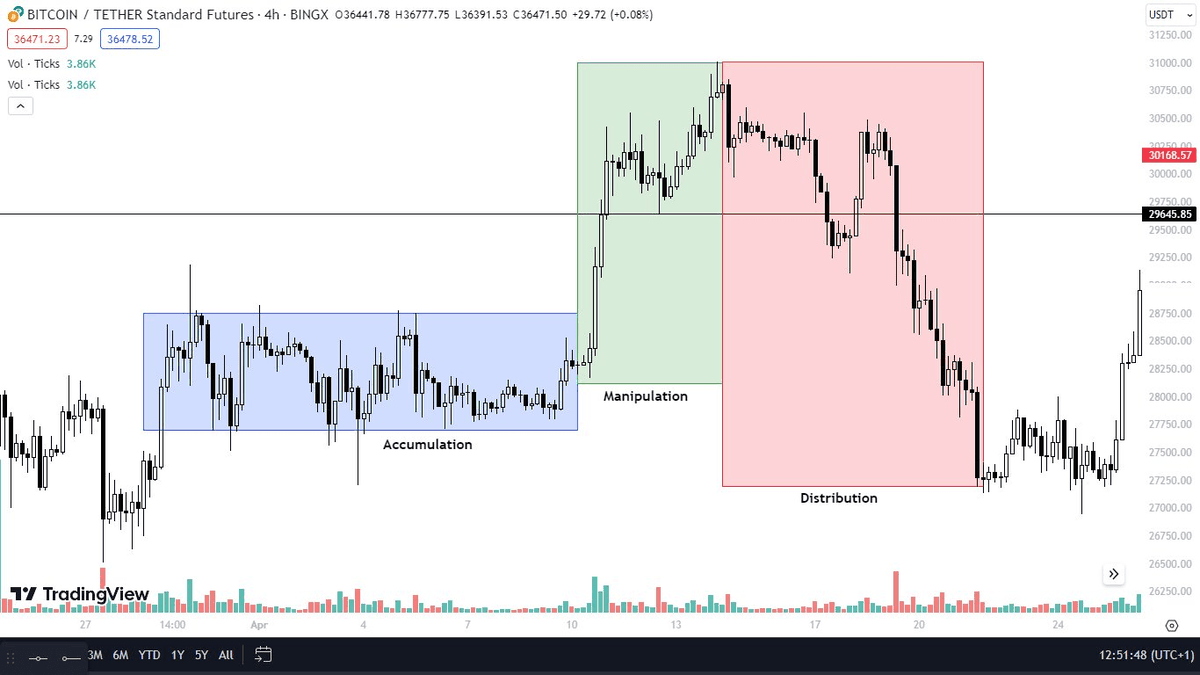
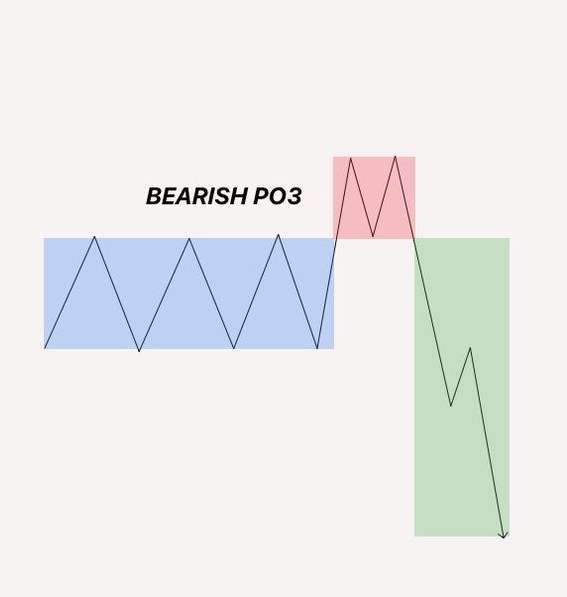
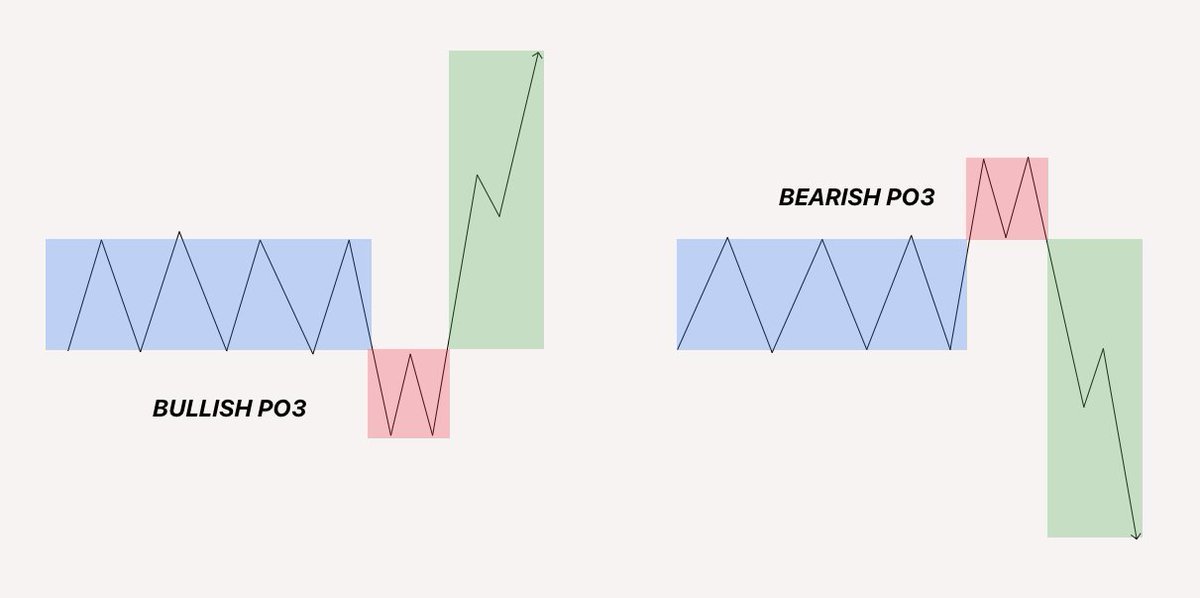
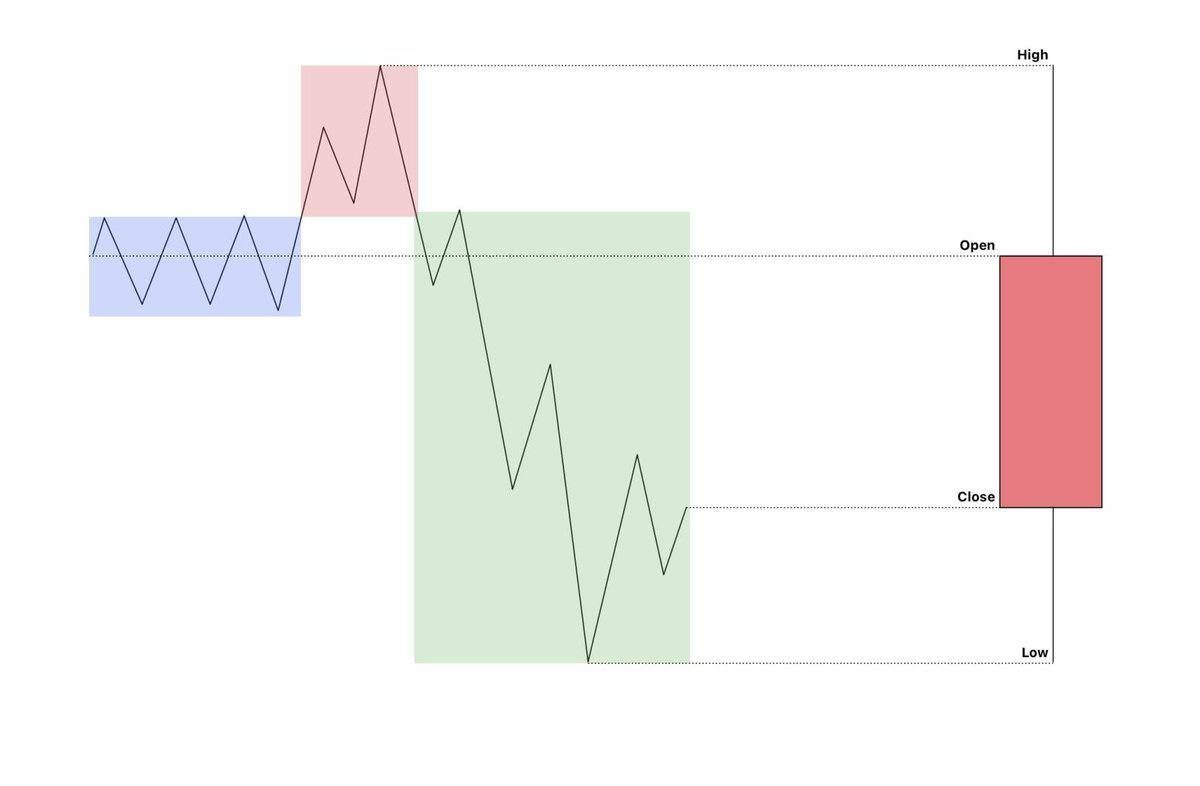
2. Bearish PO3
Bearish PO3 is conformed by:
1. Accumulation: The price enters in a range
2. Manipulation: The price aggressively rallies above the range, creating liquidity above last highs
3. Distribution: Price expands downwards, breaking the MS with strong bearish candles
Bearish PO3 is conformed by:
1. Accumulation: The price enters in a range
2. Manipulation: The price aggressively rallies above the range, creating liquidity above last highs
3. Distribution: Price expands downwards, breaking the MS with strong bearish candles
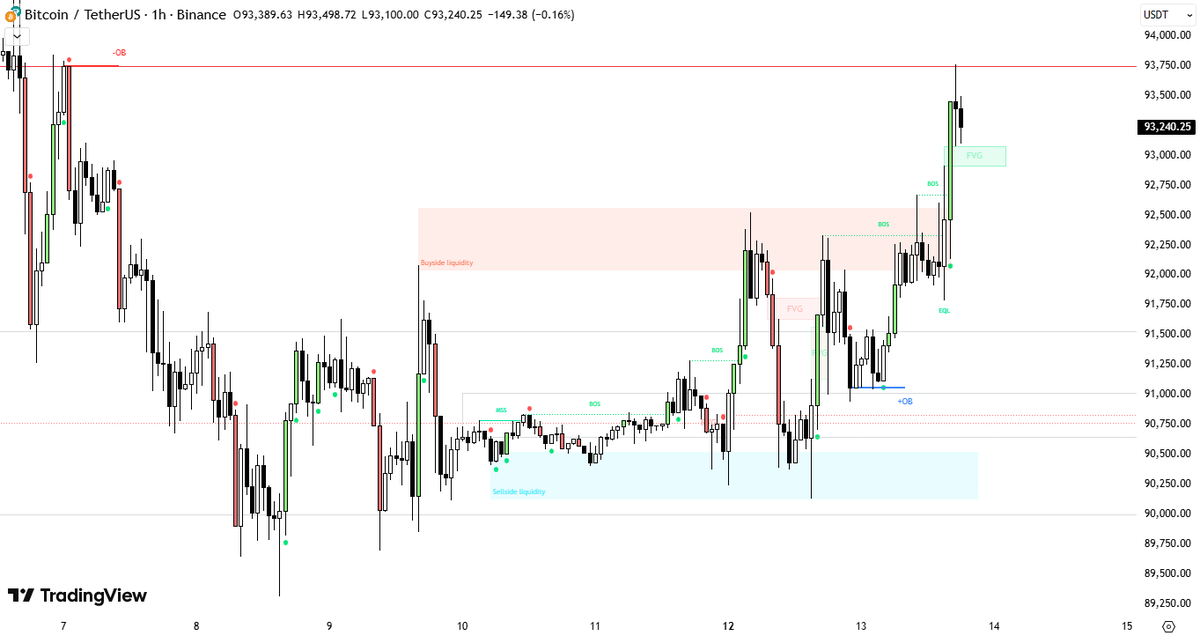
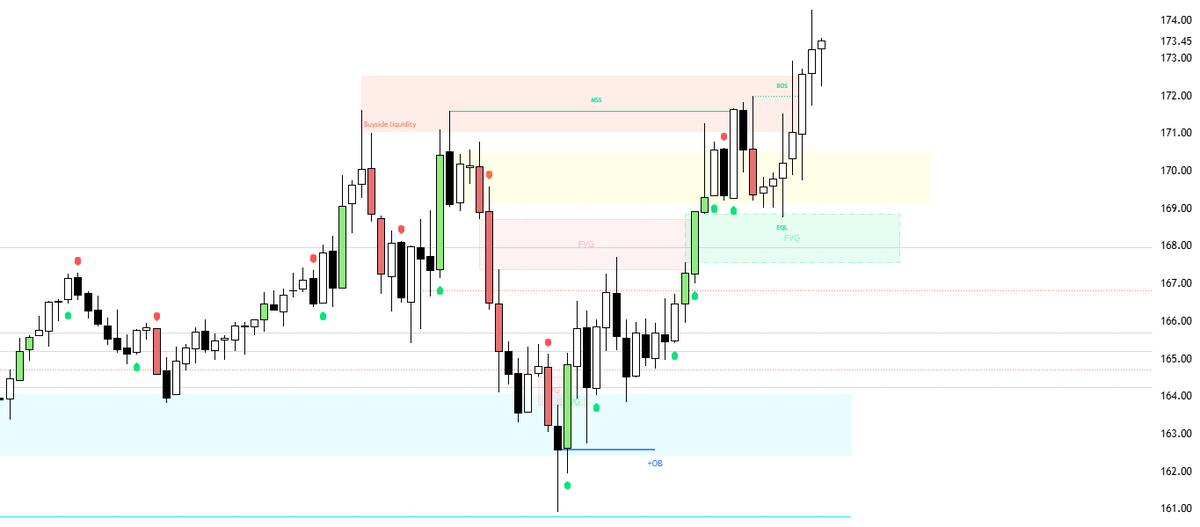
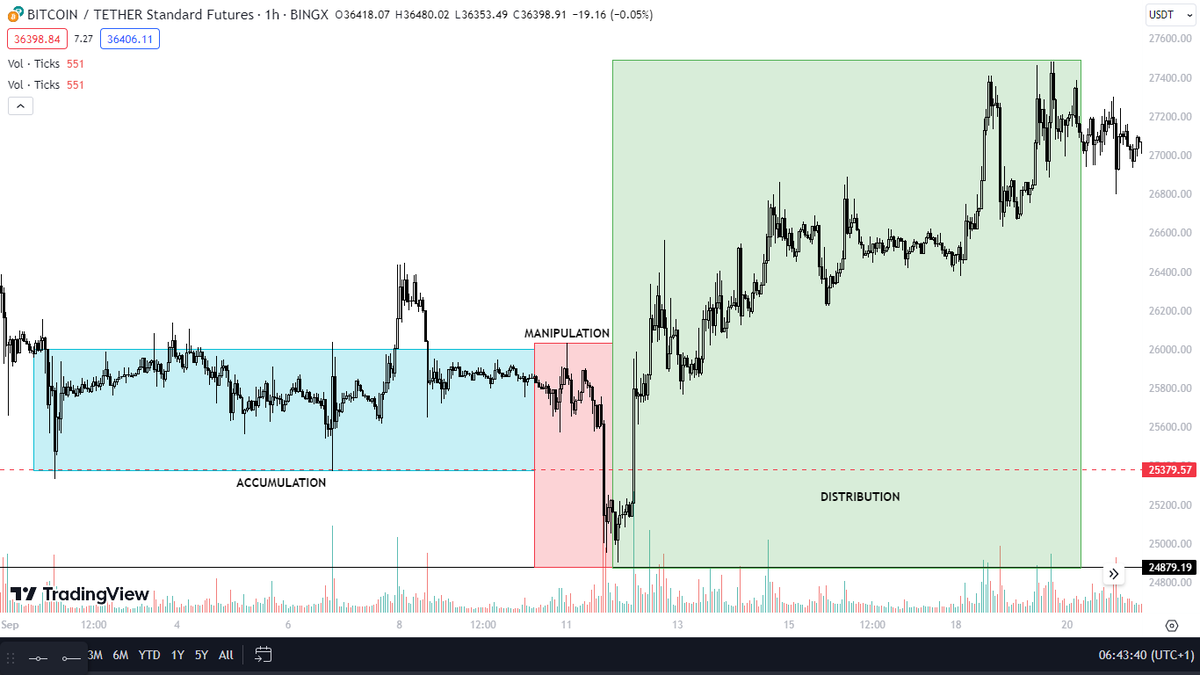
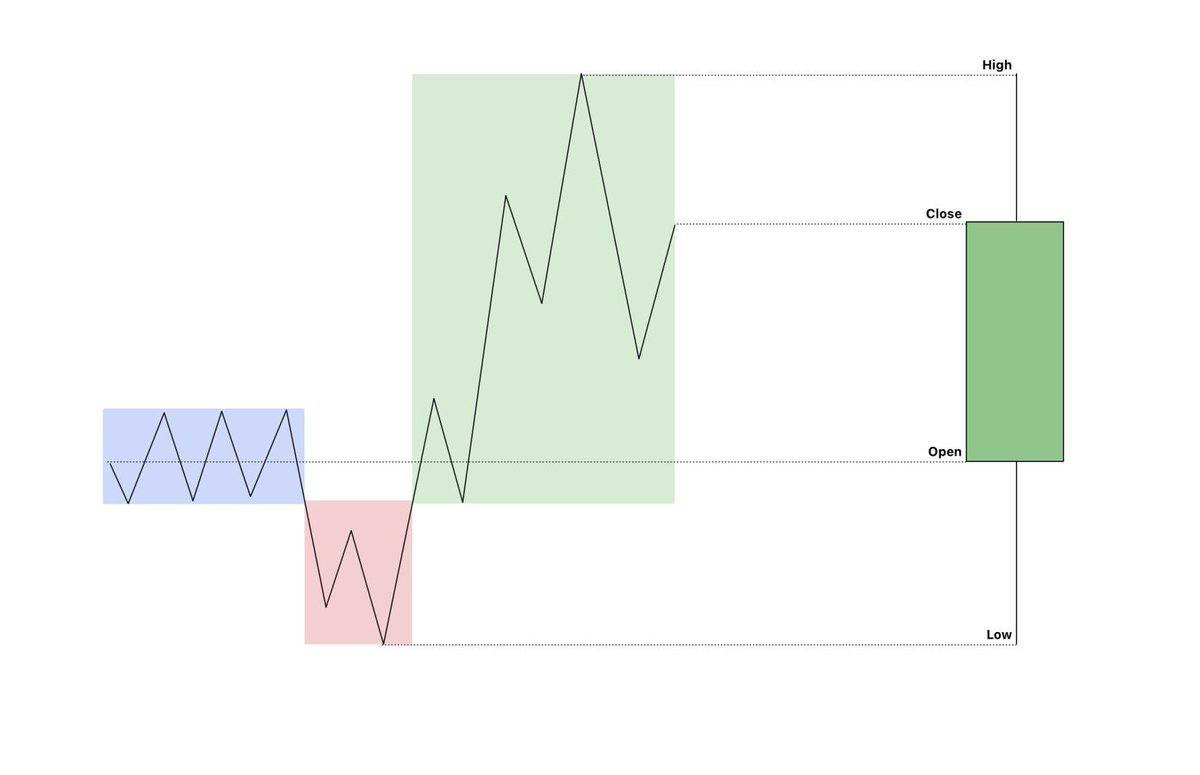
2.1 Bullish PO3
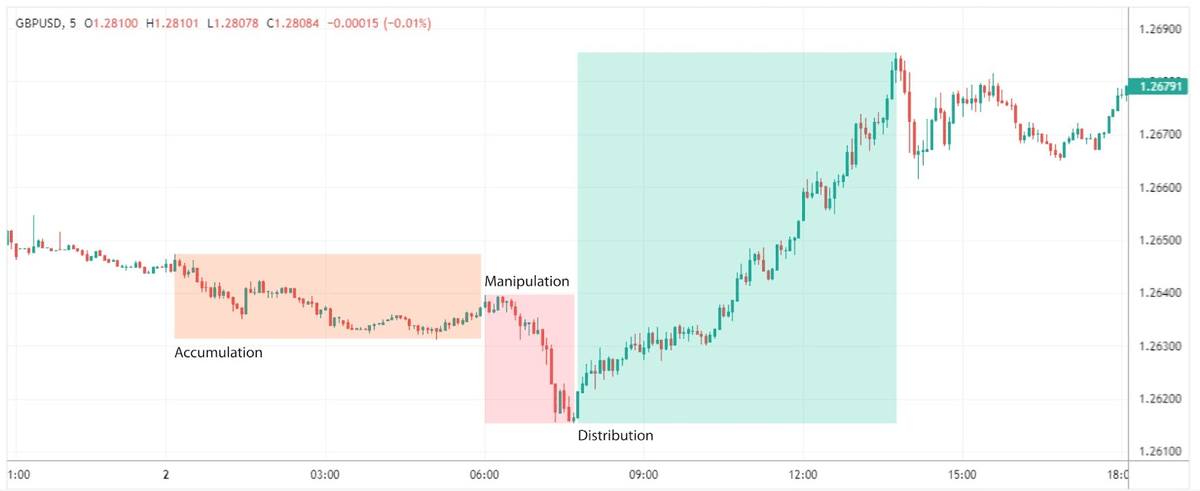
Bullish PO3 is conformed by:
1. Accumulation: Longs are building up and price is in a range
2. Manipulation: Market sells of below the range, creating liquidity
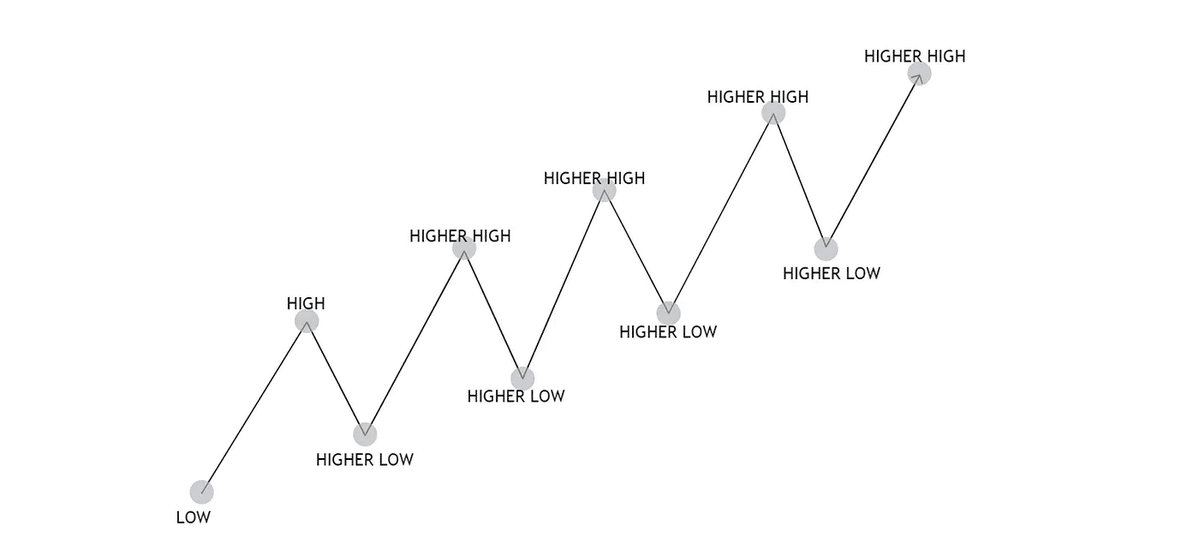
3. Distribution: Price expands upwards, breaking MS with strong bullish candles and bullish volume
Bullish PO3 is conformed by:
1. Accumulation: Longs are building up and price is in a range
2. Manipulation: Market sells of below the range, creating liquidity
3. Distribution: Price expands upwards, breaking MS with strong bullish candles and bullish volume
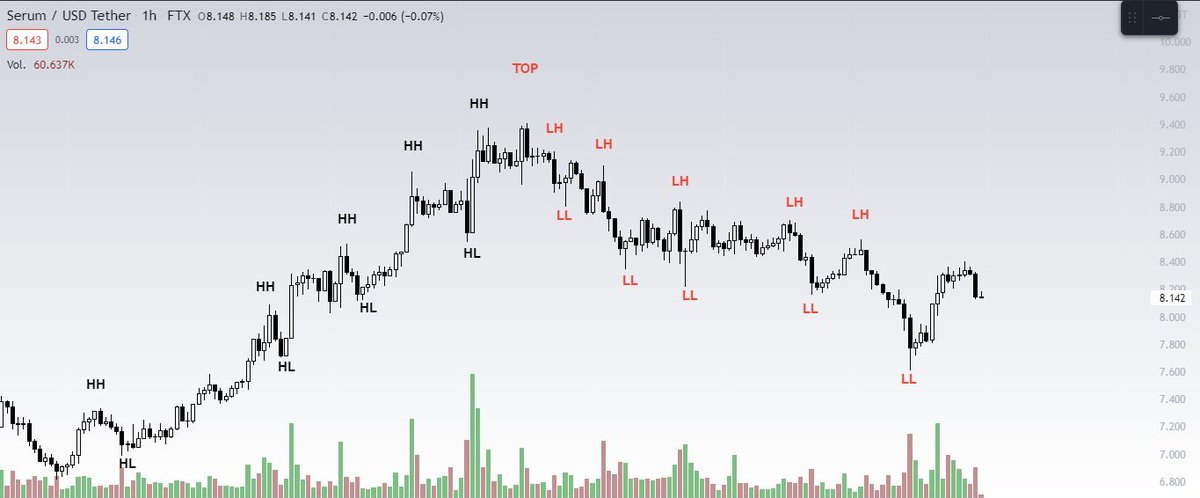
4. Formation of PO3
As you already know, we can categorize PO3 in Bullish or Bearish.
This are the formations of each one of them. Study how price is formed.
Memorize this market structures.
As you already know, we can categorize PO3 in Bullish or Bearish.
This are the formations of each one of them. Study how price is formed.
Memorize this market structures.
I hope this THREAD has helped you to understand PO3 (Power of 3)
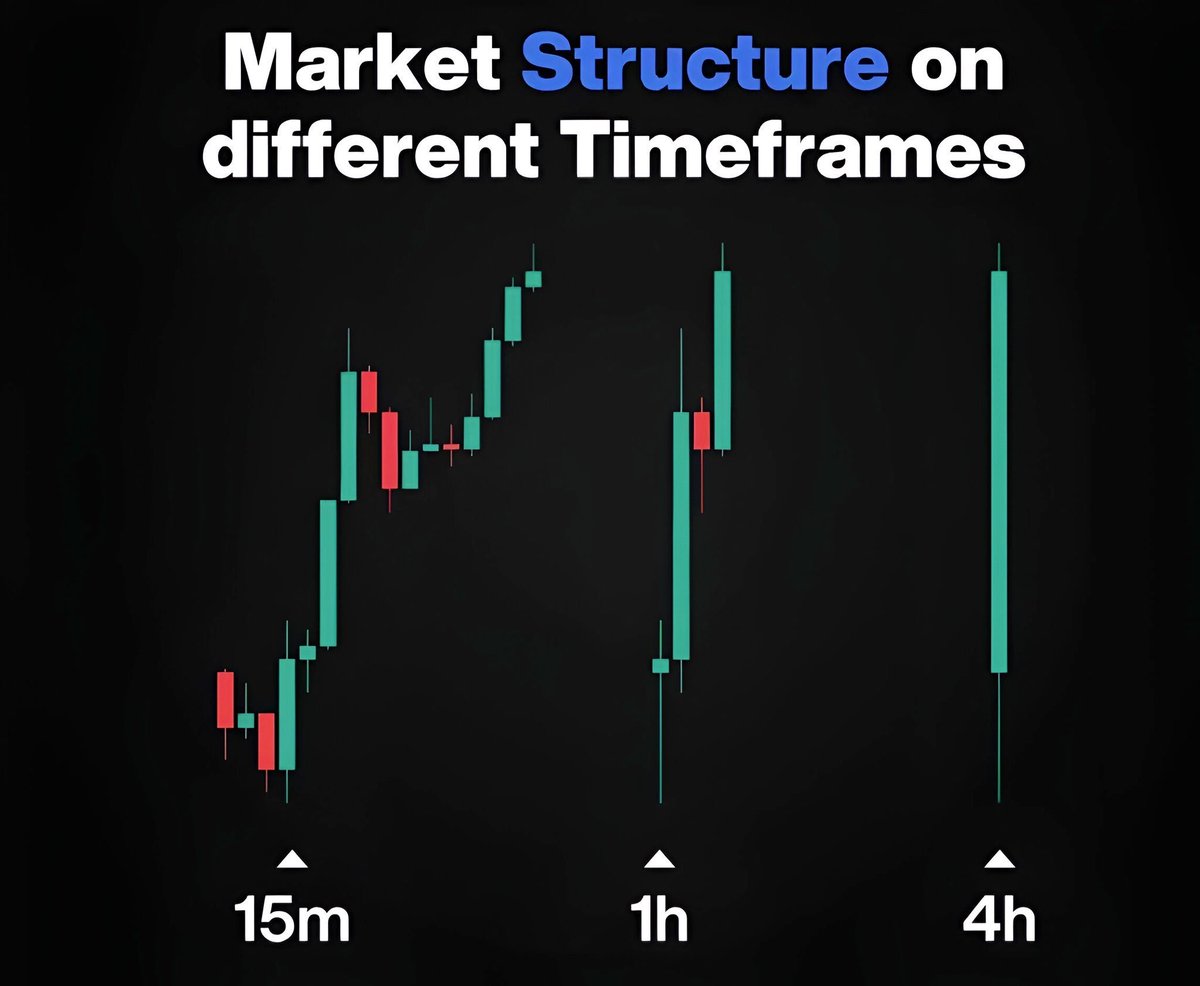
You can use it in all TF, and use this knowledge while trading $BTC or Altcoins.
RT and LIKE to the 1st tweet of the THREAD is appreciated.
You can use it in all TF, and use this knowledge while trading $BTC or Altcoins.
RT and LIKE to the 1st tweet of the THREAD is appreciated.
• • •
Missing some Tweet in this thread? You can try to
force a refresh