In this THREAD I will explain “Price Action”
1. Bullish Candle
2. Bearish Candle
3. Entry confirmation
4. Market Structure
🧵(1/9)

1. Bullish Candle
2. Bearish Candle
3. Entry confirmation
4. Market Structure
🧵(1/9)

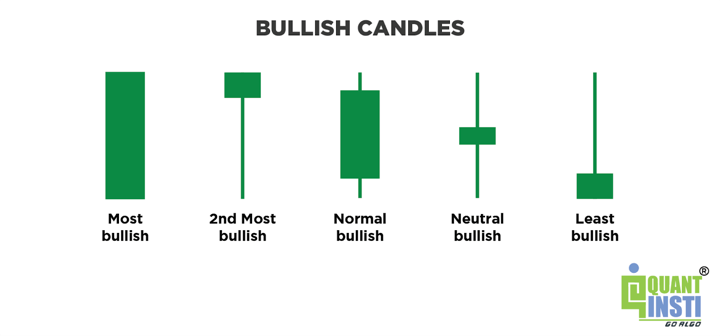
1. Bullish Candle
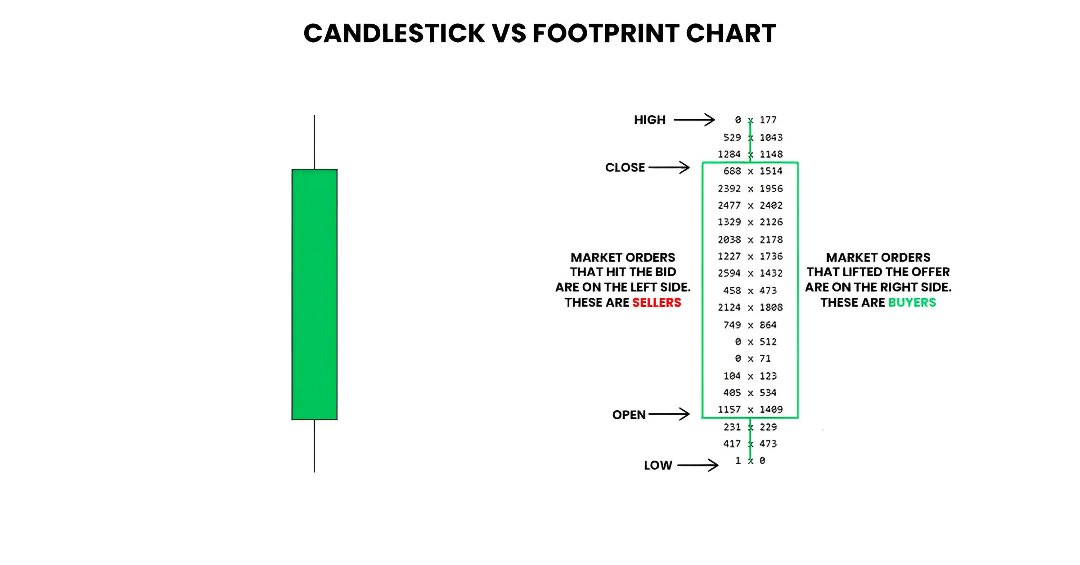
A bullish candlestick pattern is one that signals a coming uptrend in an asset's price or a continuation of said uptrend.
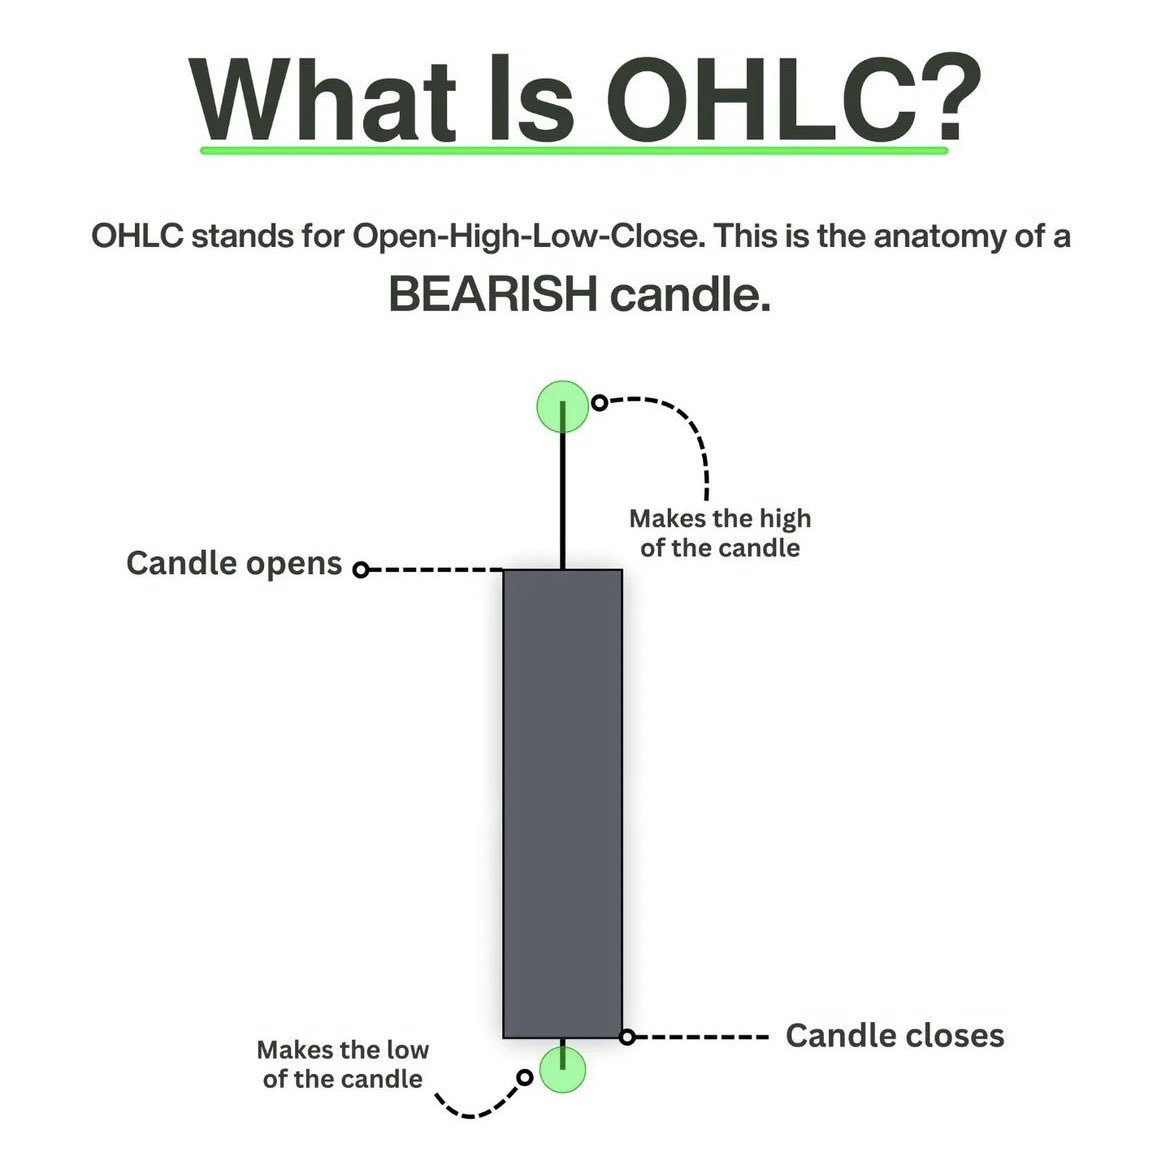
Each candlestick visually represents the open, close, low and high price during a certain time frame.
A bullish candlestick pattern is one that signals a coming uptrend in an asset's price or a continuation of said uptrend.
Each candlestick visually represents the open, close, low and high price during a certain time frame.
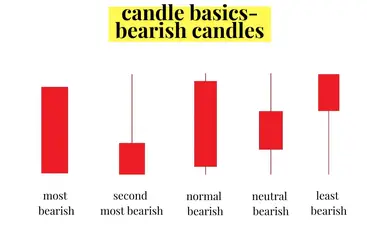
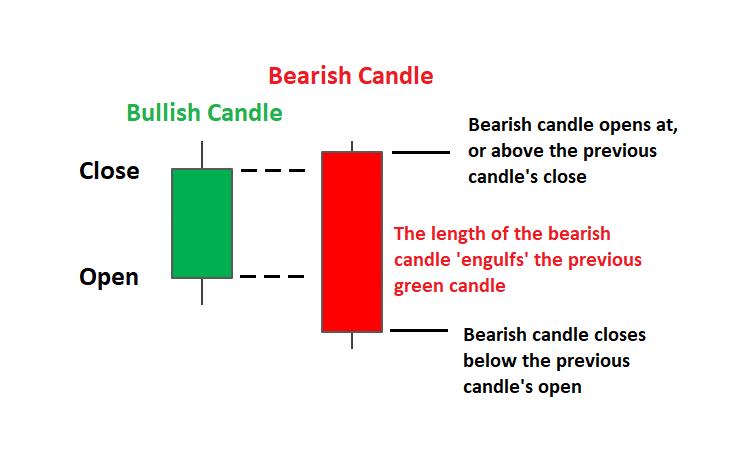
2. Bearish Candle
A bearish candlestick is a visual representation of price movement on a chart that suggests a potential downward trend or price decline in an asset.
It's formed by the arrangement of the candle's open, close, high, and low.
A bearish candlestick is a visual representation of price movement on a chart that suggests a potential downward trend or price decline in an asset.
It's formed by the arrangement of the candle's open, close, high, and low.
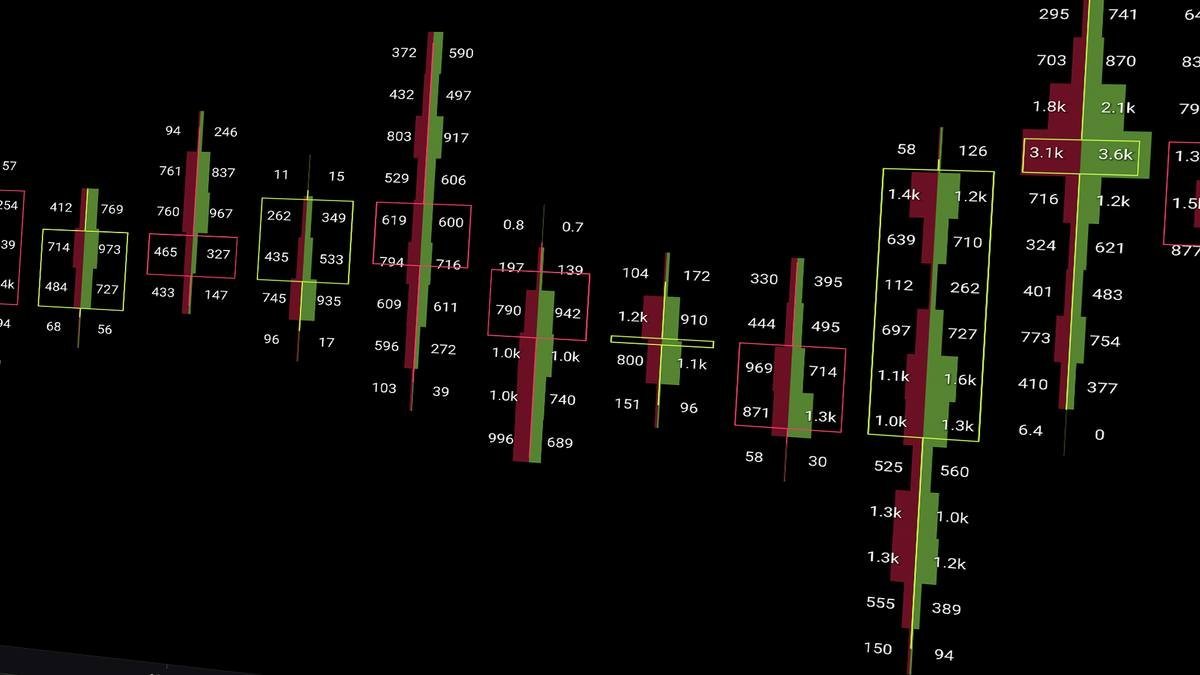
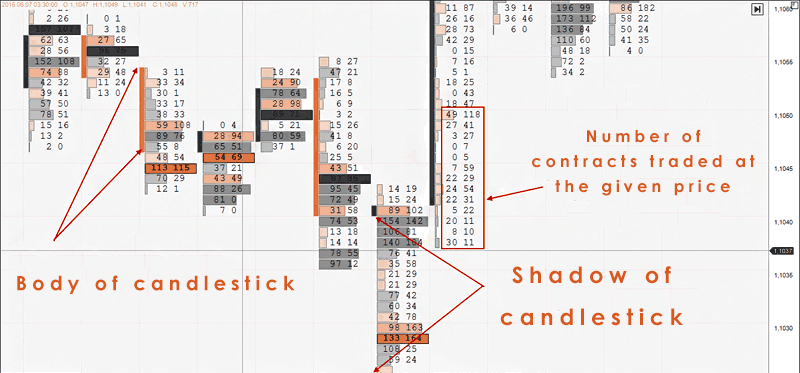
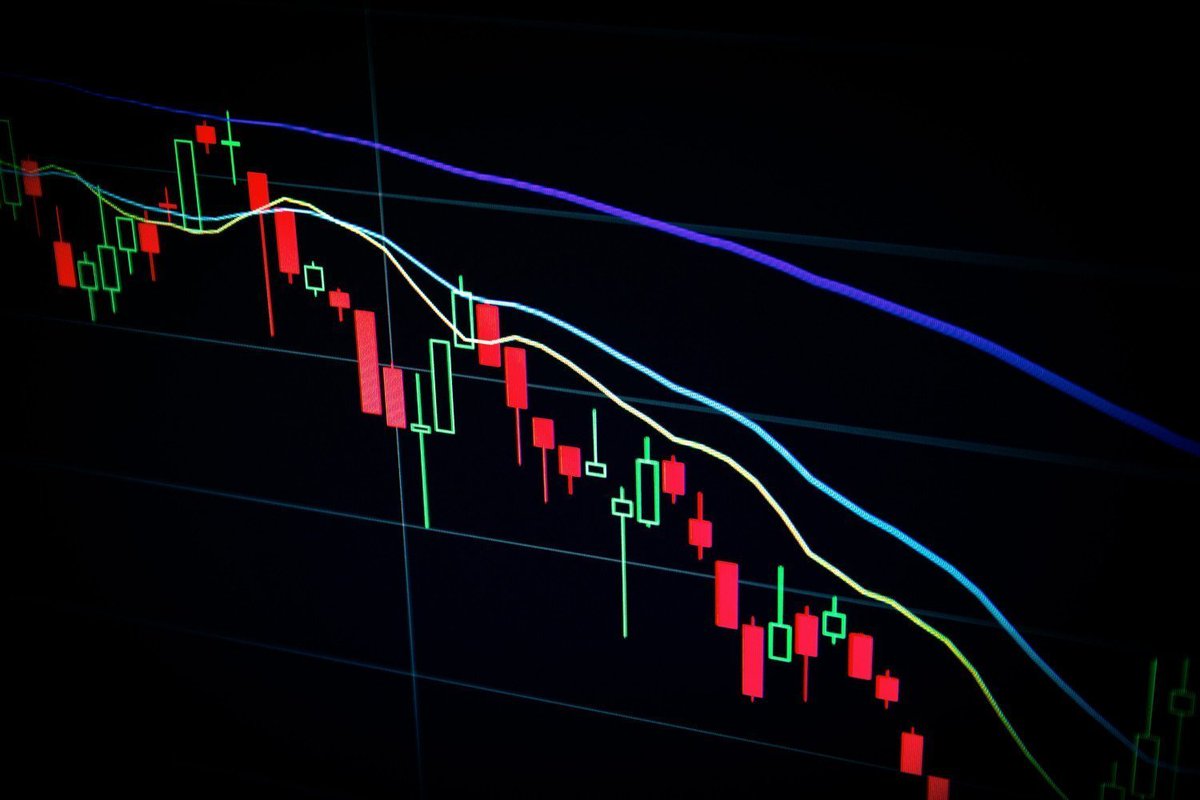
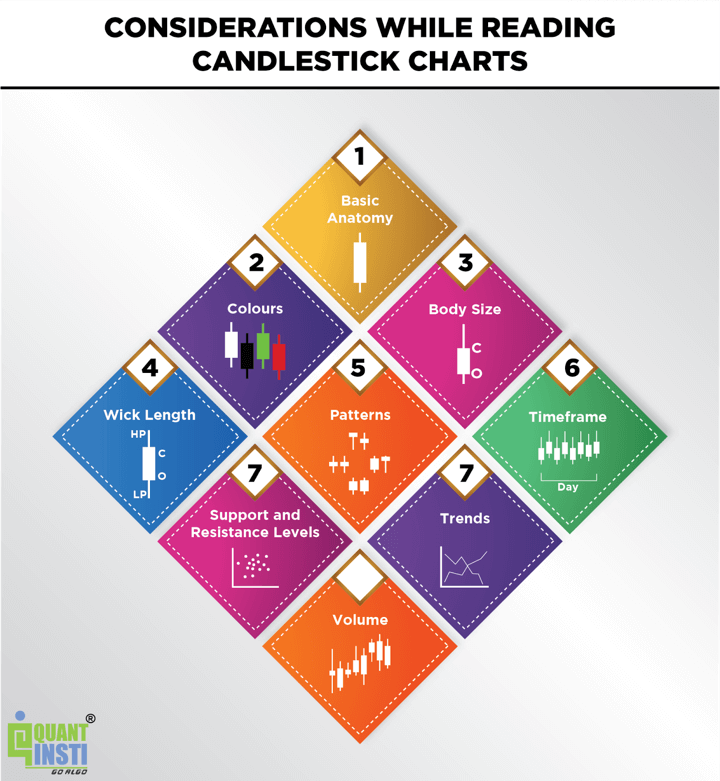
2.1 How to read Candlestick charts?
This are the most important considerations I have before taking a position.
PA of the coin, Size of the body of the candles, patterns, timeframes...
This are the most important considerations I have before taking a position.
PA of the coin, Size of the body of the candles, patterns, timeframes...
3. Entry confirmation
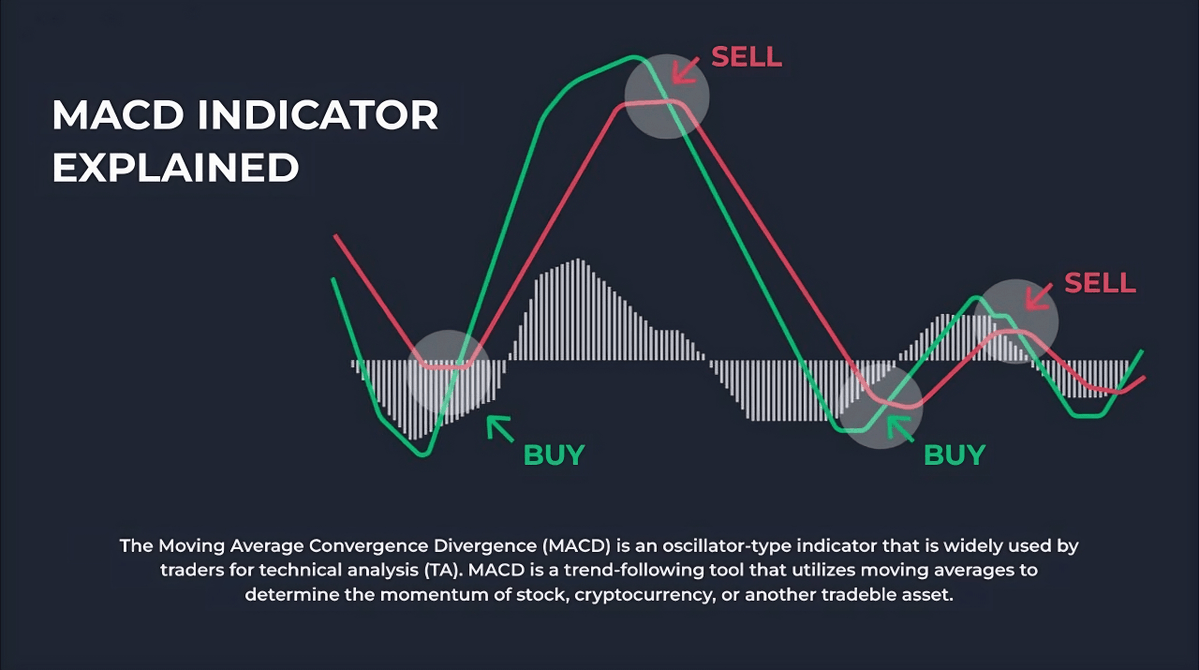
Here are some of the best confirmations to consider before entering a trade:
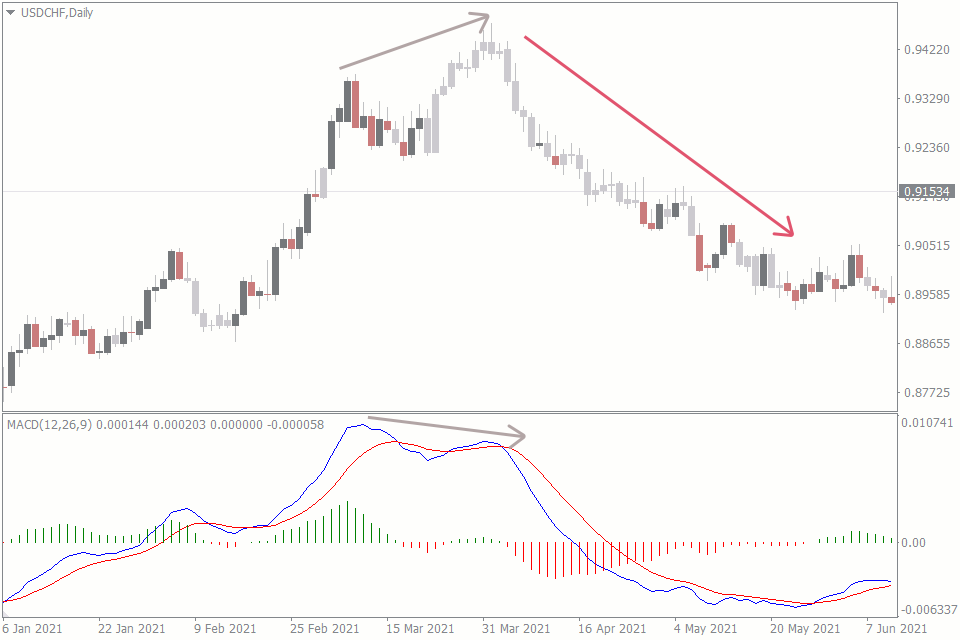
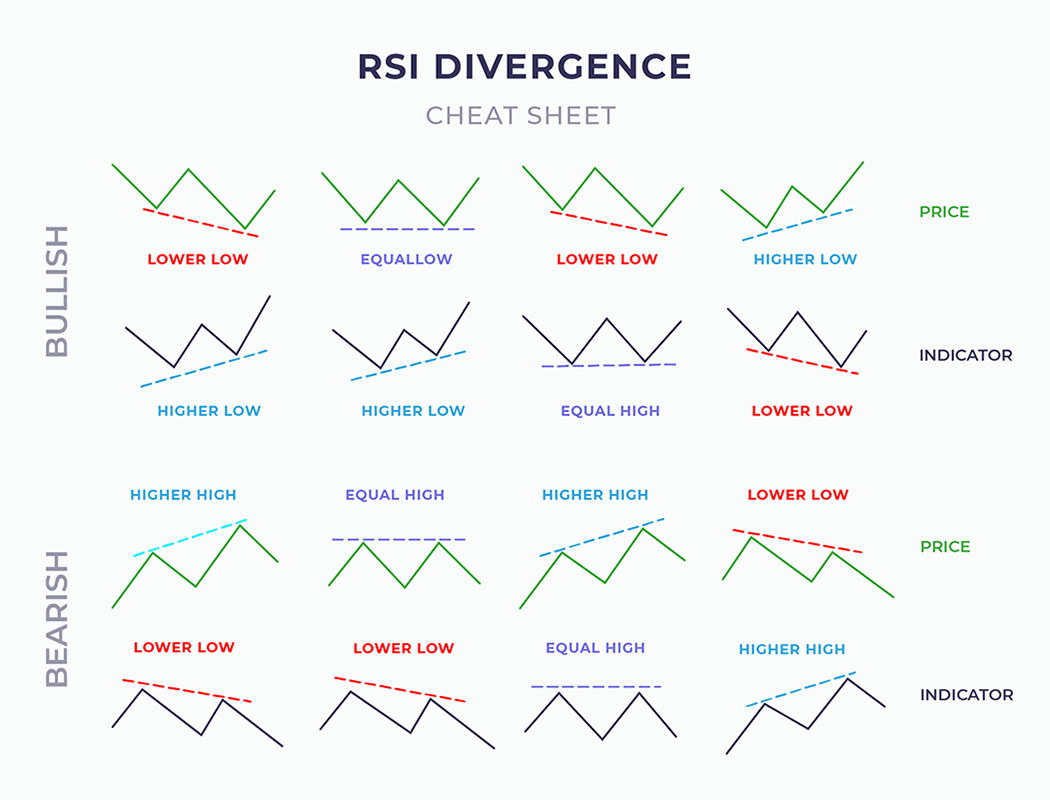
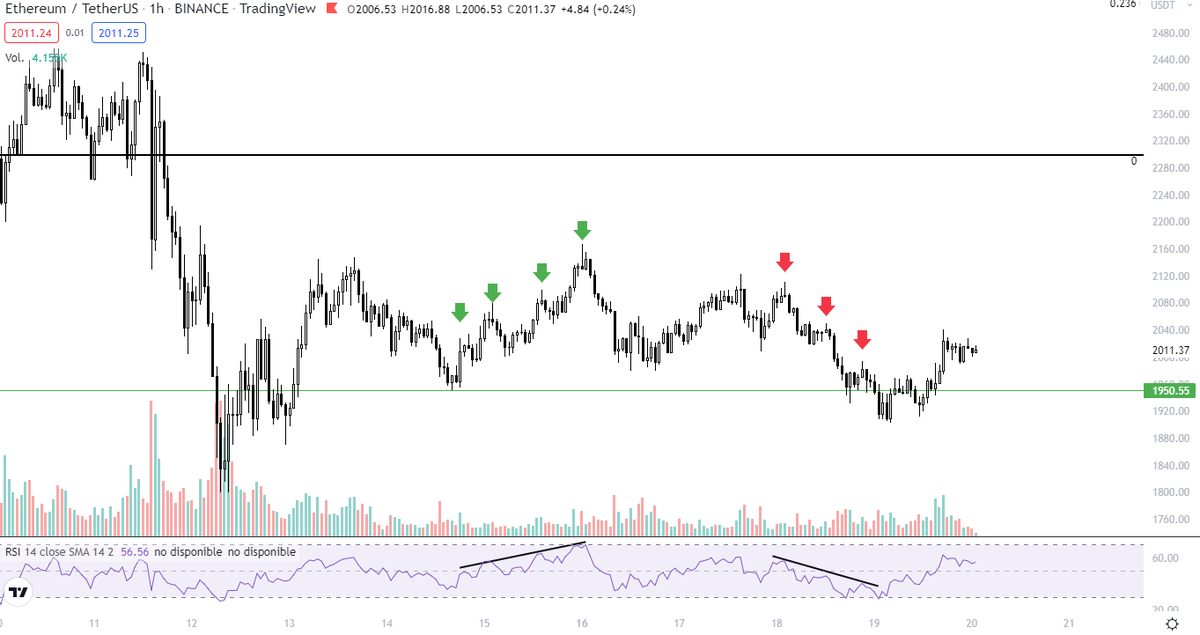
1. TA Indicators: MACD, RSI, Stochastic...
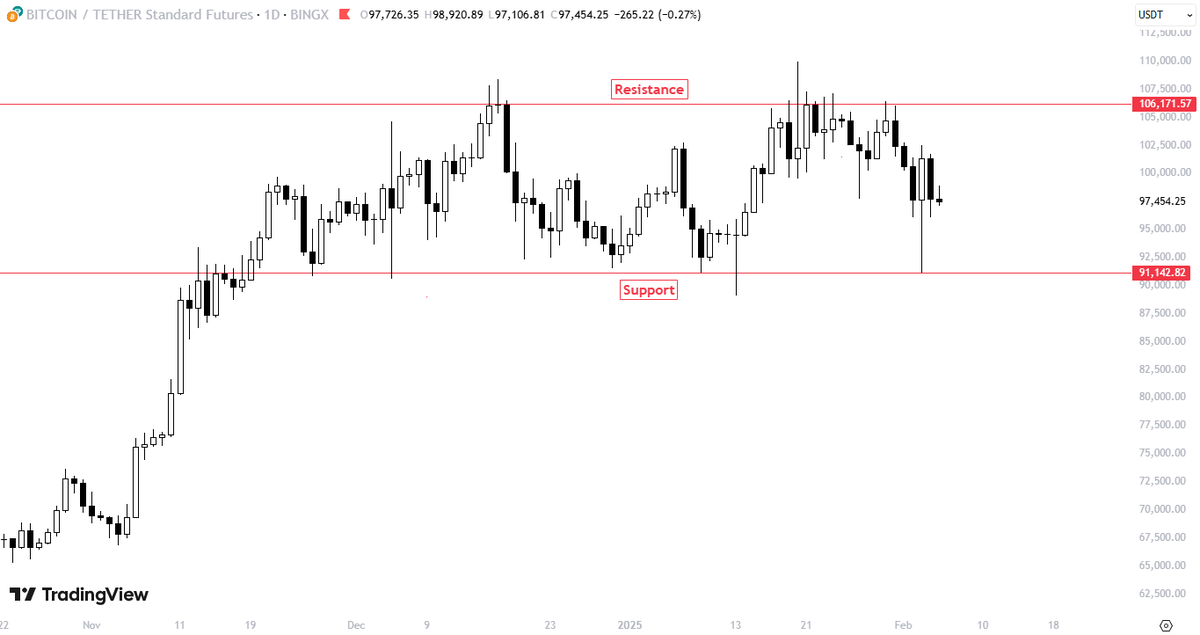
2. Support and Resistance
3. Trend Confirmation
4. Candlestick Patterns
5. Fundamental and Volume Analysis
Here are some of the best confirmations to consider before entering a trade:
1. TA Indicators: MACD, RSI, Stochastic...
2. Support and Resistance
3. Trend Confirmation
4. Candlestick Patterns
5. Fundamental and Volume Analysis
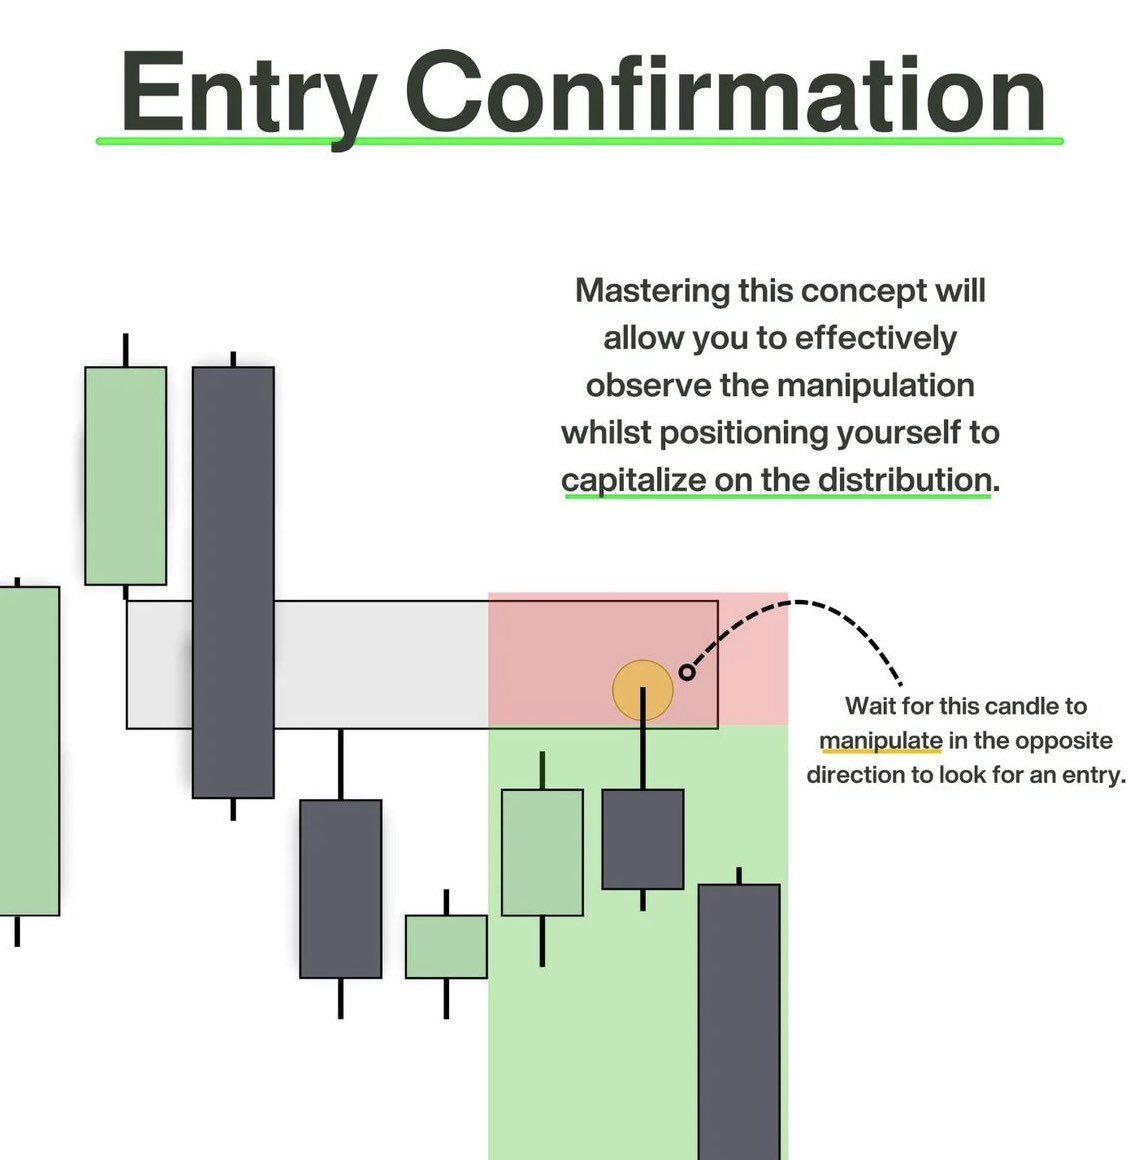
3.1 Entry confirmation
Long Setup: A valid confirmation candle will close above the body of the previous candle as well as in it’s upper 1/3rd
A valid confirmation candle must close above the body of the previous candle in a LONG setup
Long Setup: A valid confirmation candle will close above the body of the previous candle as well as in it’s upper 1/3rd
A valid confirmation candle must close above the body of the previous candle in a LONG setup

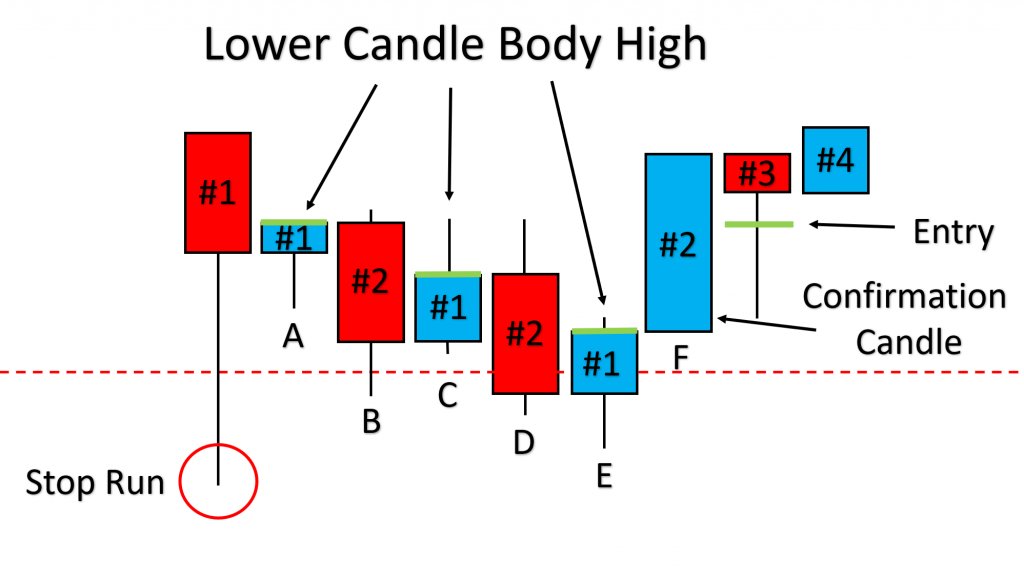
3.2 Entry confirmation
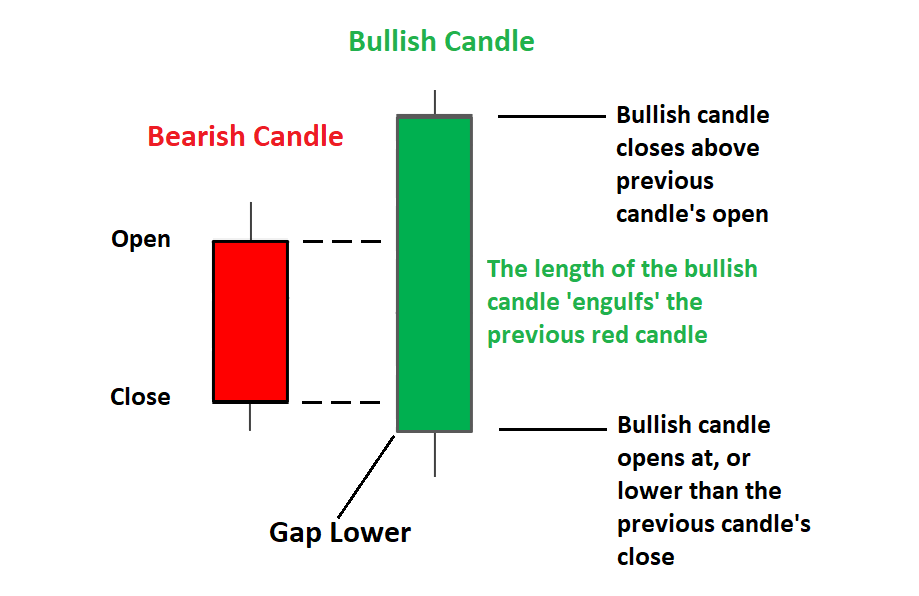
The entry in this example would be the following:
Wait for the price to make a "Stop Run" below support
Wait for a bullish candlesticks that engulfs in body the previous candles
Wait for the bearish wick retest at the open of the bullish candle
Entry.
The entry in this example would be the following:
Wait for the price to make a "Stop Run" below support
Wait for a bullish candlesticks that engulfs in body the previous candles
Wait for the bearish wick retest at the open of the bullish candle
Entry.
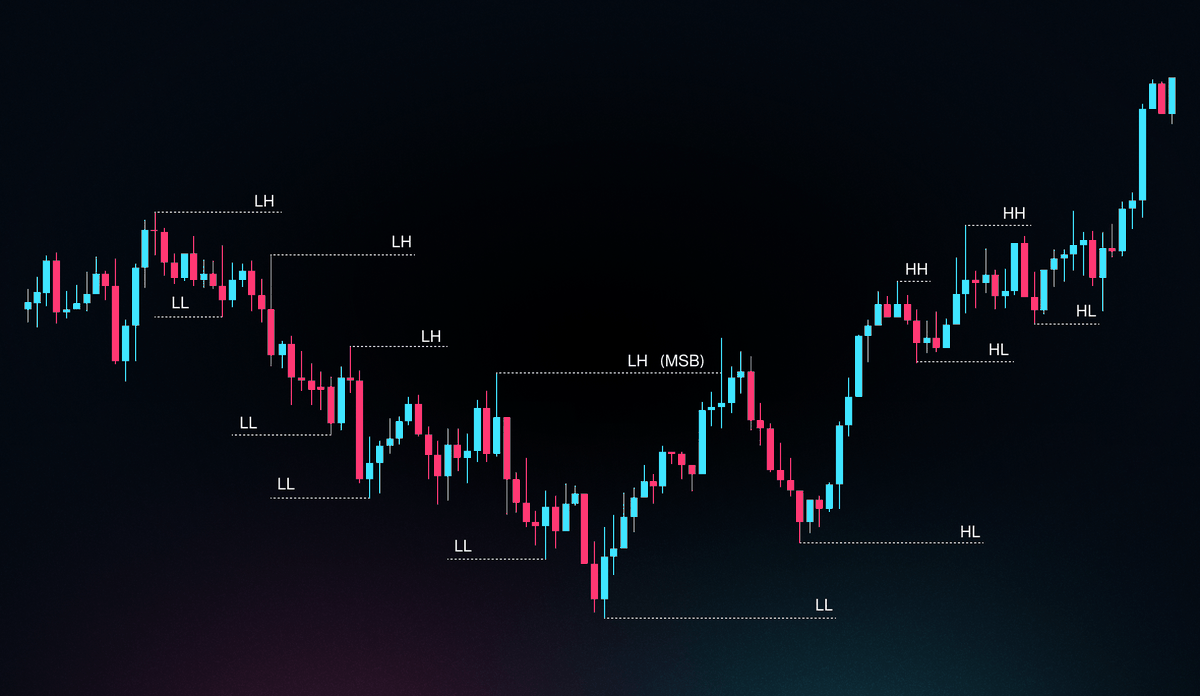
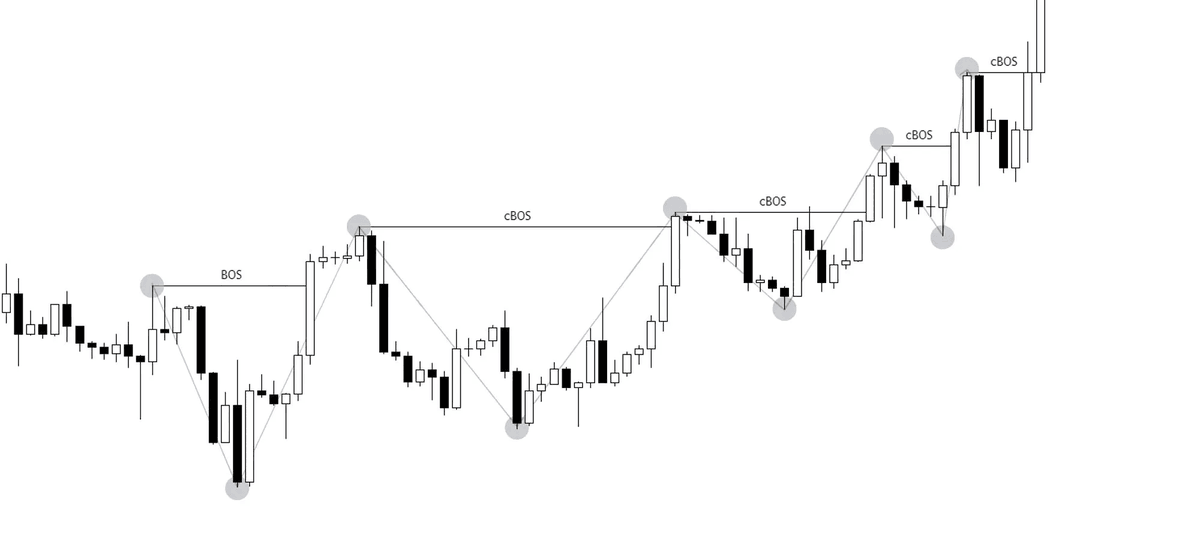
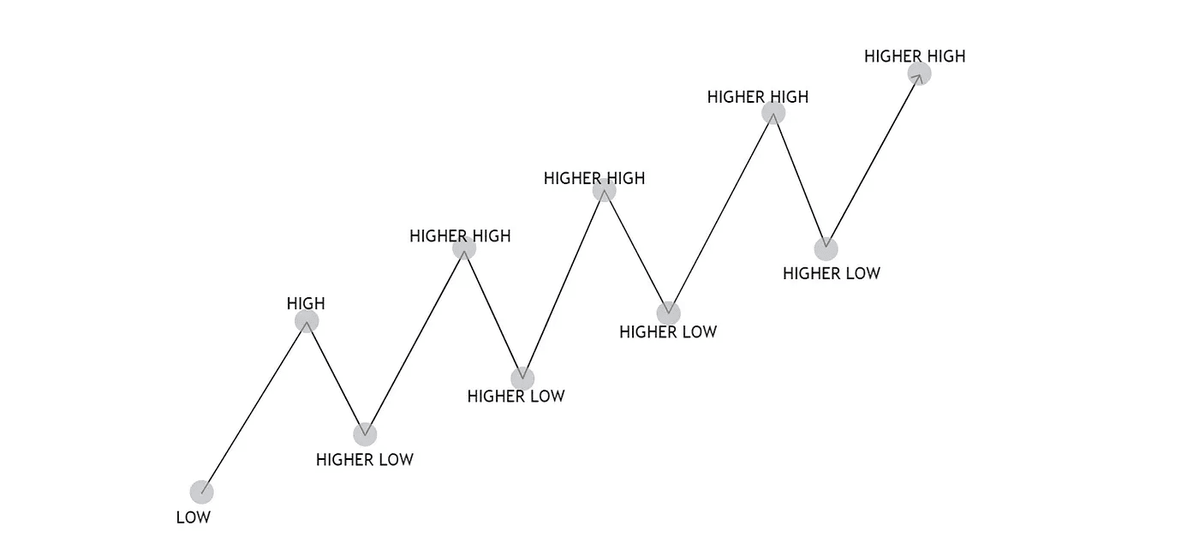
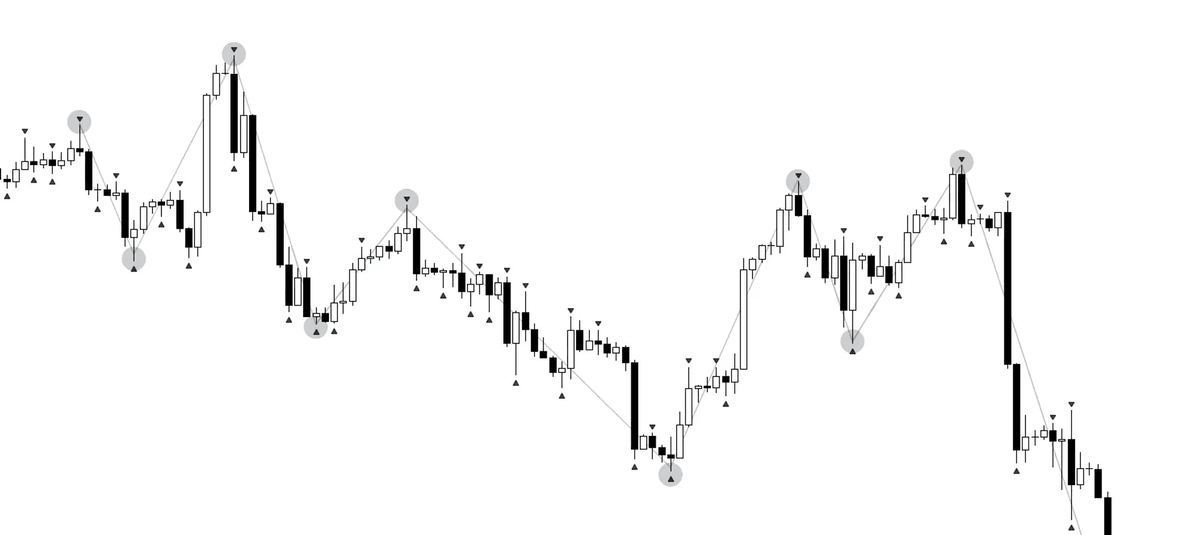
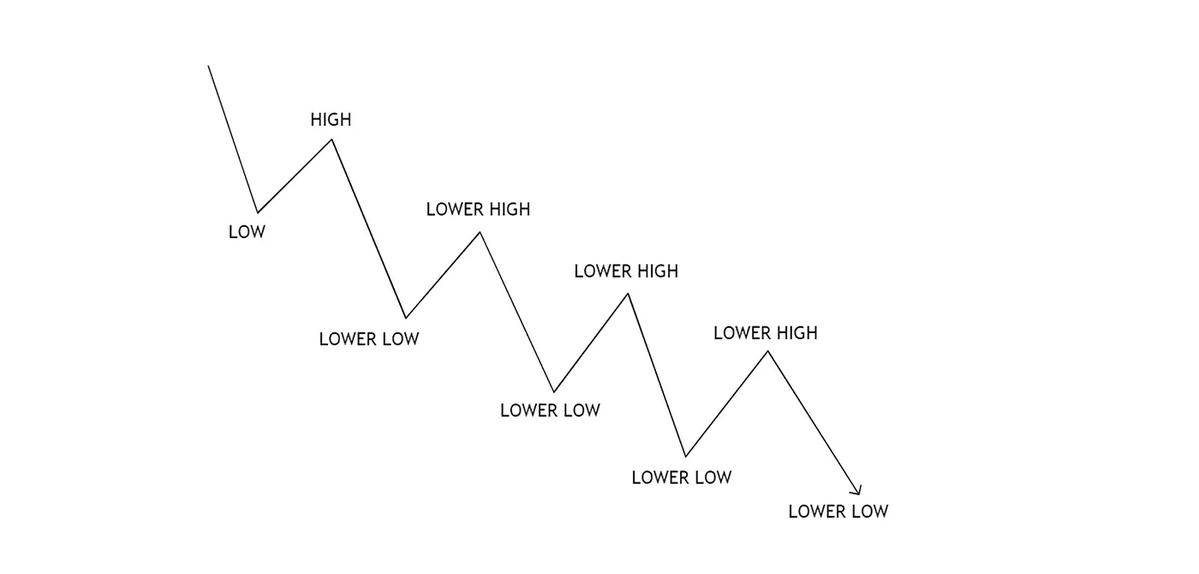
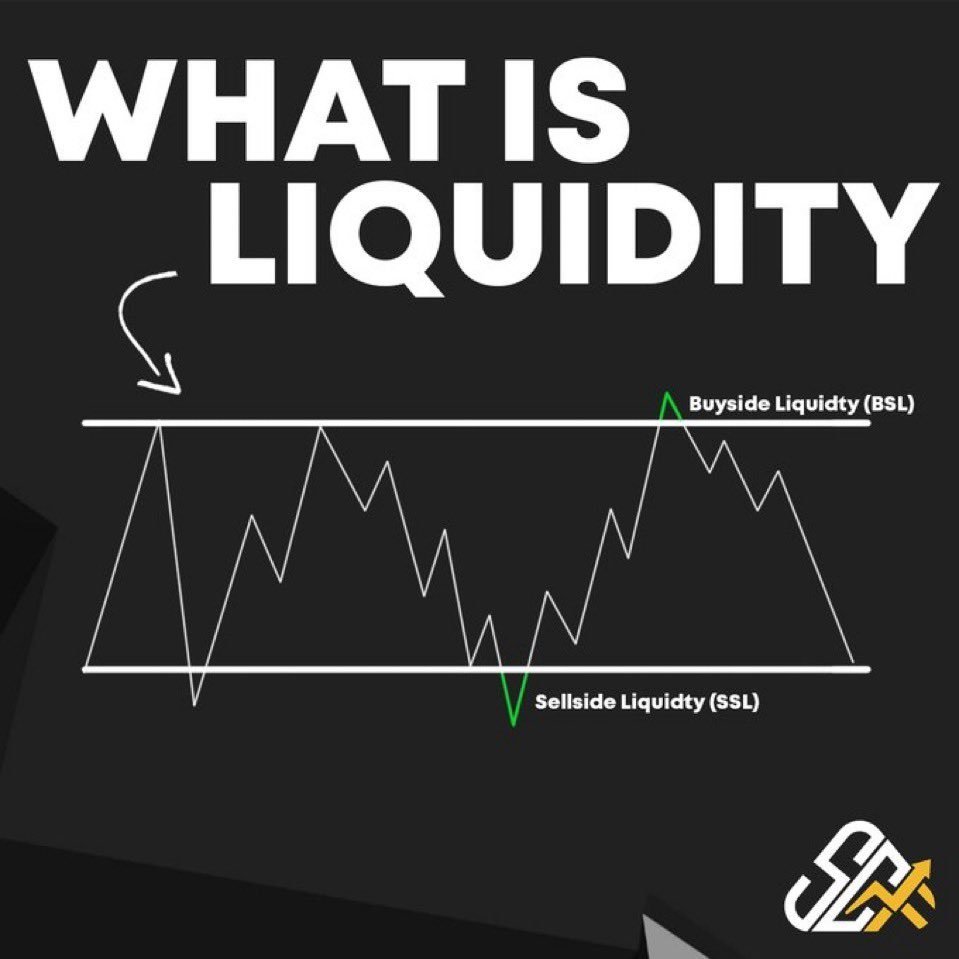
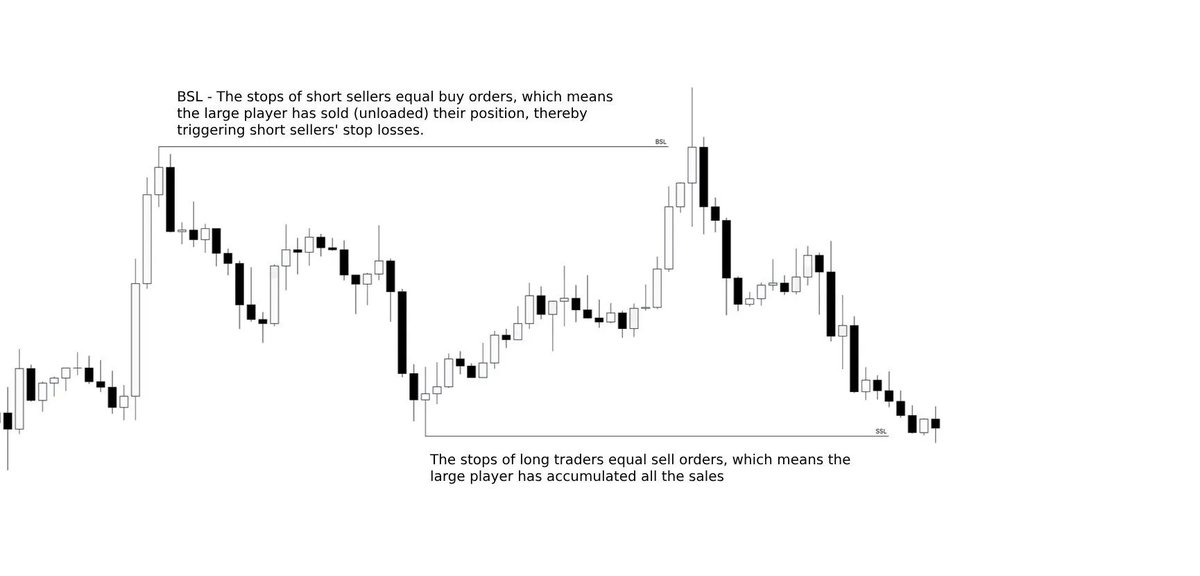
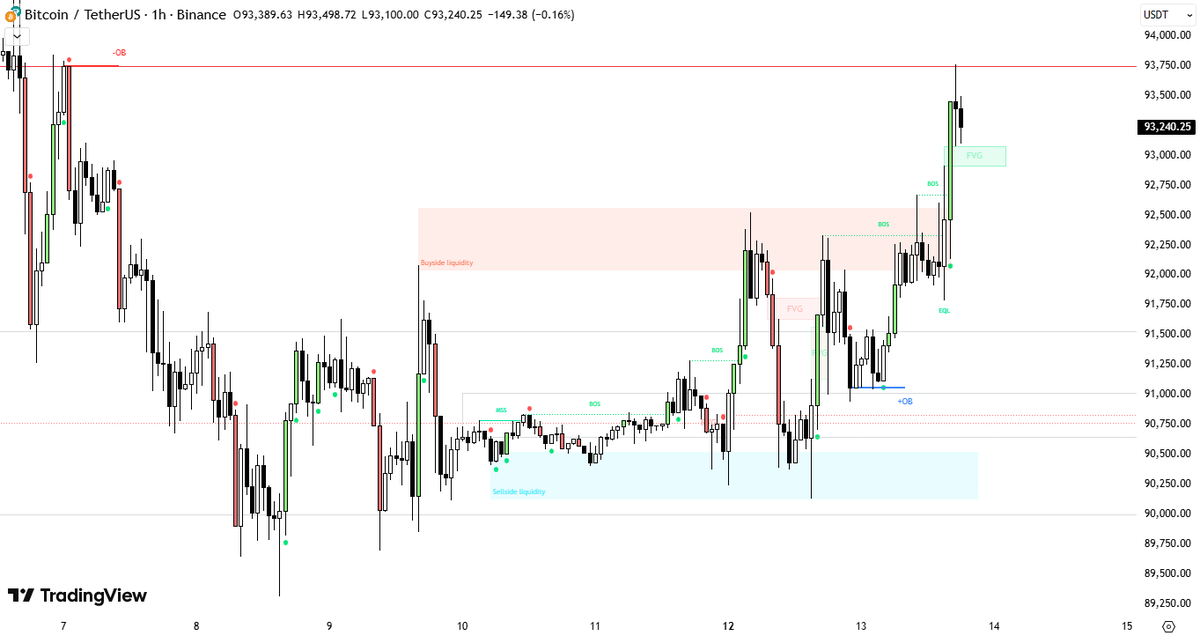
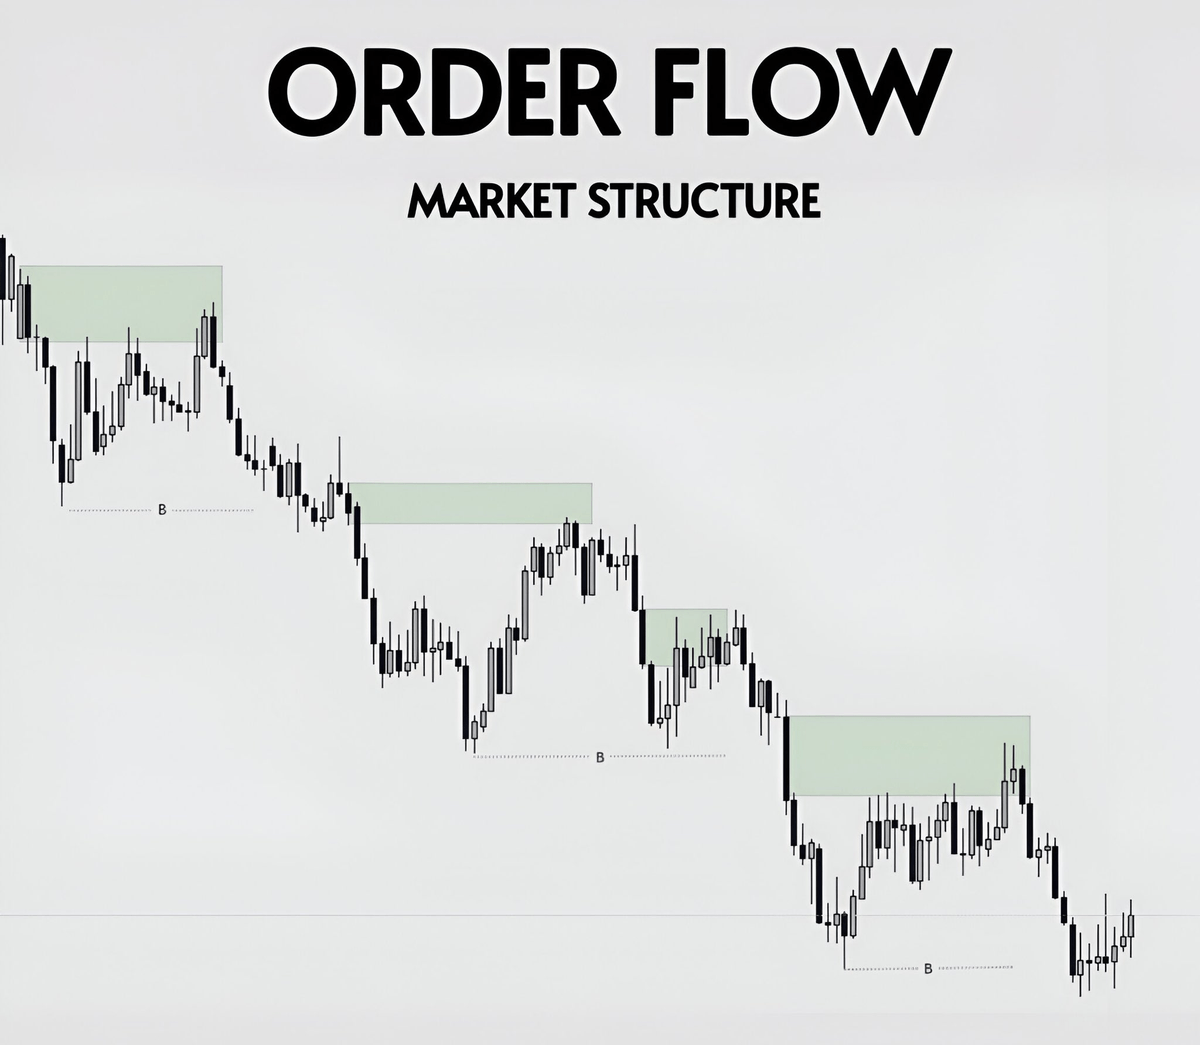
4. Market Structure
How to identify “Market Structure”:
1. Mark the FVG's in HTF
2. Mark the Lower Low of the structure
3. The FVG's are Resistance
4. The Lower Low should act as Support
5. Identify ALWAYS the MS in HTF
How to identify “Market Structure”:
1. Mark the FVG's in HTF
2. Mark the Lower Low of the structure
3. The FVG's are Resistance
4. The Lower Low should act as Support
5. Identify ALWAYS the MS in HTF
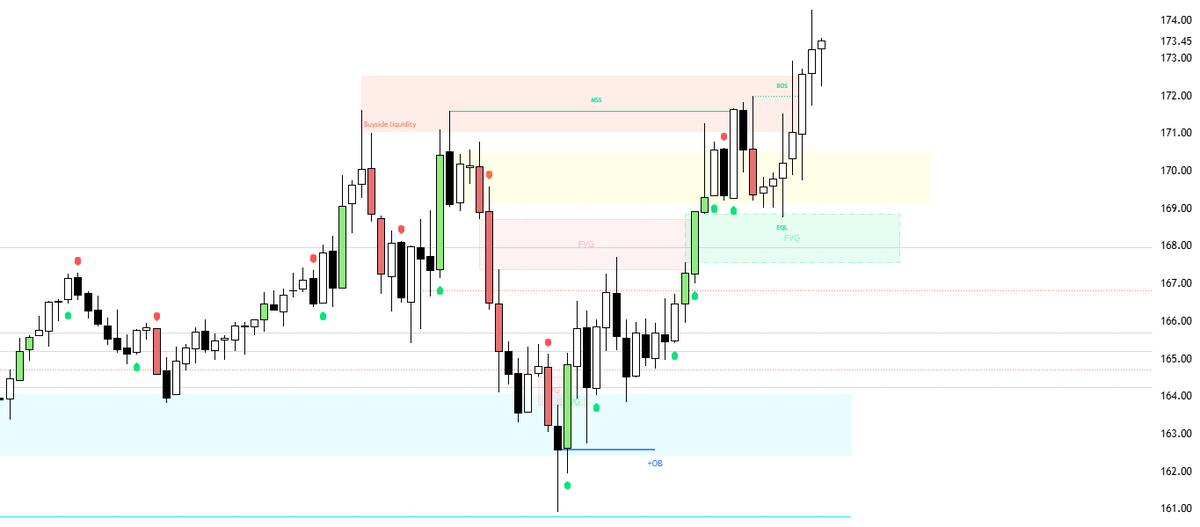
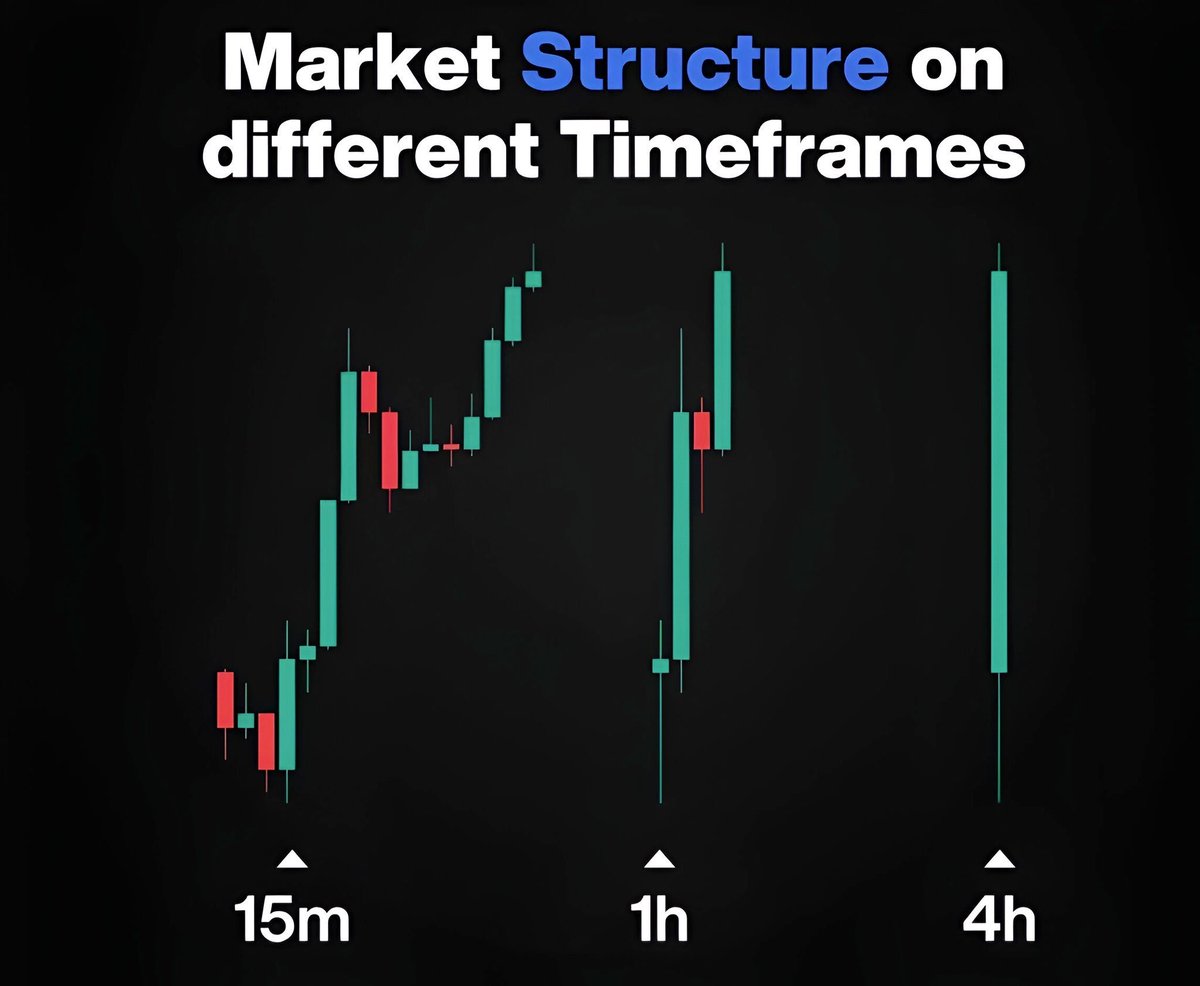
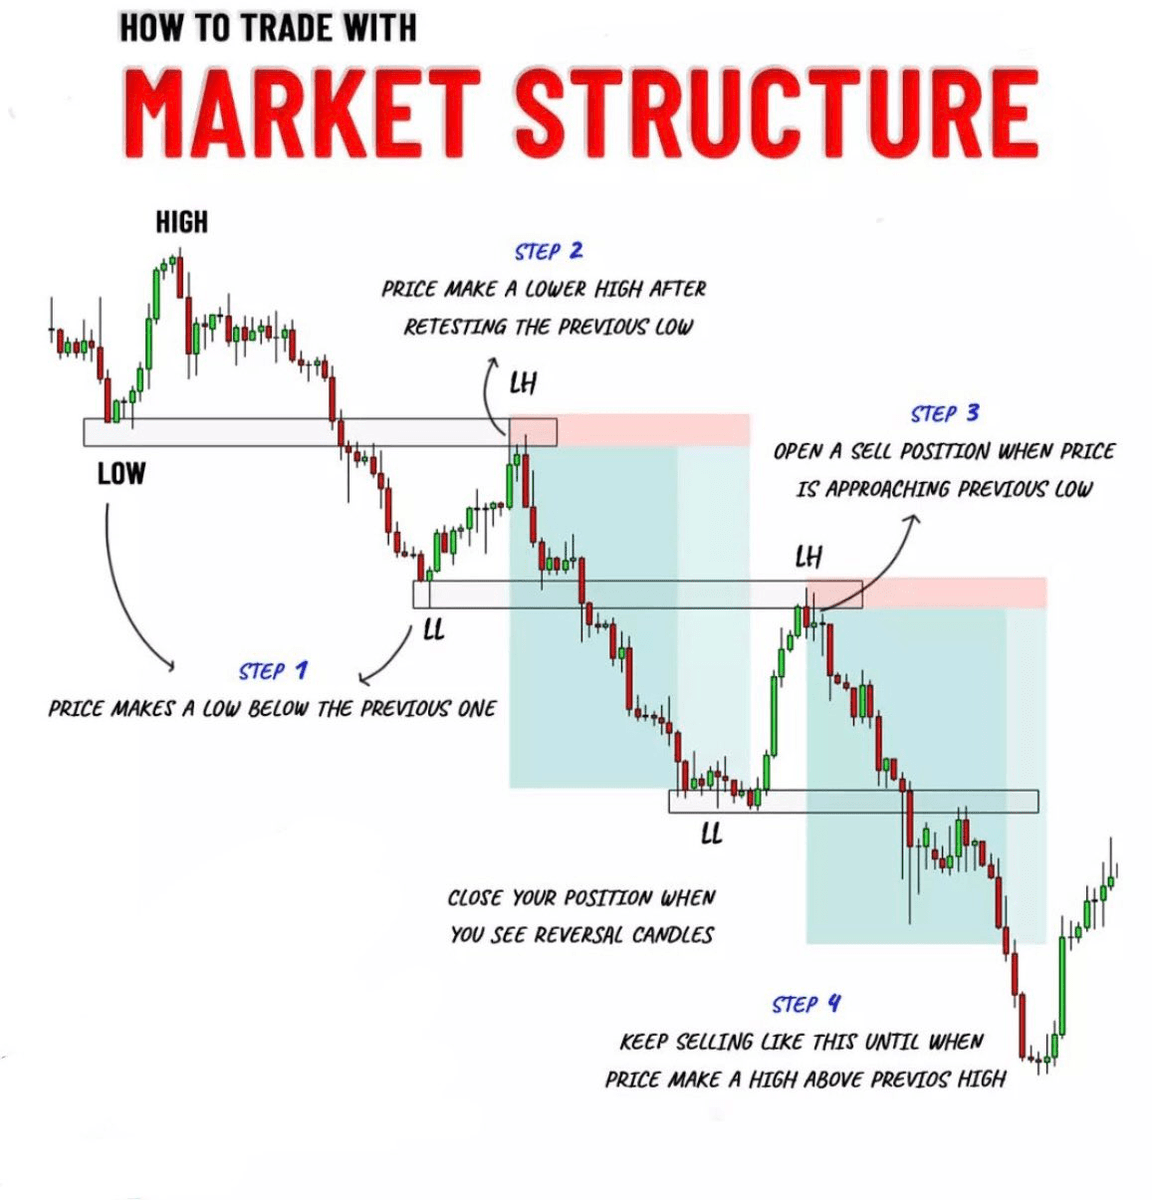
4.1 Market Structure
How to trade based on Market Structure:
Before entering on a trade, ALWAYS check his MS, preferably on 4H-1D
You will identify if we are in an uptrend or downtrend.
Follow the trend, until it ends.
How to trade based on Market Structure:
Before entering on a trade, ALWAYS check his MS, preferably on 4H-1D
You will identify if we are in an uptrend or downtrend.
Follow the trend, until it ends.
• • •
Missing some Tweet in this thread? You can try to
force a refresh