Ben Noll Profile picture
Sep 11, 2024 7 tweets 3 min read Read on X
🔮 Yesterday was Copernicus Day for September 2024 - a holiday for weather nerds around the world!

It marks the day when new long-range forecast data becomes available, providing a glimpse at general climate patterns in the months ahead...

Thread 🧵 Image
The main global climate driver in the months ahead is a developing La Niña.

Cool seas in the tropical Pacific will lead to changing rainfall and thunderstorm patterns there.

This has flow-on effects to weather patterns in distant places, otherwise known as a teleconnection. Image
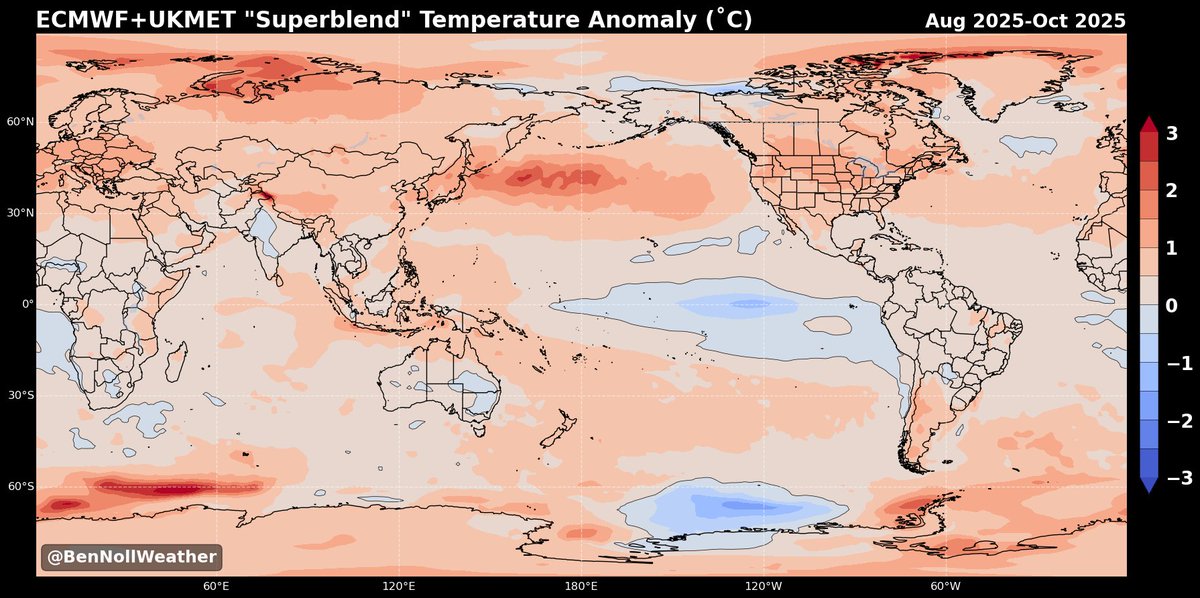
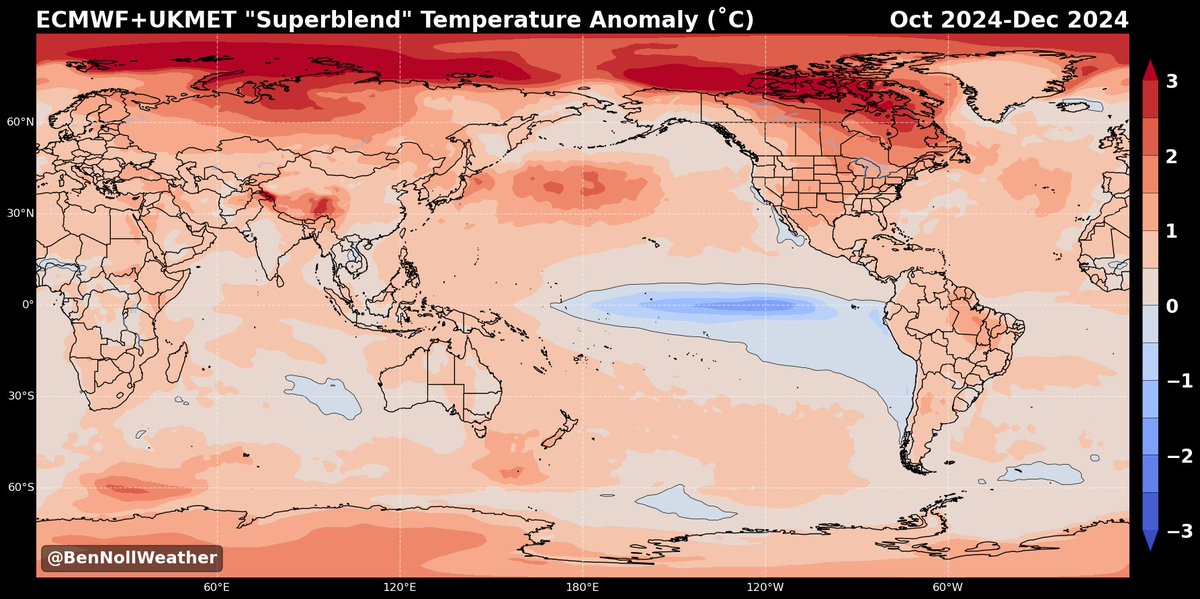
Despite La Niña, global temperatures look quite warm through the end of 2024.

The record that keeps getting broken: 2024 is on track to become the world's warmest year on record 🤒 Image
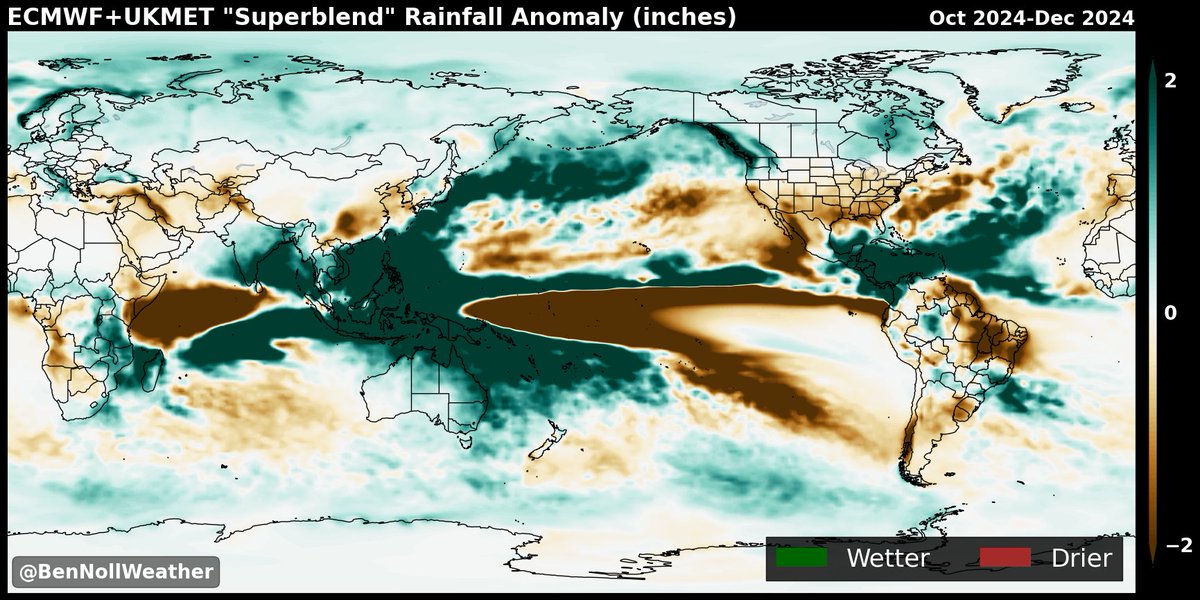
October-December 2024 precipitation patterns will be strongly influenced by La Niña.

The Indo-Pacific area looks very wet, as does the Atlantic, while the equatorial Pacific, Brazil, U.S., eastern Africa, Spain, and the Middle East look quite dry relative to normal. Image
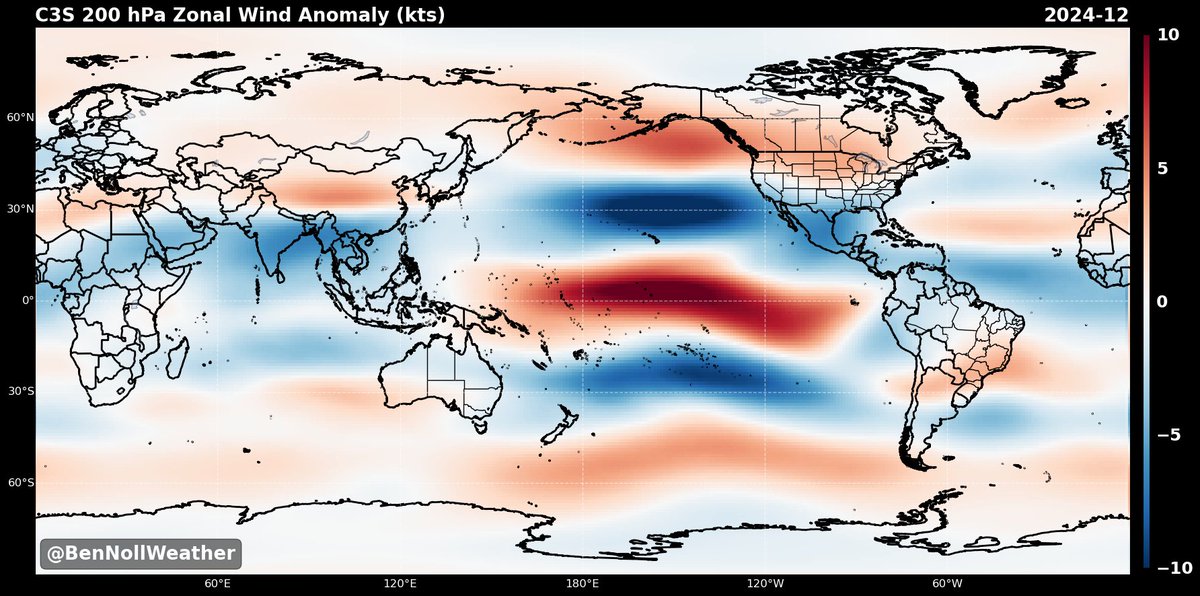
December 2024: a stronger-than-normal Pacific jet could result in a quick start to the snowy season in the Northwest U.S., but flood the central-eastern U.S. with mild air and reduce the chance for snow there. Image
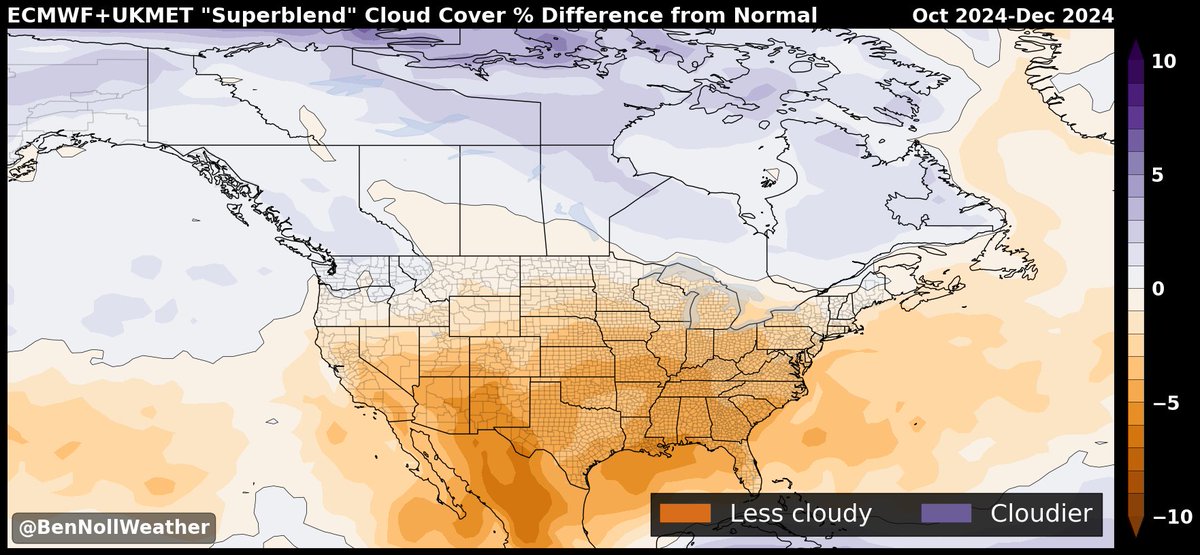
October-December 2024 looks less cloudy than normal across much of the U.S. 😎

This is consistent with more high pressure and a weaker-than-normal jet stream.

In short, it looks like it could be a pretty decent end to the year! Image
Celebrate Copernicus Day every month by bookmarking my climate graphics page - there's something for everyone! Enjoy.

bennollweather.com/climate-graphi…

• • •

Missing some Tweet in this thread? You can try to force a refresh
 

Keep Current with Ben Noll

Ben Noll Profile picture

Stay in touch and get notified when new unrolls are available from this author!

Read all threads

This Thread may be Removed Anytime!

PDF

Twitter may remove this content at anytime! Save it as PDF for later use!

Try unrolling a thread yourself!

how to unroll video
  1. Follow @ThreadReaderApp to mention us!

  2. From a Twitter thread mention us with a keyword "unroll"
@threadreaderapp unroll

Practice here first or read more on our help page!

More from @BenNollWeather

Aug 13
Copernicus Day for August has come and gone.

It marks a day when long-range forecast data for the months ahead gets released.

Here's what it shows! 🧵 Image
A La Niña-like pattern will be in place as winter approaches.

Cool water in the Pacific affects climate patterns worldwide.

Marine heat waves in the mid-latitudes may lead to warm fall weather in parts of the United States, Europe and Asia.
Precipitation patterns during September to November suggest unusually dry conditions are possible in the United States and southern Europe — but hurricanes are a wildcard!

Australasia and Indonesia look wet, fueled partly by a negative Indian Ocean Dipole. Image
Read 11 tweets
Jul 16
There have been varying meteorological forces behind recent extreme rainfall events, but they are all connected by very unusual amounts of moisture pulsing above the United States.

Precipitable water, a measure of the total amount of water in the atmosphere, has been above the 90th percentile on half of all days so far this summer — the largest number of days to-date since records began in 1940. It's been above-average on all but five days.

Forecasters use precipitable water to gauge how much fuel is available for storms and how much rain can possibly fall. While it's not a one-to-one relationship, higher precipitable water brings a higher the chance for extreme rainfall — as long as there's a mechanism to squeeze the moisture out of the sky.

Globally, precipitable water reached record levels in 2024. So far, 2025 is a few notches below last year's record pace, but corridors of unusually high atmospheric moisture have developed near areas of much warmer than average oceans. This includes the central and eastern United States, Europe and eastern Asia.

Part of a meteorologist's job is to be an atmospheric detective — to understand and help others understand why certain things are happening.

Yes, it rains hard and sometimes floods during summer, but to understand what's driving this season's excessive rainfall is critically important. To dismiss it as 'just weather' is selling it short.

I think there's plenty of evidence to suggest that the trend toward a moister atmosphere is leaving an imprint on weather patterns in the United States this summer.Image
Corridors of unusually high atmospheric moisture have developed near areas of much warmer than average oceans — which happen to be located near densely populated parts of the Northern Hemisphere. Image
Image
Dr Kevin Trenberth, a distinguished scholar with the National Center for Atmospheric Research who has been publishing on the topic of increasing water vapor since the 1990s, said that the pattern has been "too often ignored" with rising temperatures getting more attention. Image
Read 4 tweets
Jul 11
Copernicus Day for July 2025 has arrived — a day when weather fans around the planet can learn about possible patterns in the months ahead.

Here's what the world can expect 🧵 Image
A big global story is how warm the oceans are, especially in the Northern Hemisphere.

This may cause summer-like heat to last into fall and enhance downpours in many places.

Neither La Niña nor El Niño is currently active in the Pacific, but La Niña may return later this year.
In the months ahead, some of the most unusually warm air temperatures are forecast near areas of unusual ocean heat, such as eastern Asia, Europe and the western tropical Pacific. Image
Read 10 tweets
Jun 30
June was more humid than average for a whopping 290 million people across 40 states.

Did it feel particularly sticky where you live?

New Mexico, Kentucky, Maryland, North Carolina and Ohio were the most unusually humid states.

🧵 on June Image
Nights during June were very unusually warm.

Around 270 million people experienced above-average minimum temperatures. It was below-average for just 8 million people.

Overnight temperatures were most unusually high in Utah, Pennsylvania, New York, Vermont and Ohio. Image
High temperatures during June were above-average for about 185 million people, particularly in Idaho, West Virginia, Nevada, Washington and Oregon.

The states with the lowest high temperatures relative to average were New Mexico, Texas, Oklahoma and Kansas. Image
Read 6 tweets
Jun 24
Record-breaking humidity levels hit the Northeast and southern Canada on Monday, with dew points surging into the low-to-mid-80s.

Heat index values neared 115 degrees.

This illustrates that the current weather pattern exceeds typical summer weather.

Why it's so humid 🧵 Image
Behind the extreme humidity is an air mass that took a winding, week-long, 4,000-mile journey northward from the Caribbean islands to the Northeast, bringing tropical weather to people that live far from the tropics. Image
For around 150 million people across 34 states, as well as parts of southern Canada, it was more humid than Miami late Monday. Image
Read 6 tweets
Jun 22
Eyes will be on East Coast cities this week where temperatures will reach 100 degrees for several consecutive days, potentially breaking June records.

Around 40 million people may face triple digit heat 🧵 Image
It could reach or exceed 100 degrees for up to five days in a row in some eastern areas this week.

For many places in the Northeast and Mid-Atlantic, the June record is at most two 100 degree days in a row. Image
Here are some notable heat records that could be neared, tied or broken in Washington, Baltimore, Philadelphia and New York this week: Image
Read 6 tweets

Did Thread Reader help you today?

Support us! We are indie developers!


This site is made by just two indie developers on a laptop doing marketing, support and development! Read more about the story.

Become a Premium Member ($3/month or $30/year) and get exclusive features!

Become Premium

Don't want to be a Premium member but still want to support us?

Make a small donation by buying us coffee ($5) or help with server cost ($10)

Donate via Paypal

Or Donate anonymously using crypto!

Ethereum

0xfe58350B80634f60Fa6Dc149a72b4DFbc17D341E copy

Bitcoin

3ATGMxNzCUFzxpMCHL5sWSt4DVtS8UqXpi copy

Thank you for your support!

Follow Us!

:(