A Detailed Breakdown of High-Frequency Trading Strategy: Order Book Skew Reversion Strategy 🧵with Python code Implementation
Shared by @christinaqi
Like, Retweet and comment "Done", to receive the code for the strategy
Shared by @christinaqi
Like, Retweet and comment "Done", to receive the code for the strategy
Key Terminology
Feature (Predictor): An independent variable believed to have predictive value regarding future price movements. In machine learning, these are known as features; in statistics or econometrics, they are called predictors or regressors.
Feature (Predictor): An independent variable believed to have predictive value regarding future price movements. In machine learning, these are known as features; in statistics or econometrics, they are called predictors or regressors.
Trading Signal: The output generated by feeding one or more features into a mathematical model. This signal guides trading decisions.
Trading Rule: A hardcoded decision-making criterion. For example, "If the price drops by 1%, buy 100 shares."
Trading Rule: A hardcoded decision-making criterion. For example, "If the price drops by 1%, buy 100 shares."
Strategy: A combination of trading decisions derived from trading rules and signals. Strategies can be:
Rule-based: Relying solely on predefined trading rules.
Model-based: Utilizing mathematical models and signals to inform decisions.
Rule-based: Relying solely on predefined trading rules.
Model-based: Utilizing mathematical models and signals to inform decisions.
The Strategy Explained
1. Features Used
Order Book Skew
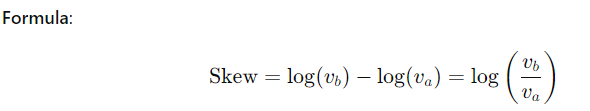
The skew is a measure of imbalance between the resting bid depth (volume of buy orders, vb) and the resting ask depth (volume of sell orders, va) at the top of the order book.
1. Features Used
Order Book Skew
The skew is a measure of imbalance between the resting bid depth (volume of buy orders, vb) and the resting ask depth (volume of sell orders, va) at the top of the order book.
Interpretation:
Positive Skew: Indicates higher bid depth than ask depth, suggesting upward price pressure.
Negative Skew: Indicates higher ask depth than bid depth, suggesting downward price pressure.
Positive Skew: Indicates higher bid depth than ask depth, suggesting upward price pressure.
Negative Skew: Indicates higher ask depth than bid depth, suggesting downward price pressure.
2. Trading Rules
The strategy employs simple trading rules based on the skew:
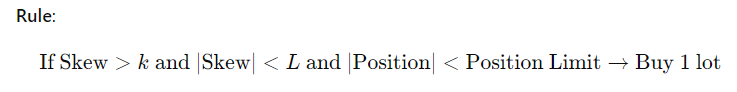
Buy Signal: Condition: Skew exceeds a positive threshold (k).
Action: Buy a minimum quantity (e.g., 1 lot).
The strategy employs simple trading rules based on the skew:
Buy Signal: Condition: Skew exceeds a positive threshold (k).
Action: Buy a minimum quantity (e.g., 1 lot).
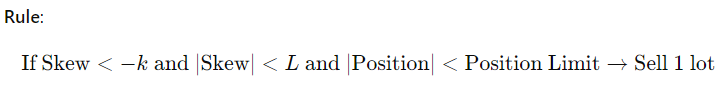
Sell Signal:
Condition: Skew falls below a negative threshold (−k-k−k).
Action: Sell a minimum quantity (e.g., 1 lot).
Condition: Skew falls below a negative threshold (−k-k−k).
Action: Sell a minimum quantity (e.g., 1 lot).
Parameters
Threshold k: Determines when the skew is significant enough to trigger a trade.
Limit LLL: Caps the skew to avoid acting on extreme values that may be due to market anomalies or spoofing
Position Limit: Maximum allowable open position (e.g., 10 lots) to manage risk
Threshold k: Determines when the skew is significant enough to trigger a trade.
Limit LLL: Caps the skew to avoid acting on extreme values that may be due to market anomalies or spoofing
Position Limit: Maximum allowable open position (e.g., 10 lots) to manage risk
3. Risk Management
Position Limits
Purpose: Prevents the accumulation of excessively large positions that could exceed margin requirements or risk thresholds.
Implementation:
Trades are only executed if the absolute value of the current position is below the predefined limit.
Position Limits
Purpose: Prevents the accumulation of excessively large positions that could exceed margin requirements or risk thresholds.
Implementation:
Trades are only executed if the absolute value of the current position is below the predefined limit.
This ensures the strategy remains within acceptable risk parameters.
Avoiding Spoofing
Spoofing Concern: Large skew values might be artificially created by traders attempting to manipulate the market.
Avoiding Spoofing
Spoofing Concern: Large skew values might be artificially created by traders attempting to manipulate the market.
Mitigation:
Introduce the limit LLL to ignore skew values that are too extreme.
This filters out potential false signals due to market manipulation.
Introduce the limit LLL to ignore skew values that are too extreme.
This filters out potential false signals due to market manipulation.
4. Additional Considerations
Mean Reversion
Concept: Prices tend to revert to their mean over time. If prices deviate significantly, they may be more likely to move back toward the average.
Mean Reversion
Concept: Prices tend to revert to their mean over time. If prices deviate significantly, they may be more likely to move back toward the average.
Application:
Incorporate rules to only buy when the price is at least one standard deviation below recent history and sell when above.
Use a fixed lookback period (e.g., 30 minutes) to calculate the mean and standard deviation.
Incorporate rules to only buy when the price is at least one standard deviation below recent history and sell when above.
Use a fixed lookback period (e.g., 30 minutes) to calculate the mean and standard deviation.
Bid-Ask Bounce
Concept: There is often a negative autocorrelation between consecutive price changes, especially in markets with a FIFO (First-In-First-Out) order matching system.
Application:
Only buy after a price downtick and sell after a price uptick.
Concept: There is often a negative autocorrelation between consecutive price changes, especially in markets with a FIFO (First-In-First-Out) order matching system.
Application:
Only buy after a price downtick and sell after a price uptick.
Capitalizes on short-term reversals in price movements
5. Implementation
Step-by-Step Process
Data : Gather real-time order book data, including bid and ask volumes at the top of the book
Calculate Skew: Compute the skew using the provided formula at each time interval
5. Implementation
Step-by-Step Process
Data : Gather real-time order book data, including bid and ask volumes at the top of the book
Calculate Skew: Compute the skew using the provided formula at each time interval
Apply Trading Rules:
Evaluate the skew against the thresholds k and L.
Check the current position against the position limit.
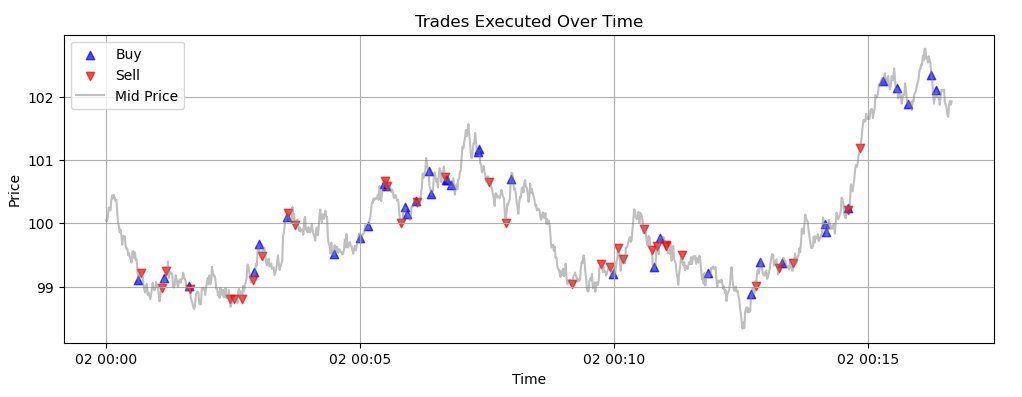
Execute Trades:
If conditions are met, execute a buy or sell order for the minimum quantity.
Evaluate the skew against the thresholds k and L.
Check the current position against the position limit.
Execute Trades:
If conditions are met, execute a buy or sell order for the minimum quantity.
Risk Monitoring:
Continuously monitor positions and ensure adherence to position limits.
Adjust thresholds as necessary based on market conditions (though over-optimization should be avoided).
Continuously monitor positions and ensure adherence to position limits.
Adjust thresholds as necessary based on market conditions (though over-optimization should be avoided).
Parameter Selection
Threshold k: Determines sensitivity to skew changes.
A smaller k leads to more frequent trades; a larger k results in fewer trades with potentially higher confidence.
Limit L:Filters out extreme skew values.
Set based on historical analysis of skew
Threshold k: Determines sensitivity to skew changes.
A smaller k leads to more frequent trades; a larger k results in fewer trades with potentially higher confidence.
Limit L:Filters out extreme skew values.
Set based on historical analysis of skew
distribution to exclude outliers.
Position Limit:
Based on capital availability and risk tolerance.
Should be conservative to prevent excessive exposure.
Order Execution
Minimum Quantity:Trades are executed for the minimum allowable quantity (e.g., 1 lot) to reduce
Position Limit:
Based on capital availability and risk tolerance.
Should be conservative to prevent excessive exposure.
Order Execution
Minimum Quantity:Trades are executed for the minimum allowable quantity (e.g., 1 lot) to reduce
market impact and slippage.
Adjust according to market liquidity and trading costs.
6. Optimization
Objective
Goal: Find optimal values for k and L that maximize strategy performance without overfitting.
Adjust according to market liquidity and trading costs.
6. Optimization
Objective
Goal: Find optimal values for k and L that maximize strategy performance without overfitting.
Methodology
Parameter Ranges: Define reasonable ranges based on domain knowledge (e.g., 1≤k≤5, 2≤L≤6).
Grid Search: Systematically evaluate combinations of k and L within the defined ranges.
Performance Metrics:
Sharpe Ratio: Measures risk-adjusted return.
Parameter Ranges: Define reasonable ranges based on domain knowledge (e.g., 1≤k≤5, 2≤L≤6).
Grid Search: Systematically evaluate combinations of k and L within the defined ranges.
Performance Metrics:
Sharpe Ratio: Measures risk-adjusted return.
Trade Count Adjustment: May divide the Sharpe Ratio by sqrt{n}, where nnn is the number of trades, to account for statistical confidence.
Avoid Overfitting:
Keep the number of parameters low.
Avoid optimizing for multiple objectives simultaneously.
Avoid Overfitting:
Keep the number of parameters low.
Avoid optimizing for multiple objectives simultaneously.
Use out-of-sample testing or cross-validation to assess robustness.
Optimization Techniques
Windowed Optimization:
Optimize parameters over rolling time windows to adapt to changing market conditions.
Balances responsiveness with stability.
Cross-Validation:
Split historical data into training and testing sets.
Windowed Optimization:
Optimize parameters over rolling time windows to adapt to changing market conditions.
Balances responsiveness with stability.
Cross-Validation:
Split historical data into training and testing sets.
• • •
Missing some Tweet in this thread? You can try to
force a refresh