Quant Science Profile picture
Sep 20, 2024 9 tweets 3 min read Read on X
In 10 lines of Python code, I can do a full portfolio optimization.

This is wild. Let me show how: Image
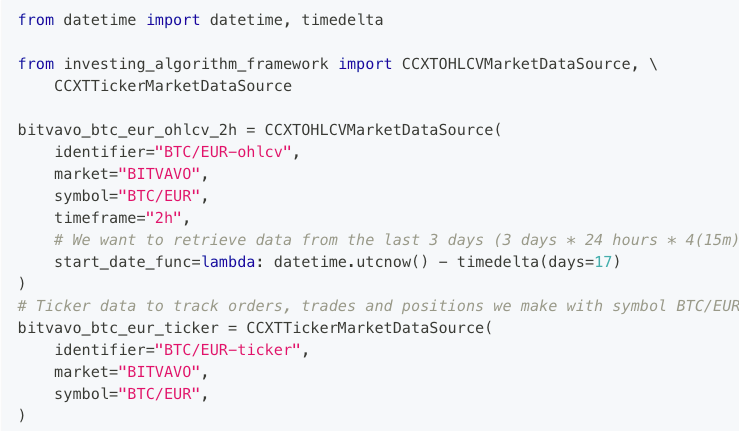
1. Load Python libraries

These are the python packages and functions we'll use. Image
2. Create a Maximum Sharpe Ratio Portfolio

We create a Maximum Sharpe Ratio model and then fit it on the training set.

portfolio_params are parameters passed to the Portfolio returned by the predict method. Image
3. Create a Benchmark

This is an inverse volatility portfolio that I'll compare my Max Sharpe portfolio against. Image
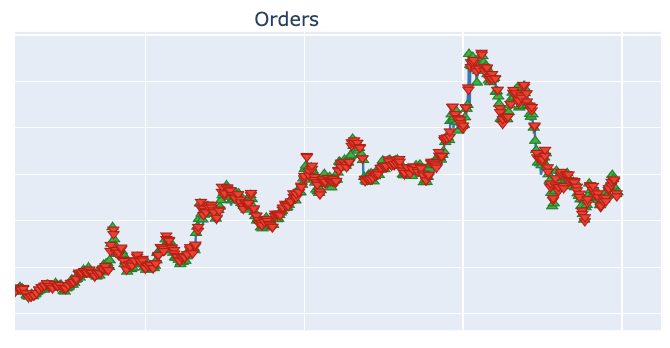
4. Out-Of-Sample Performance

Use Predict Method to get out-of-sample Portfolio Performance Image
5. Portfolio Composition

The visualizations from skfolio are incredible. Image
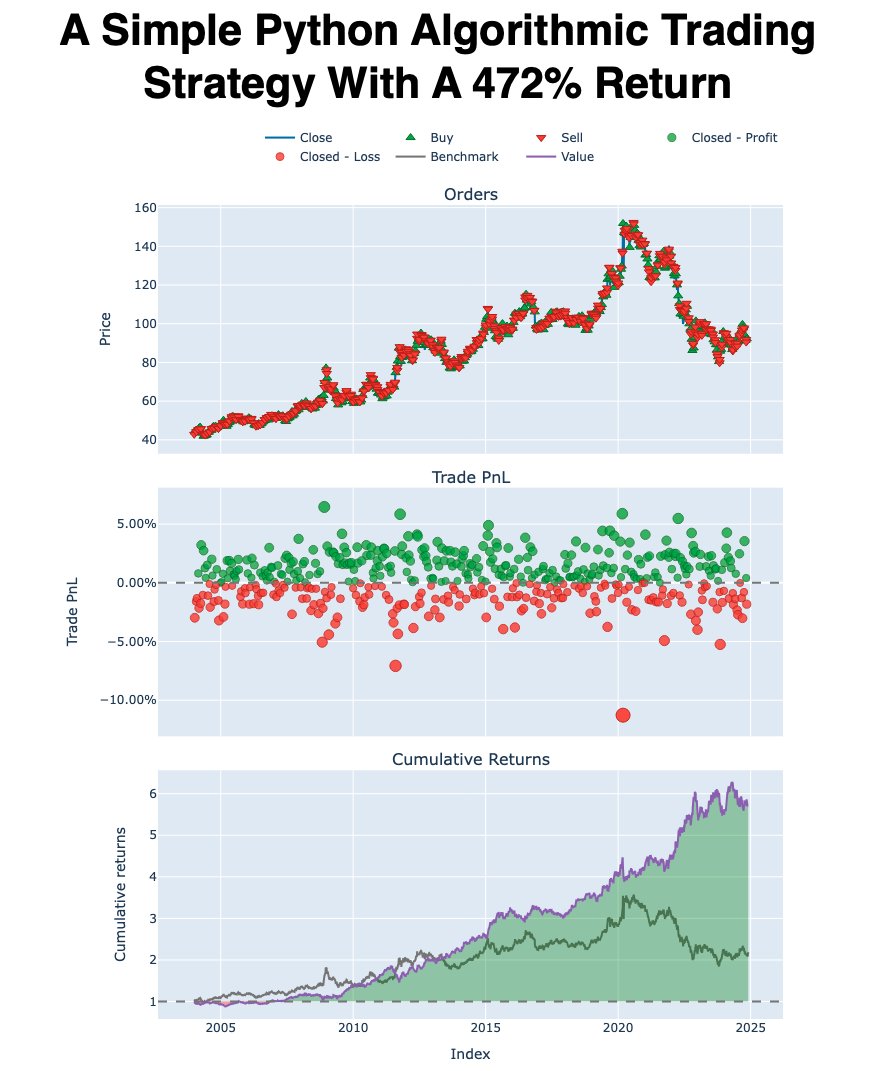
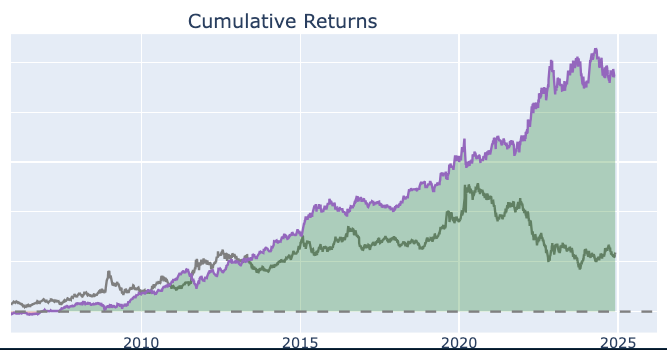
6. Cumulative Returns

In 1 line of code, we can get cumulative returns for our portfolio and benchmark. Image
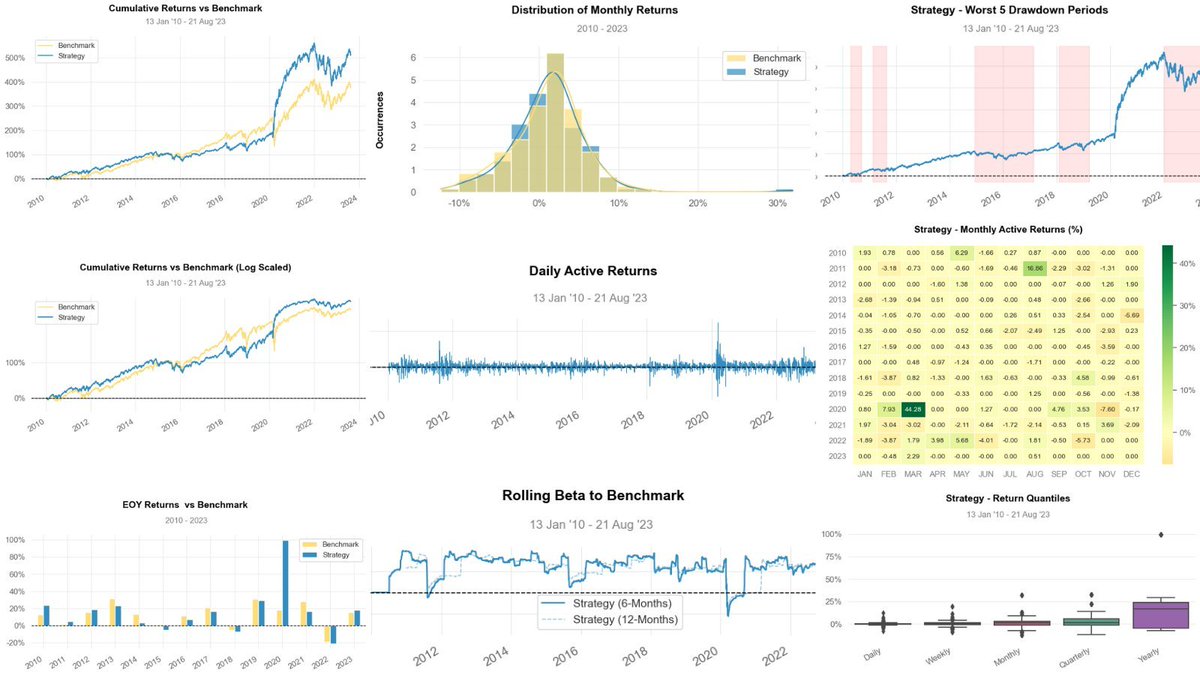
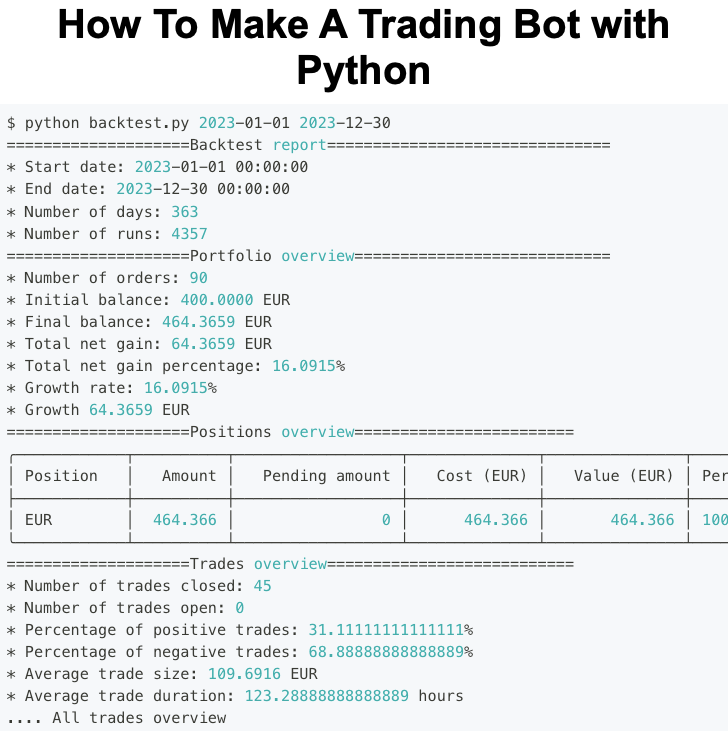
7. Performance Tear Sheet

In 1 line of code, I get a comprehensive performance tear sheet to share with clients. Image
Want to learn how to build algorithmic trading strategies in Python (that actually work)?

👉 Join us live for our free training (500 seats): learn.quantscience.io/python-algorit…
Image

• • •

Missing some Tweet in this thread? You can try to force a refresh
 

Keep Current with Quant Science

Quant Science Profile picture

Stay in touch and get notified when new unrolls are available from this author!

Read all threads

This Thread may be Removed Anytime!

PDF

Twitter may remove this content at anytime! Save it as PDF for later use!

Try unrolling a thread yourself!

how to unroll video
  1. Follow @ThreadReaderApp to mention us!

  2. From a Twitter thread mention us with a keyword "unroll"
@threadreaderapp unroll

Practice here first or read more on our help page!

More from @quantscience_

Jul 15
12 Python libraries for free market data everyone should know: Image
yfinance

Data for stocks (historic, intraday, fundamental), FX, crypto, and options. Uses Yahoo Finance so any data available through Yahoo is available through yfinance.

github.com/ranaroussi/yfi…
pandas-datareader

pandas-datareader used to be part of the pandas project. Now an independent project. Includes data for stocks, FX, economic indicators, Fama-French factors, and many others.

pandas-datareader.readthedocs.io/en/latest/
Read 17 tweets
Jul 14
Stock Prediction AI: Using Machine Learning and Deep Learning to predict stock price movements in Python.

The Python code is 100% free on GitHub.

Let's dive in (bookmark this): Image
1. The Python Machine Learning and Deep Learning Libraries:

- mxnet
- gluon
- sklearn
- xgboost Image
2. Stock Price Data (Train/Test)

The dashed vertical line represents the separation between training and test data.

GS is shown but will use 72 assets.

Daily prices for each asset. Image
Read 13 tweets
Jul 12
🚨BREAKING: A new Python library for algorithmic trading.

Introducing TensorTrade: An open-source Python framework for trading using Reinforcement Learning (AI) Image
TensorTrade is an open source Python framework for building, training, evaluating, and deploying robust trading algorithms using reinforcement learning leveraging:

- numpy
- pandas
- gym
- keras
- tensorflow
Example: Using TensorTrade to Train and Evaluate with Reinforcement Learning

Step 1: Create training and evaluation sets

We'll start by creating a training and evaluation set as CSV files. Image
Read 10 tweets
Jul 11
In investing, your track record is everything.

In 2 minutes, I'll uncover the secrets hedge funds use to track their portfolio performance: 🧵 Image
There are 3 main areas that smart investors care about:

1. Profits (Returns)
2. Risks
3. Drawdowns

Let's break them down using the snapshot:
1. Profitability Insights

Annual Return: 22.44%—strong growth!

CAGR: 23.78%—compounded gains over time.

MAR: 0% (minimum acceptable)—room to beat risk-free rates.

Significance level (5%) sets the risk benchmark.
Read 9 tweets
Jul 10
How to create a Black-Litterman portfolio in Python.

A thread: 🧵 Image
1. What is Black-Litterman?

Black-Litterman starts with market equilibrium returns (from CAPM) and lets you add your views (e.g., “Tesla will outperform”).

It balances both to create optimal weights. No overfitting, just math.
2. How it works

Using skfolio in Python, you:

- Compute market returns (e.g., S&P 500).
- Add views (e.g., 5% outperformance for tech).
- Blend with confidence levels.
- Optimize weights.
Read 10 tweets
Jul 6
This guy made a real-world AI Hedge Fund Team in Python.

Then he made it available for everyone for free.

Here's how he did it (and how you can too). Image
@virattt is doing something incredible.

He's using AI to replicate a hedge fund.

And he's open-sourced it for the world to learn.
@virattt The main components of the project:

1 • agents
2 • tools
3 • backtester Image
Read 10 tweets

Did Thread Reader help you today?

Support us! We are indie developers!


This site is made by just two indie developers on a laptop doing marketing, support and development! Read more about the story.

Become a Premium Member ($3/month or $30/year) and get exclusive features!

Become Premium

Don't want to be a Premium member but still want to support us?

Make a small donation by buying us coffee ($5) or help with server cost ($10)

Donate via Paypal

Or Donate anonymously using crypto!

Ethereum

0xfe58350B80634f60Fa6Dc149a72b4DFbc17D341E copy

Bitcoin

3ATGMxNzCUFzxpMCHL5sWSt4DVtS8UqXpi copy

Thank you for your support!

Follow Us!

:(