Crémieux Profile picture
Sep 23 7 tweets 3 min read Read on X
The FBI has finally released crime statistics for 2023!

Let's have a short thread.

First thing up is recent violent crime trends: Image
Now let's focus in on homicides.

The homicide statistics split by race show the same distribution they have for years. Image
As with every crime, it's still men doing the killing, but it's also largely men doing the dying. Image
What about Hispanics? Their data is still a mess, but here it is if you're interested. Image
The age-crime curve last year looked pretty typical. How about this year?

Same as always. Victims and offenders still have highly similar, relatively young ages. Image
Everything else, from locations to motives to weapons is pretty similar to previous years. What's different is that the OP might show incorrect numbers.

For the past two years, the FBI has silently updated their numbers after about two weeks.

You can use the web archive to see that the data from the OP is the data shown at release last year, and the data from 2023 is the 2022 data with the FBI's suggested reductions (i.e., -11.6% homicides, -2.8% aggravated assaults, -0.3% robberies, etc.).

But you can see on their site now that they've adjusted the numbers up, so the reduction they suggested has brought us down to a figure that's less impressive than my chart shows. The difference isn't huge so I showed the OP without updating to their new data.

For reference, 2022 as reported then had a homicide rate of 6.3/100k, and they silently updated that to 7.48/100k. The 2023 data they provided today actually has a murder rate of 6.61/100k, higher than last year's initially-reported number, but lower than the updated number. To make matters worse, if you use their Expanded Homicides Report, you get a rate of 5.94 for 2022 and 5.24 for 2023.

Methodology matters and we get to see inconsistency in this year's data, not even data that's been updated or anything. It's a mess, so take everything with a grain of salt and, in the interest of caution, only interpret trends. Trends are mostly common between all data sources even if the absolute magnitudes are off, constantly updated, etc.

• • •

Missing some Tweet in this thread? You can try to force a refresh
 

Keep Current with Crémieux

Crémieux Profile picture

Stay in touch and get notified when new unrolls are available from this author!

Read all threads

This Thread may be Removed Anytime!

PDF

Twitter may remove this content at anytime! Save it as PDF for later use!

Try unrolling a thread yourself!

how to unroll video
  1. Follow @ThreadReaderApp to mention us!

  2. From a Twitter thread mention us with a keyword "unroll"
@threadreaderapp unroll

Practice here first or read more on our help page!

More from @cremieuxrecueil

Sep 20
Innovation is the backbone of modern economic growth, and without the Protestants, we probably wouldn't have it🧵

Consider the period of the Counter-Reformation. During this time, the Catholic Church set science back in the territories it governed: Image
Before the Counter-Reformation, Catholic and Protestant Europe were on similar scientific trajectories:

They produced comparable numbers of scientists, comparably important intellectuals, and comparable numbers of inventions. Image
But, seemingly overnight, Catholics started rampaging against intellectualism, and they had a focused impact on scientists, with no appreciable impacts on artists or other types of intellectuals.

Protestantism promoted the separation of Church and Science, so this makes sense. Image
Read 12 tweets
Sep 19
Are LLMs smart like humans are smart? Short🧵

If you give them a battery of tests built for LLMs or covering topics like U.S. History, you can end up with a model that is unidimensional, much like how human intelligence is: Image
I previously attempted to fit such a model and was unsuccessful because many LLMs are practically the same person, leading to a fitting failure.

These authors obviated that issue by pruning highly similar LLMs with DBSCAN and other means.

The result was a model that fits, when you have a bifactor solution, and not when you have a single-factor one or two non-general factors.

The result is, frankly, a bit cobbled together and hacky, but you have to live with that if you want a model that's even facially fine.
Read 8 tweets
Sep 16
I have a pretty major update for one of my articles.

It has to do with Justice Jackson's comment that when Black newborns are delivered by Black doctors, they're much more likely to survive, justifying racially discriminatory admissions.

We now know she was wrong🧵 Image
So if you don't recall, here's how Justice Jackson described the original study's findings.

She was wrong to describe it this way, because she mixed up percentage points with percentages, and she's referring to the uncontrolled rather than the fully-controlled effect. Image
After I saw her mention this, I looked into the study and found that its results all seemed to have p-values between 0.10 and 0.01.

Or in other words, the study was p-hacked. Image
Read 14 tweets
Sep 12
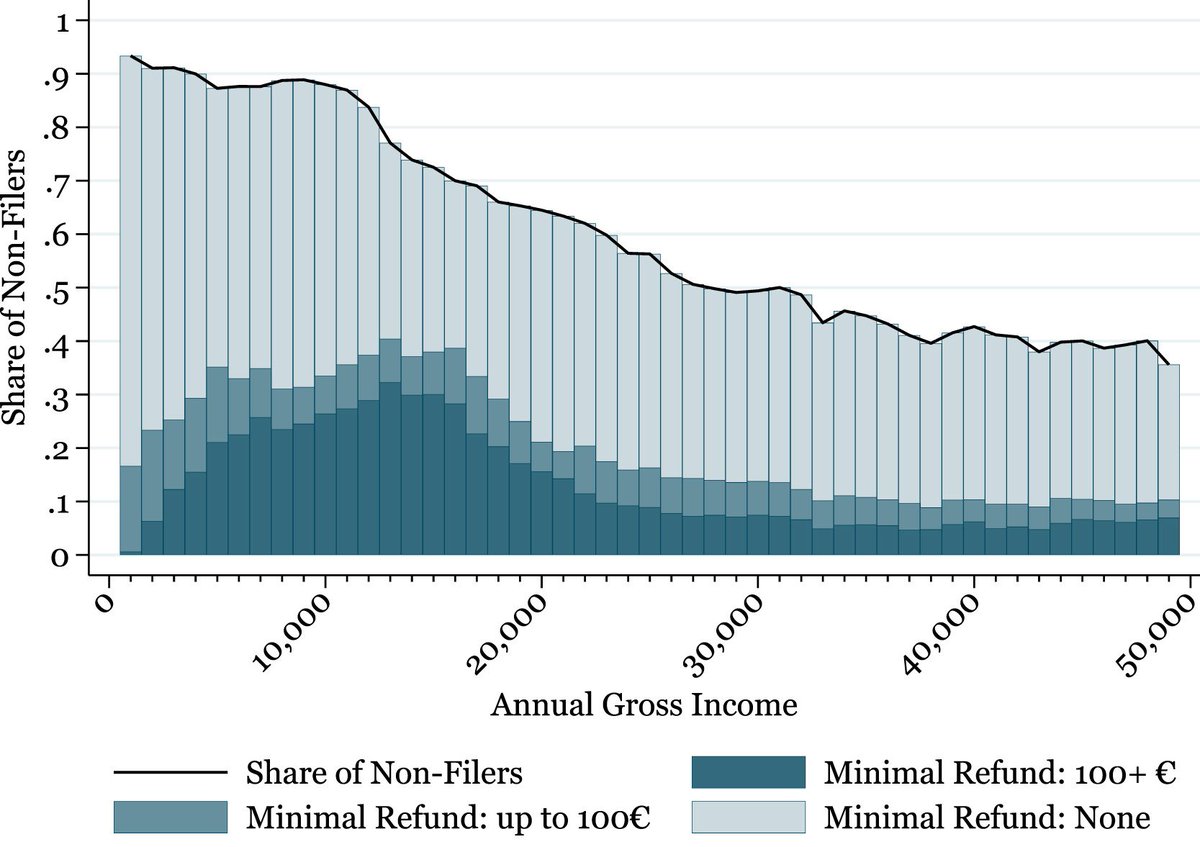
More than thirty countries globally have automatic non-filing options for taxpayers.

Many people claim these help to make the tax system more fair by taking out tax hassle and guesswork.

But German data suggests they might make the tax system less progressive🧵Image
The first thing to note is that the lower the income, the greater the odds of not filing, with almost 90% of those earning just €10,000 choosing not to file.

At an income of about €50,000, the relationship asymptotes at roughly 30% non-filers. Image
Another thing to note is that, consistent with the tax system being progressive in general, lower-income individuals are entitled to refunds more often. Image
Read 10 tweets
Sep 11
I've explained once before that group and individual IQs can have divergent meanings.

People still insist that Sub-Saharan African countries succeed more than predicted by their national IQs, but I don't see it.

So let's estimate what their IQs should be given their success:
Image
The simple way to do this is to remove Sub-Saharan Africa from a regression of log(GDP PPP Per Capita), for which I'm using 2019 to avoid the pandemic and get closer to the sampling years.

Like this, we get:

Measured IQ: 71.96
Predicted IQ: 74.86
Predicted, sans SSA: 76.78
In other words, no big difference.

But, you might say, aren't logs doing the work? Well, they're appropriate here, so no, but without them, we get:

Predicted IQ: 78.29
Predicted, sans SSA: 82.47
Read 12 tweets
Sep 8
Many people think that government fertility policy has no effects on fertility.

You don't need to be a genius to see the year France instituted means testing, reducing benefits and resulting in lowered fertility. Image
If you can't see it, here's a labeled chart. Image
That reform affected top earners. Other reforms have affected the same strata, and some have affected bottom earners.

For example, when Germany reduced welfare-takers' incomes by 18%, fertility fell by 6.8%: Image
Read 7 tweets

Did Thread Reader help you today?

Support us! We are indie developers!


This site is made by just two indie developers on a laptop doing marketing, support and development! Read more about the story.

Become a Premium Member ($3/month or $30/year) and get exclusive features!

Become Premium

Don't want to be a Premium member but still want to support us?

Make a small donation by buying us coffee ($5) or help with server cost ($10)

Donate via Paypal

Or Donate anonymously using crypto!

Ethereum

0xfe58350B80634f60Fa6Dc149a72b4DFbc17D341E copy

Bitcoin

3ATGMxNzCUFzxpMCHL5sWSt4DVtS8UqXpi copy

Thank you for your support!

Follow Us!

:(