The College Board just released this year's SAT scores!
I thought I'd go ahead and put everything in familiar terms and make some plots.
This thread will have a lot of pictures. First up: How did everyone do?
I thought I'd go ahead and put everything in familiar terms and make some plots.
This thread will have a lot of pictures. First up: How did everyone do?

All of the typical race differences are there. Blacks did roughly 15 IQ points worse, Hispanics did about 10 points worse, Asians did similarly better, etc.
If we scale all that by the sizes of the populations who took the tests, we get this:
If we scale all that by the sizes of the populations who took the tests, we get this:

Another way to look at this data is to stack everyone into a single population, like so:

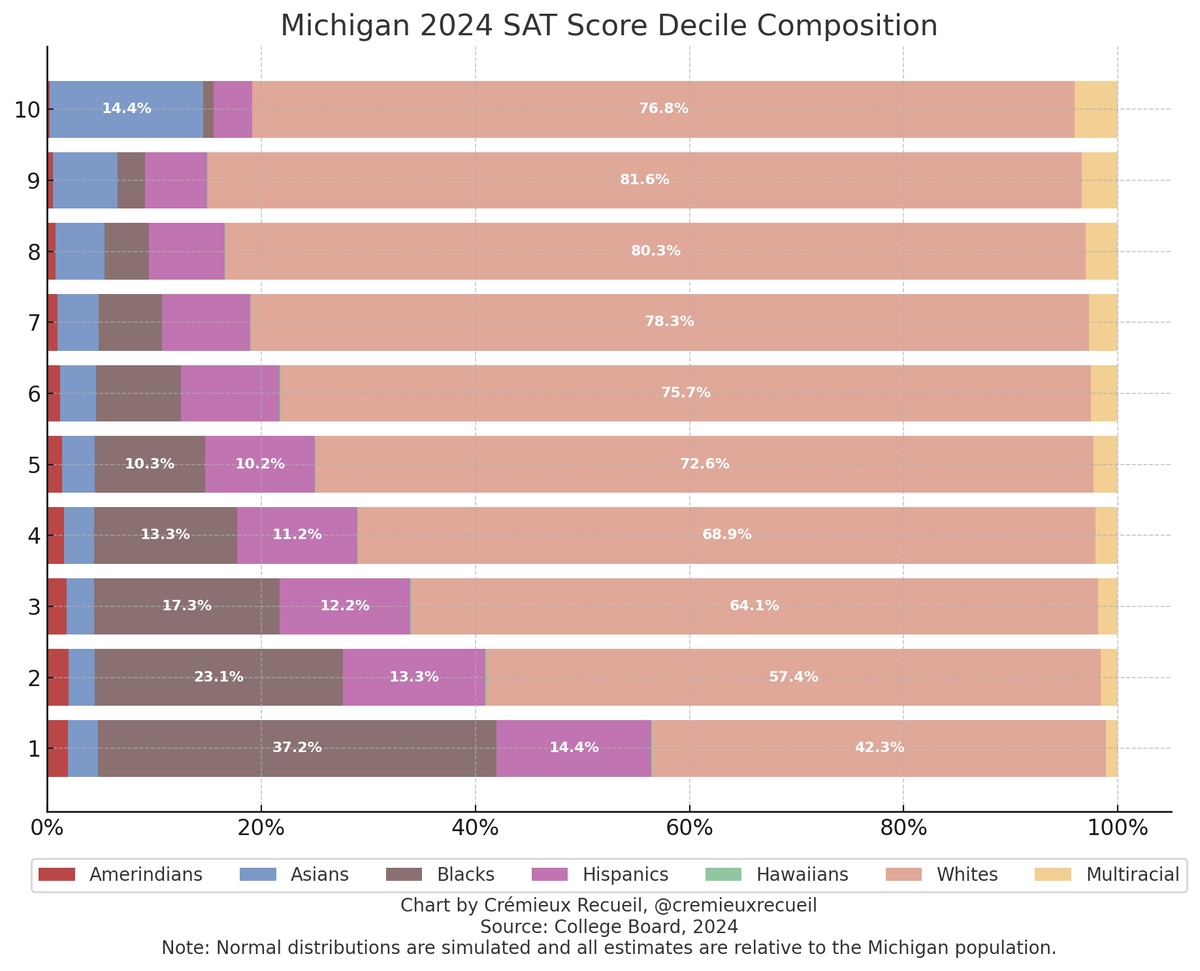
Alternatively, we can get a picture of tomorrow's elites and underclasses by looking at deciles.
The top decile is almost as Asian as it is White! Combined with limited local university prefs, this helps to explain why Asians have been displacing Whites at elite universities.
The top decile is almost as Asian as it is White! Combined with limited local university prefs, this helps to explain why Asians have been displacing Whites at elite universities.

Now, you might wonder: Isn't the national data plagued by representativeness issues because of selection into testing?
Yes! But not in Michigan. In that state, practically everyone takes the test, so the results are more representative of its population.
Yes! But not in Michigan. In that state, practically everyone takes the test, so the results are more representative of its population.

In Michigan, the results are all quite similar, except Asians have noticeably higher variance.

The decile composition of Michigan is also far less Asian at the top, because Michigan is less Asian than the national sample and it has more Whites.
There are other states with representative sampling of their local populations, and D.C. is in that group too. There are also some states where practically everyone takes the ACT, and we definitely need to look at those results as well.
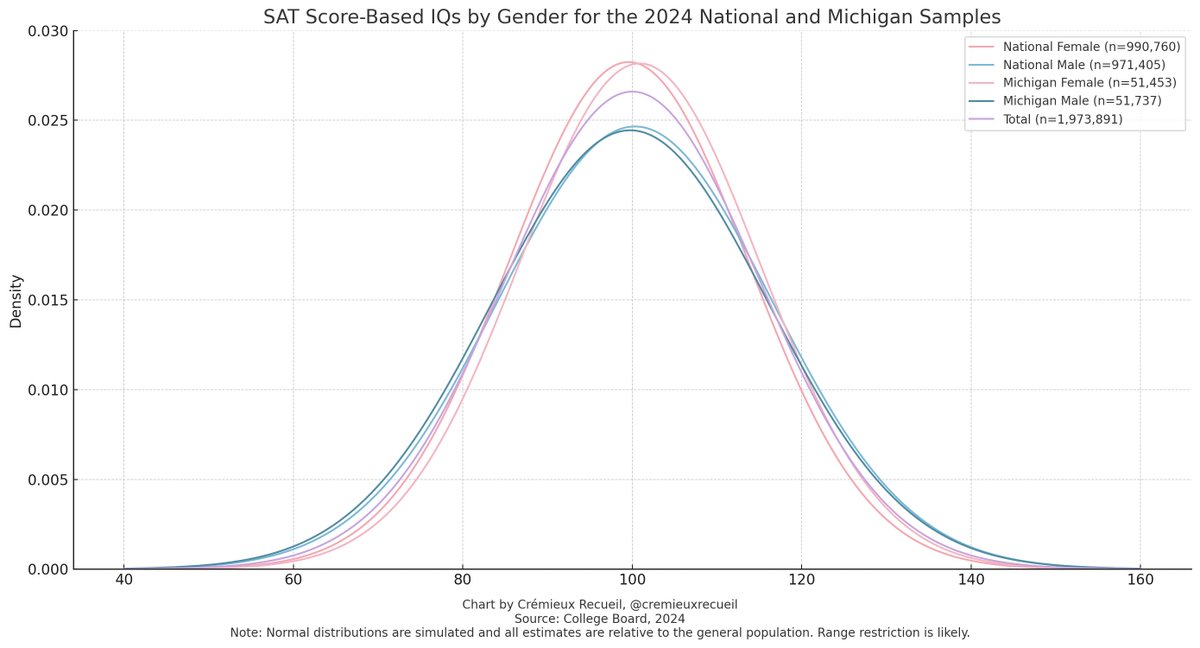
What about sex differences? Well those are always important, and they replicate the differences seen in other years!
Beyond the variance differences, we see that girls outperform boys in Michigan (representatively sampled) while underperforming nationally (selectively sampled).
Beyond the variance differences, we see that girls outperform boys in Michigan (representatively sampled) while underperforming nationally (selectively sampled).
To learn more, see my latest article: cremieux.xyz/p/2024-sat-dat…
• • •
Missing some Tweet in this thread? You can try to
force a refresh