Crémieux Profile picture
Sep 25 10 tweets 3 min read Read on X
The College Board just released this year's SAT scores!

I thought I'd go ahead and put everything in familiar terms and make some plots.

This thread will have a lot of pictures. First up: How did everyone do? Image
All of the typical race differences are there. Blacks did roughly 15 IQ points worse, Hispanics did about 10 points worse, Asians did similarly better, etc.

If we scale all that by the sizes of the populations who took the tests, we get this: Image
Another way to look at this data is to stack everyone into a single population, like so: Image
Alternatively, we can get a picture of tomorrow's elites and underclasses by looking at deciles.

The top decile is almost as Asian as it is White! Combined with limited local university prefs, this helps to explain why Asians have been displacing Whites at elite universities. Image
Now, you might wonder: Isn't the national data plagued by representativeness issues because of selection into testing?

Yes! But not in Michigan. In that state, practically everyone takes the test, so the results are more representative of its population. Image
In Michigan, the results are all quite similar, except Asians have noticeably higher variance. Image
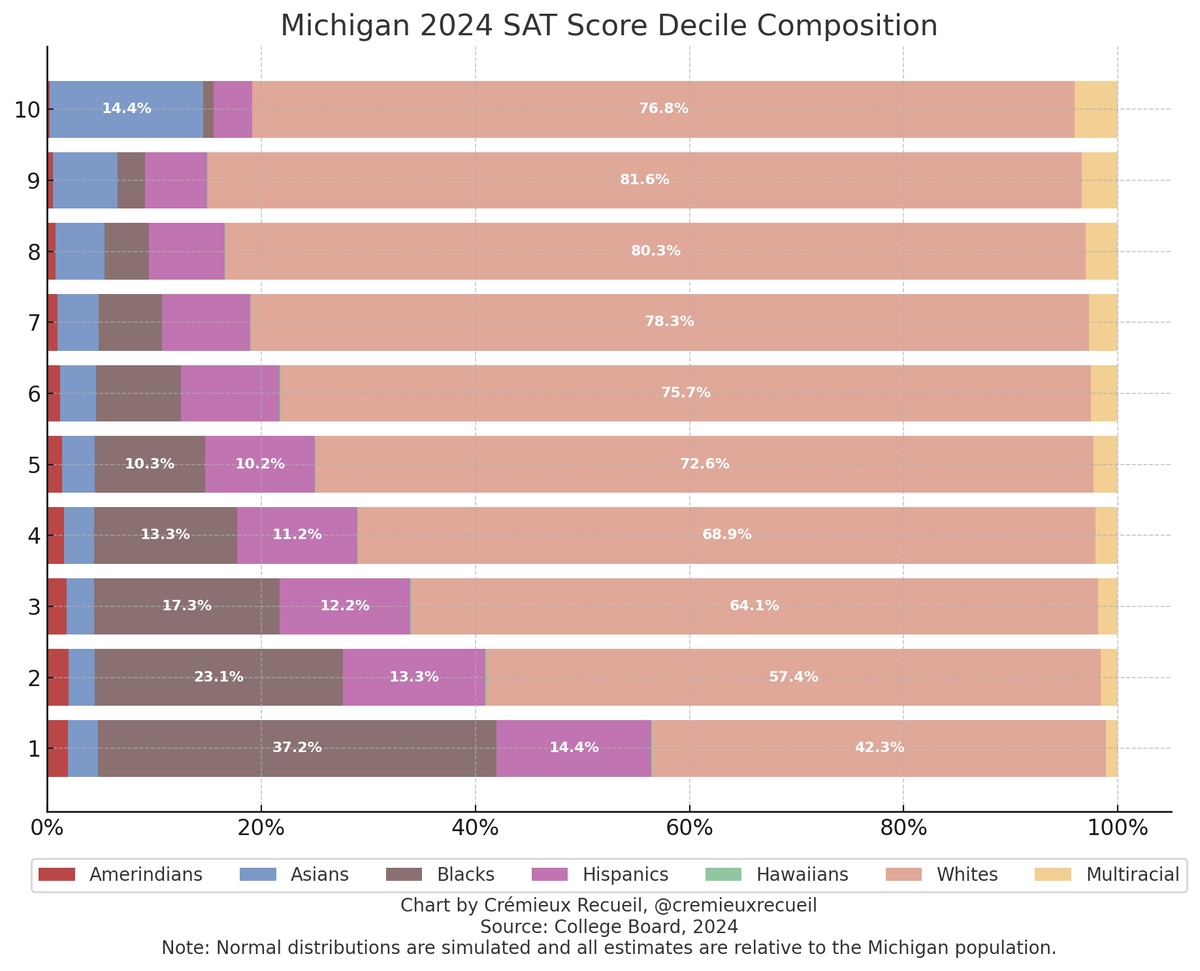
The decile composition of Michigan is also far less Asian at the top, because Michigan is less Asian than the national sample and it has more Whites. Image
There are other states with representative sampling of their local populations, and D.C. is in that group too. There are also some states where practically everyone takes the ACT, and we definitely need to look at those results as well.
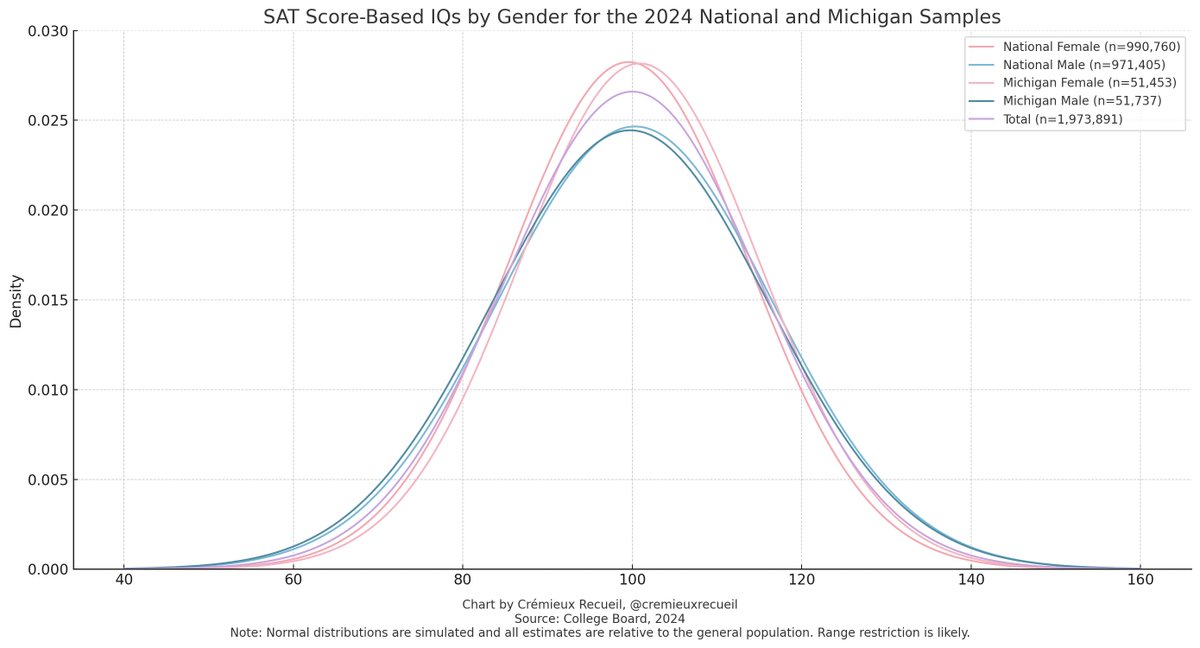
What about sex differences? Well those are always important, and they replicate the differences seen in other years!

Beyond the variance differences, we see that girls outperform boys in Michigan (representatively sampled) while underperforming nationally (selectively sampled). Image
To learn more, see my latest article: cremieux.xyz/p/2024-sat-dat…

• • •

Missing some Tweet in this thread? You can try to force a refresh
 

Keep Current with Crémieux

Crémieux Profile picture

Stay in touch and get notified when new unrolls are available from this author!

Read all threads

This Thread may be Removed Anytime!

PDF

Twitter may remove this content at anytime! Save it as PDF for later use!

Try unrolling a thread yourself!

how to unroll video
  1. Follow @ThreadReaderApp to mention us!

  2. From a Twitter thread mention us with a keyword "unroll"
@threadreaderapp unroll

Practice here first or read more on our help page!

More from @cremieuxrecueil

Sep 24
A few days ago, I wrote about evidence that the Counter-Reformation impeded scientific progress in the Catholic world relative to the Protestant one.

The evidence doesn't stop there. Lots of places diverge predictably🧵

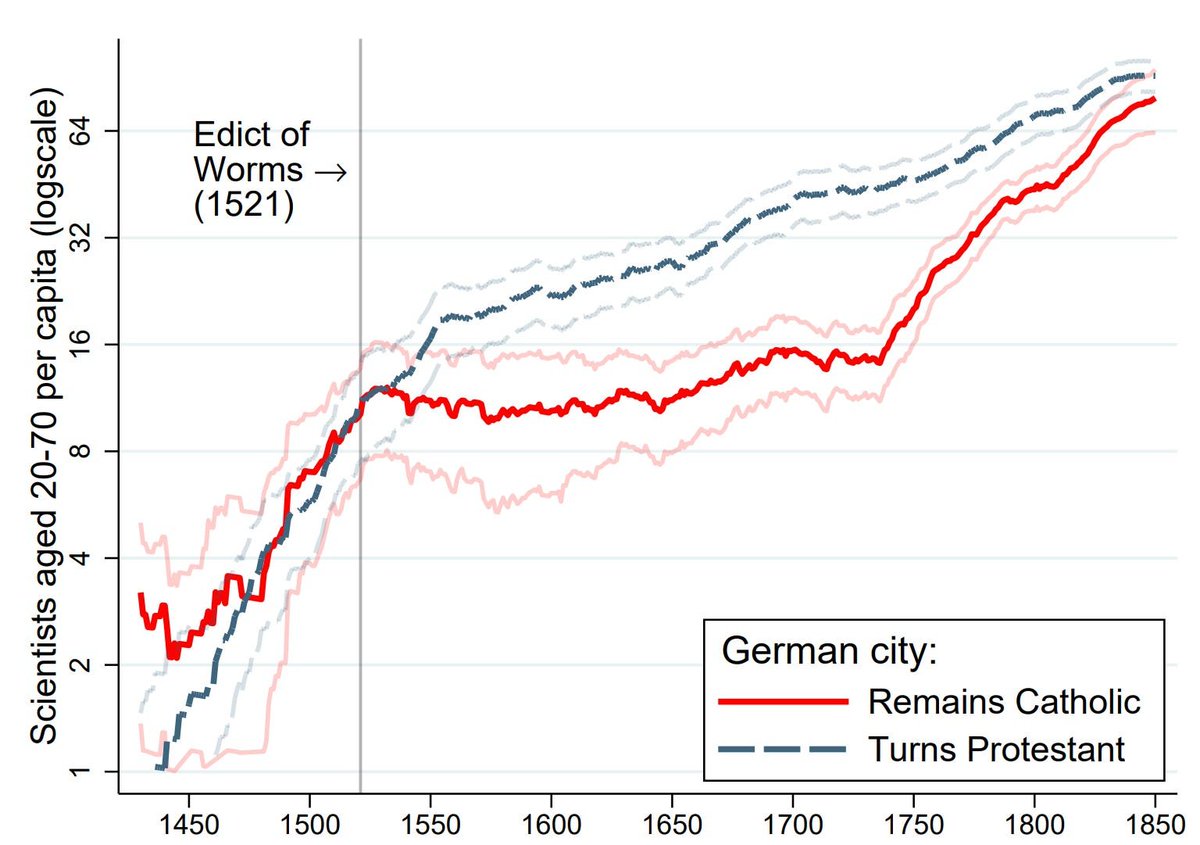
First, Catholic and Protestant German cities:
Image
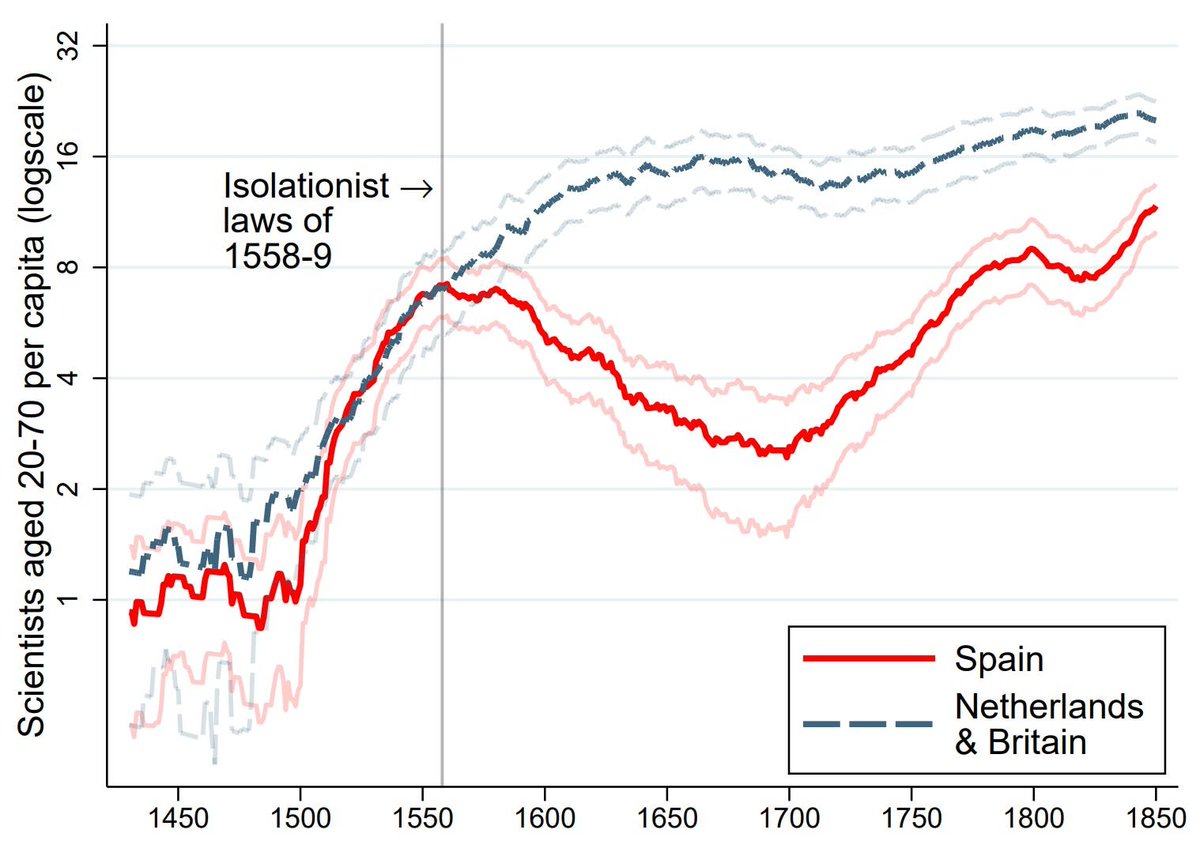
When does Spain fall behind the Netherlands and Britain?

After they got worked up about Protestant cells in the country, leading to a crackdown. Image
When did the Catholic Dutch fall behind the Protestant Dutch?

After the Spanish reasserted themselves in the southern parts of the Low Countries. Image
Read 9 tweets
Sep 23
The FBI has finally released crime statistics for 2023!

Let's have a short thread.

First thing up is recent violent crime trends: Image
Now let's focus in on homicides.

The homicide statistics split by race show the same distribution they have for years. Image
As with every crime, it's still men doing the killing, but it's also largely men doing the dying. Image
Read 7 tweets
Sep 20
Innovation is the backbone of modern economic growth, and without the Protestants, we probably wouldn't have it🧵

Consider the period of the Counter-Reformation. During this time, the Catholic Church set science back in the territories it governed: Image
Before the Counter-Reformation, Catholic and Protestant Europe were on similar scientific trajectories:

They produced comparable numbers of scientists, comparably important intellectuals, and comparable numbers of inventions. Image
But, seemingly overnight, Catholics started rampaging against intellectualism, and they had a focused impact on scientists, with no appreciable impacts on artists or other types of intellectuals.

Protestantism promoted the separation of Church and Science, so this makes sense. Image
Read 12 tweets
Sep 19
Are LLMs smart like humans are smart? Short🧵

If you give them a battery of tests built for LLMs or covering topics like U.S. History, you can end up with a model that is unidimensional, much like how human intelligence is: Image
I previously attempted to fit such a model and was unsuccessful because many LLMs are practically the same person, leading to a fitting failure.

These authors obviated that issue by pruning highly similar LLMs with DBSCAN and other means.

The result was a model that fits, when you have a bifactor solution, and not when you have a single-factor one or two non-general factors.

The result is, frankly, a bit cobbled together and hacky, but you have to live with that if you want a model that's even facially fine.
Read 8 tweets
Sep 16
I have a pretty major update for one of my articles.

It has to do with Justice Jackson's comment that when Black newborns are delivered by Black doctors, they're much more likely to survive, justifying racially discriminatory admissions.

We now know she was wrong🧵 Image
So if you don't recall, here's how Justice Jackson described the original study's findings.

She was wrong to describe it this way, because she mixed up percentage points with percentages, and she's referring to the uncontrolled rather than the fully-controlled effect. Image
After I saw her mention this, I looked into the study and found that its results all seemed to have p-values between 0.10 and 0.01.

Or in other words, the study was p-hacked. Image
Read 14 tweets
Sep 12
More than thirty countries globally have automatic non-filing options for taxpayers.

Many people claim these help to make the tax system more fair by taking out tax hassle and guesswork.

But German data suggests they might make the tax system less progressive🧵Image
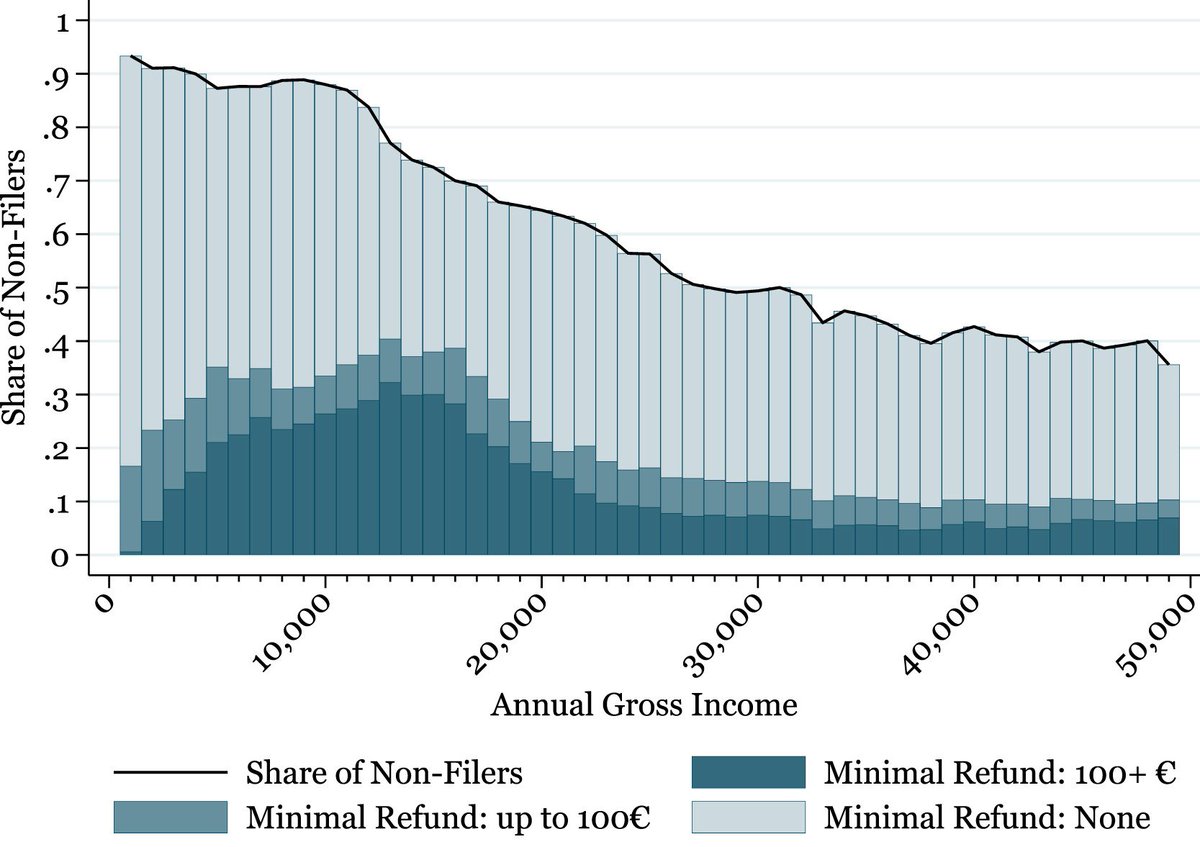
The first thing to note is that the lower the income, the greater the odds of not filing, with almost 90% of those earning just €10,000 choosing not to file.

At an income of about €50,000, the relationship asymptotes at roughly 30% non-filers. Image
Another thing to note is that, consistent with the tax system being progressive in general, lower-income individuals are entitled to refunds more often. Image
Read 10 tweets

Did Thread Reader help you today?

Support us! We are indie developers!


This site is made by just two indie developers on a laptop doing marketing, support and development! Read more about the story.

Become a Premium Member ($3/month or $30/year) and get exclusive features!

Become Premium

Don't want to be a Premium member but still want to support us?

Make a small donation by buying us coffee ($5) or help with server cost ($10)

Donate via Paypal

Or Donate anonymously using crypto!

Ethereum

0xfe58350B80634f60Fa6Dc149a72b4DFbc17D341E copy

Bitcoin

3ATGMxNzCUFzxpMCHL5sWSt4DVtS8UqXpi copy

Thank you for your support!

Follow Us!

:(