
PMC COVID-19 Forecasting Model, Sep 30, 2024
🧵 1/5
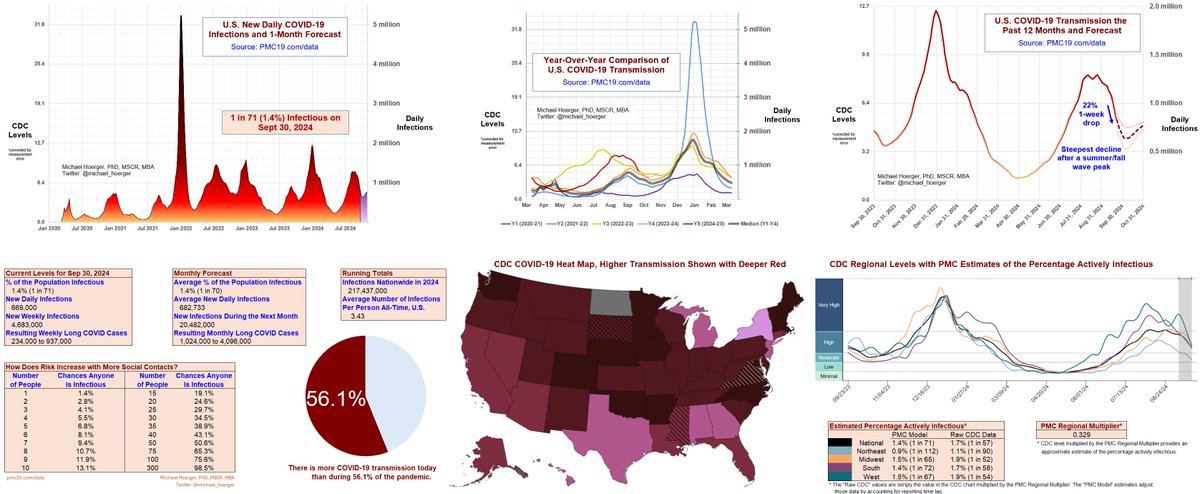
COVID transmission remains extremely high, but we're entering a "lull" in the U.S. sooner than anticipated.
Among all summer/fall waves, the 22% 1-week drop in transmission is steepest all-time.
Details:
In Friday's data release, the CDC retroactively corrected the prior week's numbers downward 6% (for Sep 14). This is a big correction, bigger than average, but nothing nefarious. The most recent week's numbers show an additional 1-week decline in transmission of 22% (from Sep 14 to Sep 21) on top of that 6% correction (for Sep 14), so the transmission estimates have fallen quickly.
Looking back, we estimate that the 1-week drop of 22% is the largest decline on the back end of any summer/fall wave in the U.S.
*If* these numbers hold against future retroactive corrections, it means people have about 5 weeks of similar transmission from today through Nov 7.
Why might we have seen a record decline in post-peak transmission?
Several hypotheses:
1) Reporting Error: The 22% decline could be driven in part by errors in real-time reporting. These average is 5%, based on our analyses of Biobot wastewater data. We do not have long-term data on the accuracy of Verily/CDC real-time reports versus retrospectively corrected values. In the updated graphic, we have added 95% confidence intervals for the real-time values based on Biobot data, which show that 95% of real-time errors fall within 8.33%. Note that the dotted lines do not show 95% confidence intervals for the forecast, merely how the best estimates would change if a large error in the real-time reports of +/- 8.33%. It’s possible that next week the data will get corrected upward, and the forecast will more resemble the top dashed line. In the next Tweet, we show the forecast for our old (Biobot-based model); it’s still showing a slower decline, but they update their data about 5 days slower than the CDC, so it is unclear whether it’s a big real-time reporting error at the CDC or just that the CDC is ahead of the game.
2) Unprecedented School Transmission: This is the largest wave during the August back-to-school period. It’s possible transmission disproportionately affected school children and their families, and in being more targeted than typical transmission, the wave went down faster that what is normative thus far in the pandemic.
3) Laissez Faire Public Health: Public health guidance has weakened (e.g., 1-day isolation policy, not strongly pushing additional mitigation), which likely pushed the peak of the 9th wave higher, which could have led to a faster-than-usual resolution. The model accounts for these changing dynamics reasonably well, but with the school issue noted in hypothesis #2, it is possible the weakened public health guidance disproportionately hit a subset of the population, which altered the back side of the wave.
4) Missing Data: There are no widespread state-level instances of missing data, as is often the case. It is possible that specific areas did not report this week, and if there is a bias toward higher transmission in those places, the numbers will get retroactively corrected upward. This is one example of the issues that contribute to #1.
5) Politics: There is no evidence to suggest the CDC is modifying transmission data for political reasons. We put deep trust in the fundamental scientists doing the critical work translating wastewater into meaningful downloadable data. The inferences, agency graphs, and guidance can be influenced by politics, but the data are sound, given the limitations noted under #1.
Overall, if the data hold or anything reasonable within the ballpark, which is likely, this means a more prolonged and slightly lower lull than previously anticipated. Those putting off medical appointments and other risky activities may see this as a slightly broader window (today through Nov 7) to get things done. Note that even under the most optimistic forecasting scenarios, transmission remains very high in absolute terms, even if low in relative terms.
🧵 1/5
COVID transmission remains extremely high, but we're entering a "lull" in the U.S. sooner than anticipated.
Among all summer/fall waves, the 22% 1-week drop in transmission is steepest all-time.
Details:
In Friday's data release, the CDC retroactively corrected the prior week's numbers downward 6% (for Sep 14). This is a big correction, bigger than average, but nothing nefarious. The most recent week's numbers show an additional 1-week decline in transmission of 22% (from Sep 14 to Sep 21) on top of that 6% correction (for Sep 14), so the transmission estimates have fallen quickly.
Looking back, we estimate that the 1-week drop of 22% is the largest decline on the back end of any summer/fall wave in the U.S.
*If* these numbers hold against future retroactive corrections, it means people have about 5 weeks of similar transmission from today through Nov 7.
Why might we have seen a record decline in post-peak transmission?
Several hypotheses:
1) Reporting Error: The 22% decline could be driven in part by errors in real-time reporting. These average is 5%, based on our analyses of Biobot wastewater data. We do not have long-term data on the accuracy of Verily/CDC real-time reports versus retrospectively corrected values. In the updated graphic, we have added 95% confidence intervals for the real-time values based on Biobot data, which show that 95% of real-time errors fall within 8.33%. Note that the dotted lines do not show 95% confidence intervals for the forecast, merely how the best estimates would change if a large error in the real-time reports of +/- 8.33%. It’s possible that next week the data will get corrected upward, and the forecast will more resemble the top dashed line. In the next Tweet, we show the forecast for our old (Biobot-based model); it’s still showing a slower decline, but they update their data about 5 days slower than the CDC, so it is unclear whether it’s a big real-time reporting error at the CDC or just that the CDC is ahead of the game.
2) Unprecedented School Transmission: This is the largest wave during the August back-to-school period. It’s possible transmission disproportionately affected school children and their families, and in being more targeted than typical transmission, the wave went down faster that what is normative thus far in the pandemic.
3) Laissez Faire Public Health: Public health guidance has weakened (e.g., 1-day isolation policy, not strongly pushing additional mitigation), which likely pushed the peak of the 9th wave higher, which could have led to a faster-than-usual resolution. The model accounts for these changing dynamics reasonably well, but with the school issue noted in hypothesis #2, it is possible the weakened public health guidance disproportionately hit a subset of the population, which altered the back side of the wave.
4) Missing Data: There are no widespread state-level instances of missing data, as is often the case. It is possible that specific areas did not report this week, and if there is a bias toward higher transmission in those places, the numbers will get retroactively corrected upward. This is one example of the issues that contribute to #1.
5) Politics: There is no evidence to suggest the CDC is modifying transmission data for political reasons. We put deep trust in the fundamental scientists doing the critical work translating wastewater into meaningful downloadable data. The inferences, agency graphs, and guidance can be influenced by politics, but the data are sound, given the limitations noted under #1.
Overall, if the data hold or anything reasonable within the ballpark, which is likely, this means a more prolonged and slightly lower lull than previously anticipated. Those putting off medical appointments and other risky activities may see this as a slightly broader window (today through Nov 7) to get things done. Note that even under the most optimistic forecasting scenarios, transmission remains very high in absolute terms, even if low in relative terms.

PMC COVID-19 Forecasting Model, Sep 30, 2024
🧵 2/5
Note that while the CDC data show an unprecedentedly steep decline, Biobot data suggest more gradual changes, along the lines we have been forecasting the past several weeks.
This graph shows a resurrected version of our discontinued model 1 (Biobot-only) forecast.
I would not be surprised if the CDC data get retroactively corrected upward a little bit (this is common, not nefarious), AND the Biobot data go down a bit faster (they lag the CDC data by about 5 extra days). There is regional variation between the data sets, which means that BOTH models could actually be accurate without corrections.
Nonetheless, anything in the ballpark of these two forecasts suggests a "lull" from about now through Nov 7. It's a very high lull, but people find these dates useful for risk-based planning.

PMC COVID-19 Forecasting Model, Sep 30, 2024
🧵 3/5
The United States is coming down from a 9th Covid wave and will soon transition into a 10th.
We are still #DuringCOVID.
The peak will likely be around New Year's Eve, though some models suggest slightly later.
A 3-month forecast is extremely volatile. I mention it now because people are already making travel plans.
Hospitals should formalize their plans for requiring universal masking if they have not already done so. Many have missed the mark during the ongoing summer/fall wave due to reliance an outdated zeitgeist of "respiratory virus season" that treats cold, flu, and Covid at interchangeably equal. Covid peaks twice annually and is more disabling long-term. Nonetheless, even hospitals relying on outdated models will be more likely to take the forthcoming wave more seriously.
As we have published, universal masking during Covid waves is a key indicator of healthcare quality. Yes, this is true based on 2024 data. Unfortunately, it's mostly only the very best-of-the-best health centers. Consider printing and mailing this article to places where you receive care.
jamanetwork.com/journals/jaman…

PMC COVID-19 Forecasting Model, Sep 30, 2024
🧵 4/5
Please share. There's 2 months to get an app in.
Top two questions:
🔹Hybrid? Yes. Remote as much as humanly possible. In-person for several classes and patient work.
🔹Cost? Nearly free, like most PhDs in the U.S. Tuition (about $50k/yr) is covered, assistantship stipend competitive nationally. Close mentorship.

PMC COVID-19 Forecasting Model, Sep 30, 2024
🧵 5/5
The full dashboard shows about 1 in 71 people in the U.S. are actively infectious with Covid.
Read the full report online:
We accept no advertising or social media revenue. Use freely. 🙏pmc19.com/data
🧵 5/5
The full dashboard shows about 1 in 71 people in the U.S. are actively infectious with Covid.
Read the full report online:
We accept no advertising or social media revenue. Use freely. 🙏pmc19.com/data
• • •
Missing some Tweet in this thread? You can try to
force a refresh


