
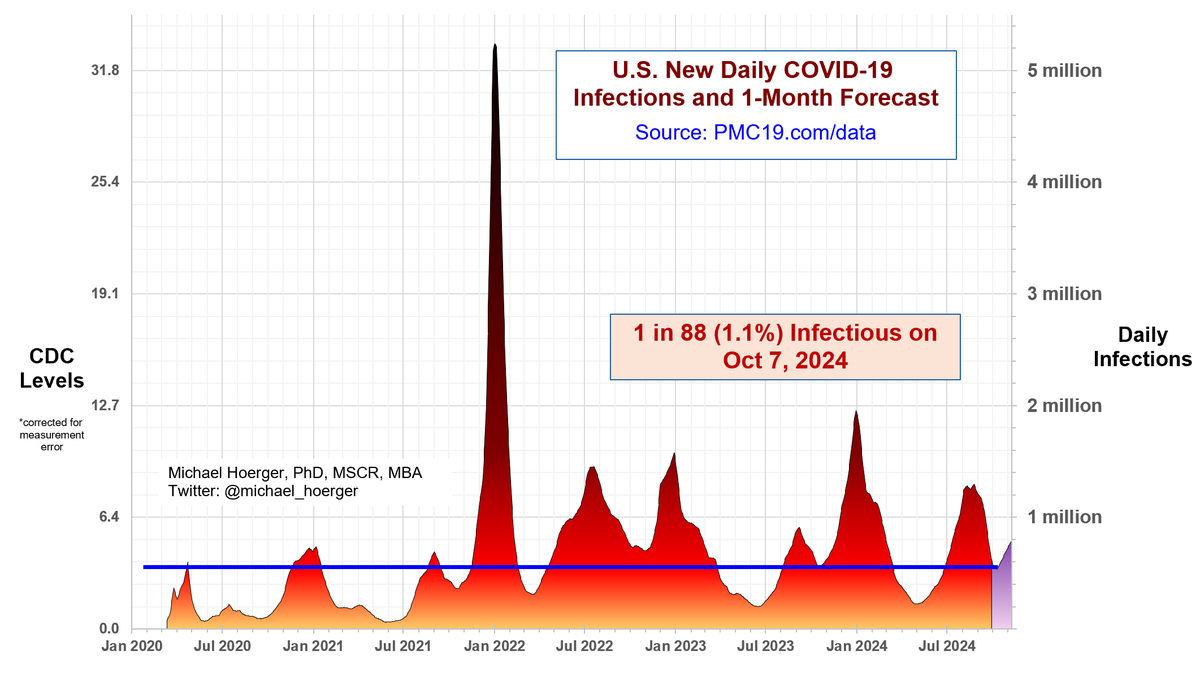
Note that in the U.S. our current "lull" in transmission has an estimated average daily infection rate similar to the first 3 waves of the pandemic.
#CovidIsNotOver
Our case estimation model combines historical data from the current CDC contractor (Verily), former CDC contractor (Biobot), and multi-faceted case estimation model of the IHME to estimate transmission levels.
Across these three data sets, the intercorrelations range from r=.93 to .96. A correlation of r=1.00 is the maximum possible (perfect), so these correlations are remarkable given the differences in methodology (Verily/Biobot vs IHME) and regional coverage and processes (Verily vs Biobot). It's wise scientists doing fundamental work reaching the standards of excellence.
Many correlations in the diagnostic testing literature, for example, are considerably lower, often in the range of r=.40 to .60, so wastewater scientists and other modelers are really doing tremendous work.
utoledo.edu/al/psychology/…
Working with 3 data sets to develop a composite indicator of transmission also allows us to convert between one metric and another. On the left side of the graph, you'll see what we get if we convert the composite to the metric used on the CDC website. One the right, you'll find the more meaningful metric of the IHME-base estimate of daily infections.
These models are based on hundreds of hours of work by our team as well as the teams contributing the underlying data. You can read more about the reports on our website, where you'll find hundreds of pages of reports over the past 14 months:
pmc19.com/data
The specifics of the model have varied marginally over time, and we also keep a running methodologic appendix:
pmc19.com/data/PMC_COVID…
You can also read my bio, which includes advanced degrees in behavioral science, medical research, and analytic modeling:
pmc19.com/data/Hoerger_b…
The model has been cited in peer-reviewed medical journals as well as by many news outlets:
•JAMA Oncology: jamanetwork.com/journals/jamao…
• BMC Public Health: bmcpublichealth.biomedcentral.com/articles/10.11…
• TODAY: today.com/health/news/co…
• Forbes: forbes.com/sites/judyston…
• Salon: salon.com/2023/10/19/a-l…
• The New Republic: newrepublic.com/article/177849…
• Yahoo! News: news.yahoo.com/us-sees-larges…
• Washington Post: washingtonpost.com/health/2024/01…
• Time: time.com/6554340/covid-…
• Stateline: stateline.org/2024/01/23/was…
• PRISM: prismreports.org/2024/01/29/cov…
• SELF Magazine: self.com/story/cdc-new-…
• TODAY: today.com/health/coronav…
• Institute for New Economic Thinking: ineteconomics.org/perspectives/b… • TODAY: today.com/health/coronav…
• NEWSMAX: newsmax.com/health/health-…
• Yahoo! News: uk.news.yahoo.com/lifestyle/covi…
• People: people.com/massive-covid-…
• Truthout: truthout.org/articles/the-u…
• San Francisco Chronicle: sfchronicle.com/health/article…
• JAMA-NO: jamanetwork.com/journals/jaman…
• MSN: msn.com/en-gb/health/o…
• PRISM: prismreports.org/2024/08/06/cov…
• CBS: wwltv.com/article/news/h…
• NBC: wdsu.com/article/new-or…
• FOX: x.com/michael_hoerge…
• OBR Oncology: oncologynewscentral.com/article/contro…
• • •
Missing some Tweet in this thread? You can try to
force a refresh


