Sam Scarpino Profile picture
Oct 15 9 tweets 4 min read Read on X
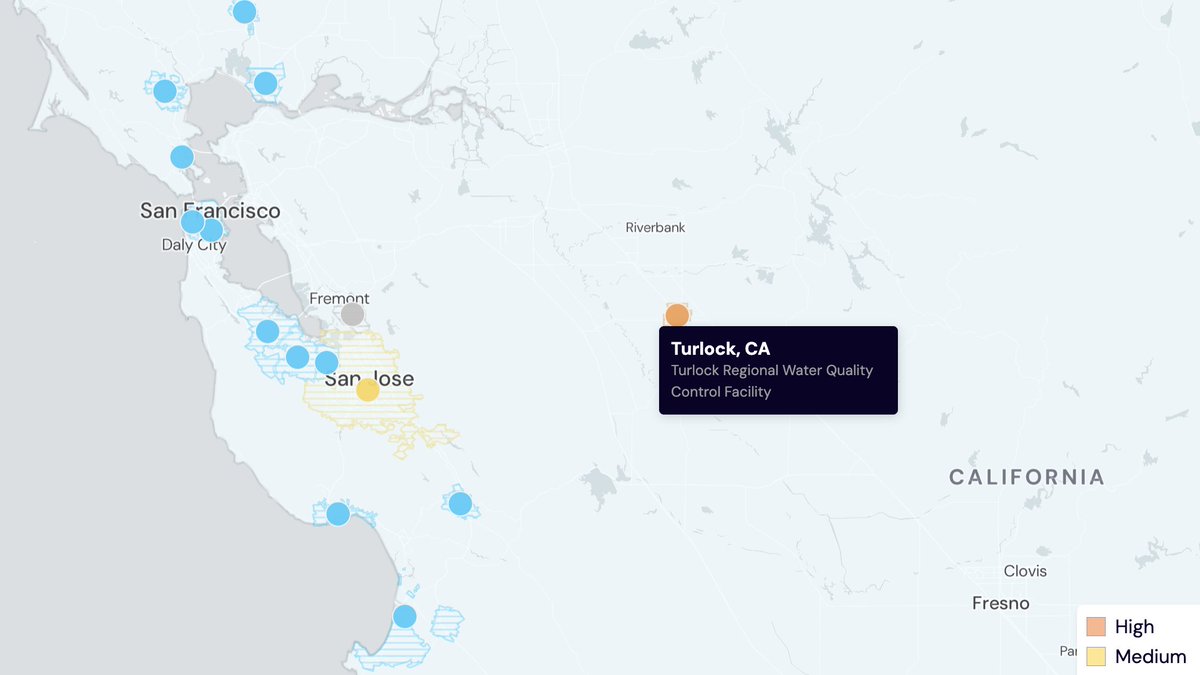
1/ We're seeing a concerning rise in H5 wastewater positivity in Turlock CA.

Unlike previous H5 signals, @WastewaterSCAN is showing an exponential rise in H5 (and flu A) concentration that has persisted for almost a month! Figure shows an exponential rise in flu A concentration in wastewater over the past month. The inset shows H5 positive samples. Data from WastewaterSCAN. Location is Trulock CA.
2/ For those following #H5N1 in CA, there have been positive farms there since late Aug.

@globaldothealth we're working w/ @ThinkGlobalHlth and @CFR_org to maintain a timeline of key events. This tracking allows us to better piece together signals. thinkglobalhealth.org/article/timeli…Timeline showing the first announced positive farms in CA on Aug 30th.
3/ I'm concerned about the H5 wastewater signal because it lags far behind the uptick in farms and is better correlated with the rapid rise in human infections. thinkglobalhealth.org/article/timeli…Timeline shows the rise in reported H5N1 human infections beginning in late Sept/early Oct.
4/ Looking regionally at flu A and H5 in the wastewater, there's also a signal in San Jose. However, what we're seeing is largely contained to Turlock, which means there is time to act. Data from @WastewaterSCAN Map showing high flu A wastewater in Turlock CA and medium in San Jose with low in other sites. Data from WastewaterSCAN.
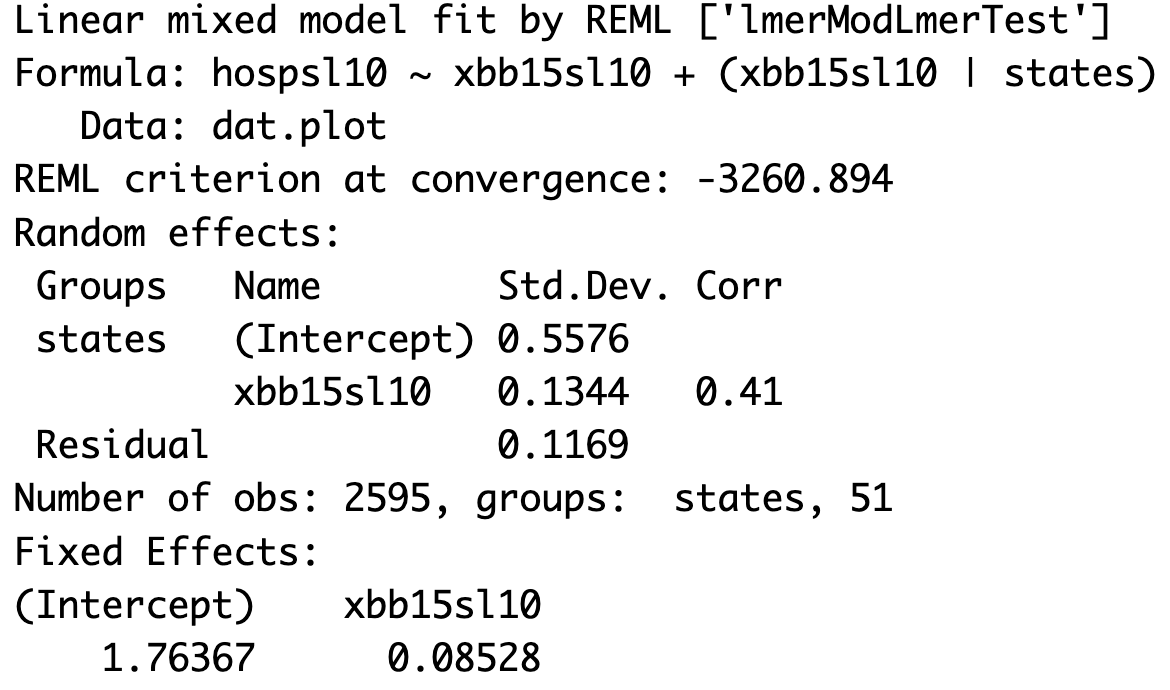
5/ We urgently need sequence data from the wastewater to confirm it's of human origin and modeling to translate concentrations into estimation of case burden.

You can find the @WastewaterSCAN here: data.wastewaterscan.org/tracker?charts…
6/ I want to stress that these data don't mean human-to-human transmission is happening. We also don't know whether milk byproducts are being dumped in municipal wastewater, as has been seen in Texas.

But, this is *exactly* the kind of early warning signal we must act on!
7/ It's worth noting that the City of Turlock Regional Water Quality Control Facility states, "Nearly half of the flow comes from food processing and dairy industries."

cityofturlock.org/aboutturlock/h…
8/ We know milk processors dumping byproducts into municipal has contributed to H5 signals in Texas, so it's worth taking that hypothesis very seriously in Turlock.

However, in Texas, we saw a *much* more rapid rise (like a step function) to concentrations 5x what we see in CA. Time series of influenza A in two sites in Amarillo. We see rapid spikes in both sites that are about 5x higher than current levels in Turlock CA (indicated with a horizontal line).
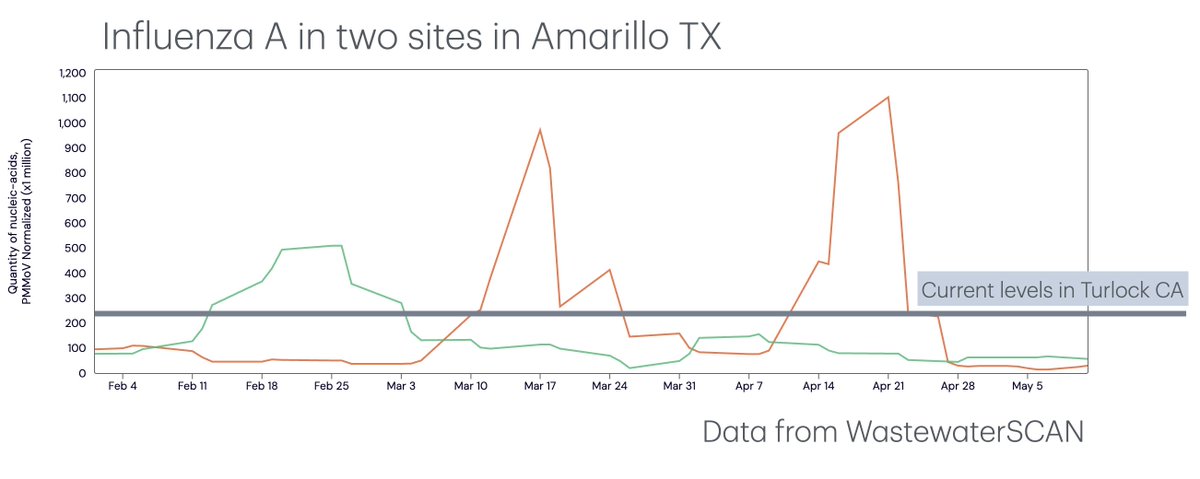
9/ Note that @WastewaterSCAN wasn't testing for H5 back in early 2024, but we can see from their publication that this influenza A signal was almost certainly H5. pubs.acs.org/doi/10.1021/ac…

• • •

Missing some Tweet in this thread? You can try to force a refresh
 

Keep Current with Sam Scarpino

Sam Scarpino Profile picture

Stay in touch and get notified when new unrolls are available from this author!

Read all threads

This Thread may be Removed Anytime!

PDF

Twitter may remove this content at anytime! Save it as PDF for later use!

Try unrolling a thread yourself!

how to unroll video
  1. Follow @ThreadReaderApp to mention us!

  2. From a Twitter thread mention us with a keyword "unroll"
@threadreaderapp unroll

Practice here first or read more on our help page!

More from @svscarpino

May 6
1/ New #H5N1 pre-print ⬆️ the threat level for the ongoing outbreak in dairy cows.

Researchers found that cow mammary glands contain the same kind of mixed flu receptors seen in pigs.

This mix of receptors is why scientists call pigs "evolutionary labs for flu host switching". Graphical abstract showing the three cell surface receptors used by influenza in humans, chickens, and ducks. The figure then shows where sampling occurred in cows (brains, trachea, mammary glands), and the distribution of cell receptors in the various organs.
2/ One of the key changes required for avian flu to transmit effectively in humans involves flu's hemagglutinin (HA) host cell receptor preference.

tl;dr The cell surface receptor influenza uses in birds is subtly different from the one in the human upper-respiratory tract. Cartoon from Chauhan & Gordon illustrates influenza's replication cycle. A red arrow indicates where the HA glycoprotein is binding to the host cell receptor triggering uptake into the host cell.
3/ While changes in HA binding are only one of many required, they are thought to be key in governing influenza host range.

journals.asm.org/doi/full/10.11…
Read 13 tweets
Apr 24
1/ I've seen many comments along the lines of, "We have no evidence that pasteurization inactivates #H5N1."

We actually have quite a bit of evidence to suggest pasteurization will work and the presence of viral RNA is compatible w/ that evidence.

Why am I not panicked? A🧵
2/ Milk is pasteurized by heating it briefly to ~72 C (161F). This inactivates pathogens, but does filter the milk. As a result, there can be degraded genomic material from pathogens following pasteurization. PCR, as was done by the FDA, can detect these degraded genomes.
3/ Numerous peer-reviewed studies have found that pasteurization will inactivate influenza A virus, including #H5N1. ncbi.nlm.nih.gov/pmc/articles/P…
Read 6 tweets
Apr 1
1/ A human case of #H5N1 was just reported and is linked to the ongoing outbreak in US dairy cattle.

How concerned should we be?

It's good news that the patient is experiencing eye symptoms and had direct exposure to infected cattle.

Why? 🧵
2/ As you may know, avian influenza doesn't readily infect humans (and doesn't transmit well from human-to-human) in part because of subtle differences in key cell surface receptors. journals.asm.org/doi/full/10.11…
3/ However, our eyes actually contain the bird-flu-friendly confirmation of the cell surface receptor. This is why eye inflammation is often a symptom of avian influenza infection in humans. thelancet.com/journals/lanin…
Read 10 tweets
May 17, 2023
1/ What's the global state of wastewater surveillance?

On behalf of authors from >20 countries & all continents, A Keshaviah, @megan_b_diamond, M Wade, & me survey capacity & what's needed going forward. @RockefellerFdn @MathematicaNow @NUBouve @LancetGH thelancet.com/journals/langl…
2/ Following a convening of @RockefellerFdn's Global Wastewater Action Group, we partnered w/ @MathematicaNow and surveyed representatives of wastewater monitoring programs in 43 countries (16 LMICs, 27 HICs) spanning six continents (when I said "all" I didn't count Antartica). Figure: Population coverage...
3/ In high-income countries, composite sampling at centralized treatment plants was most common, whereas grab sampling from surface waters, open drains, and pit latrines was more typical in low-income and middle-income countries.
Read 9 tweets
Jan 31, 2023
1/ Data from @WastewaterSCAN shows that rates of SARS-CoV-2, RSV, and influenza have dropped precipitously from their winter peaks!

We still have a ways to go, but things are clearly headed in the right direction. US national wastewater surveillance data from the wastewater
2/ Although for SARS-CoV-2 we've been hovering at peak levels for over a month and we need to see at least another month of continuously falling prevalence before we're back to more "baseline" levels. US national wastewater surveillance data from the wastewater
3/ And note how *LONG* the RSV outbreak has been in the US.

We've been above 25% of the peak height for >3 months! US national wastewater surveillance data from the wastewater
Read 4 tweets
Jan 6, 2023
1/ For those concerned about #XBB15 and hospitalizations, I think the evidence is more mixed than many are admitting.

While it's true hospitalizations are up in states like MA where XBB.1.5 is common, they are up across the entire US, even in states w/ little-to-no #XBB15! Data from NY Times shows that hospitalizations are up 14% ac
2/ If we plot daily XBB.1.5 prevalence at the state-level vs new adult hospitalizations for #COVID19, you can see there are some states (each color is a state) with weakly positive relationships, but this the signal isn't very strong. Figures shows a scatter plot of XBB.1.5 prevalence on a log-
3/ If we analyze these data using a mixed-effects regression model (with state as a random effect) there is a very weak, positive relationship, but XBB.1.5 only explains about 2% of the variability in hospitalizations on a log-scale! Figure shows the output of a mixed-effect regression analysi
Read 11 tweets

Did Thread Reader help you today?

Support us! We are indie developers!


This site is made by just two indie developers on a laptop doing marketing, support and development! Read more about the story.

Become a Premium Member ($3/month or $30/year) and get exclusive features!

Become Premium

Don't want to be a Premium member but still want to support us?

Make a small donation by buying us coffee ($5) or help with server cost ($10)

Donate via Paypal

Or Donate anonymously using crypto!

Ethereum

0xfe58350B80634f60Fa6Dc149a72b4DFbc17D341E copy

Bitcoin

3ATGMxNzCUFzxpMCHL5sWSt4DVtS8UqXpi copy

Thank you for your support!

Follow Us!

:(