42-1/ COVID update for epidemiological weeks 41-42 of 2024.
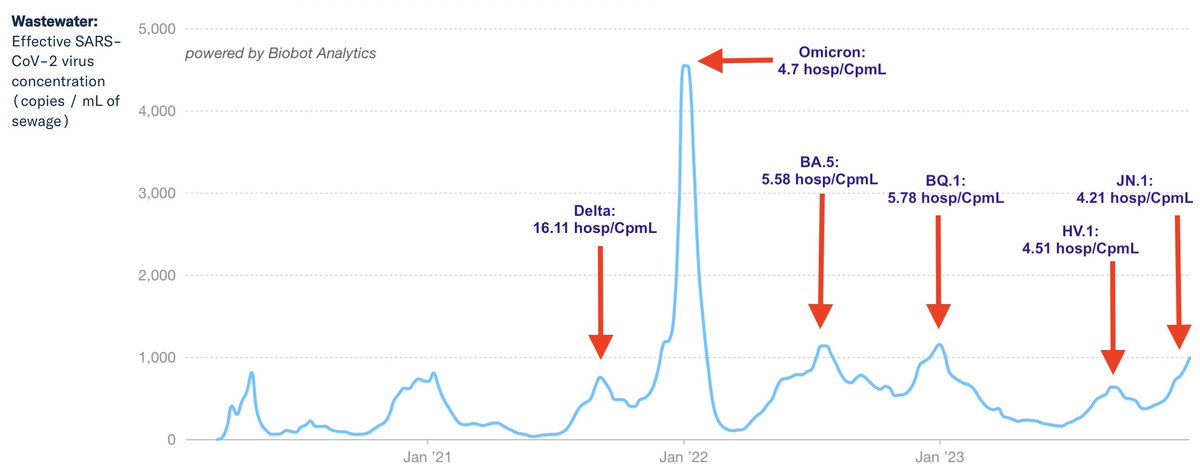
COVID is down down down—at least in the US. And my bad, Biobot hasn't switched to a monthly report. They still seem to be reporting weekly. My neuro-atypical mind missed the dropdown report menu button.
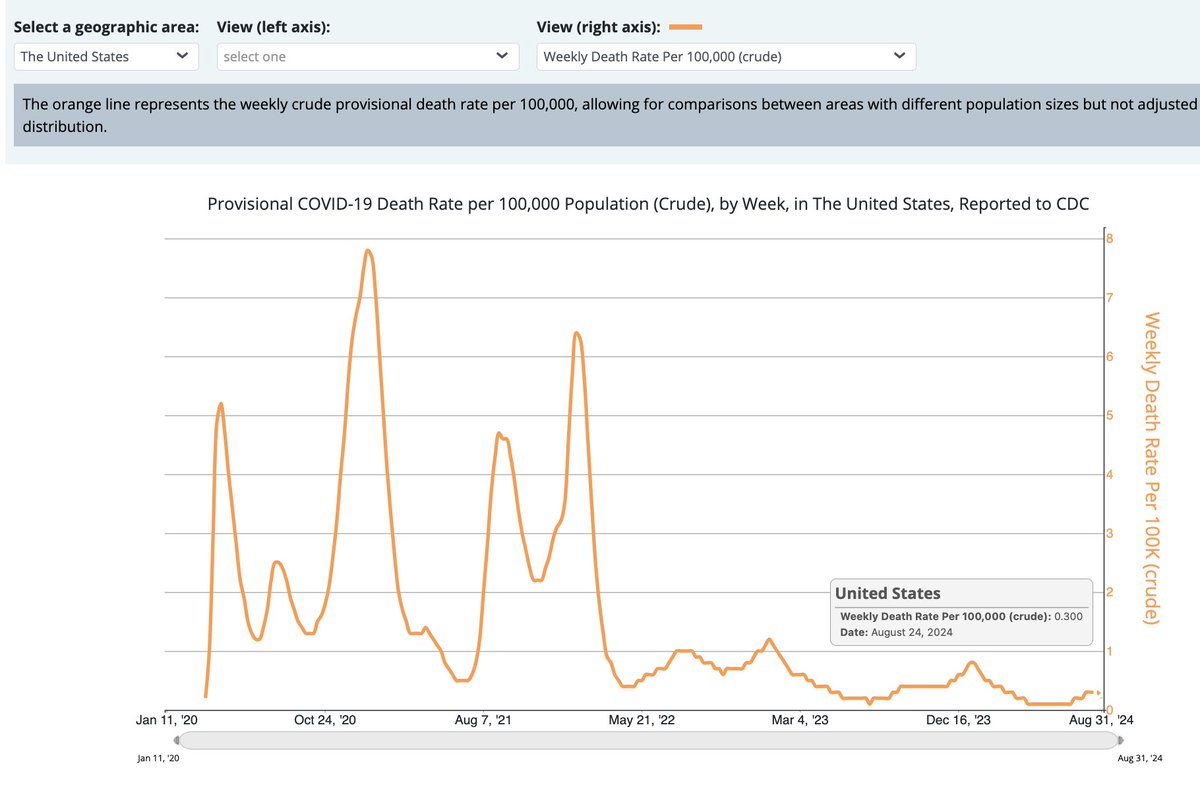
42-2/ COVID ED visits are following the downward wastewater trend. Although there may be delays in tabulation, weekly deaths (per 100k) may clock in at the lowest any time since the start of the pandemic. Hospitalizations dropping, too.
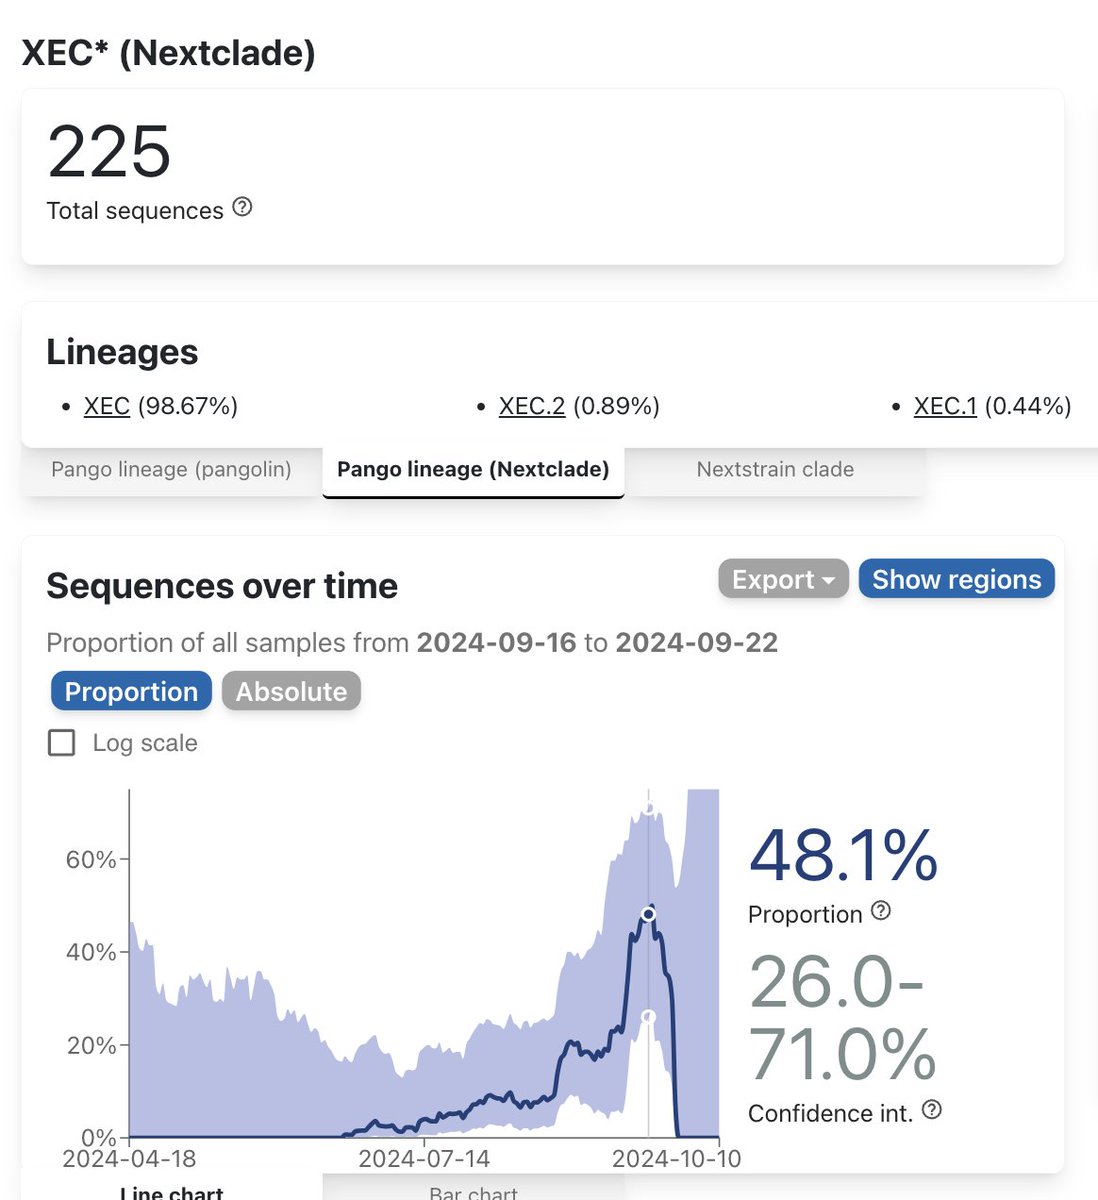
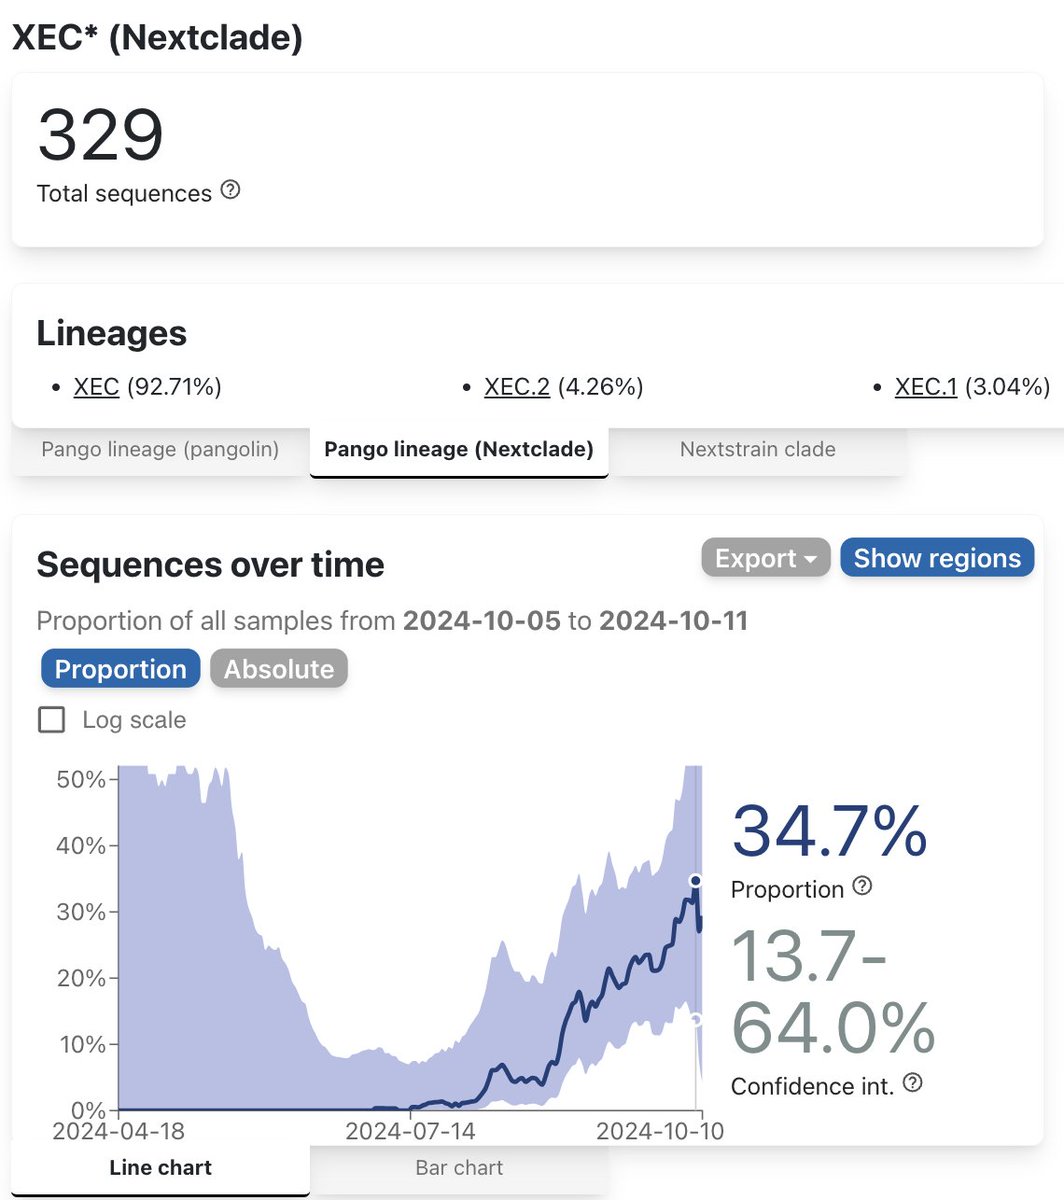
42-3/ Lots of scary stories in the MSM that XEC will bring on the next COVID wave RSN (Real Soon Now). Its frequency is growing, but so far it hasn't stopped the downward trend in cases (at least in the US). Its frequency *is* growing fast, though.
42-4/ While US numbers are dropping, some countries are on the rise—Germany, for instance. And the Netherlands. Driven partially by XEC...
42-5/ XEC is close to 50% in Germany a few weeks ago. And ~35% in the Netherlands. Notice that they're not coming off a wave like we are. I'm guessing that the current 3 XEC.x variants will not kick off the next wave in the US. Maybe their descendants will, though.
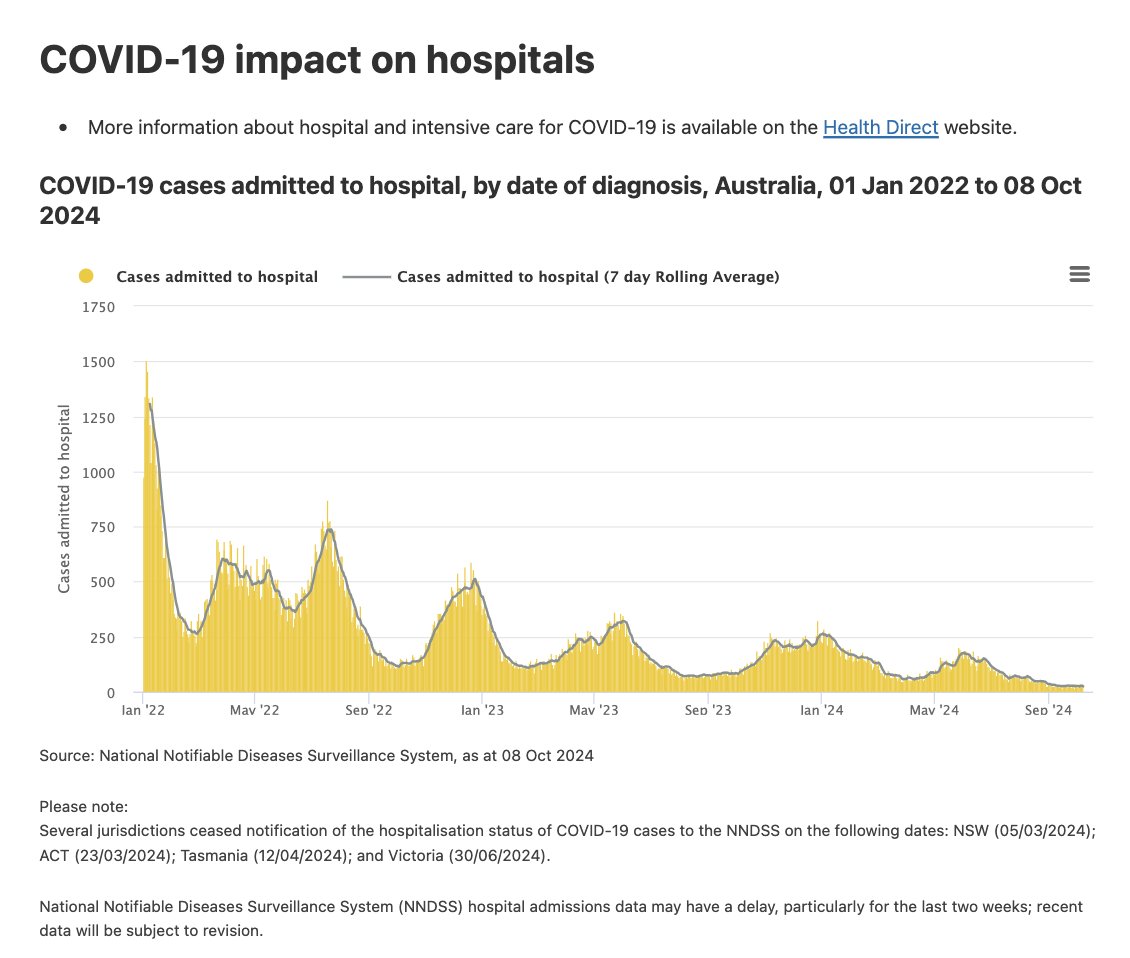
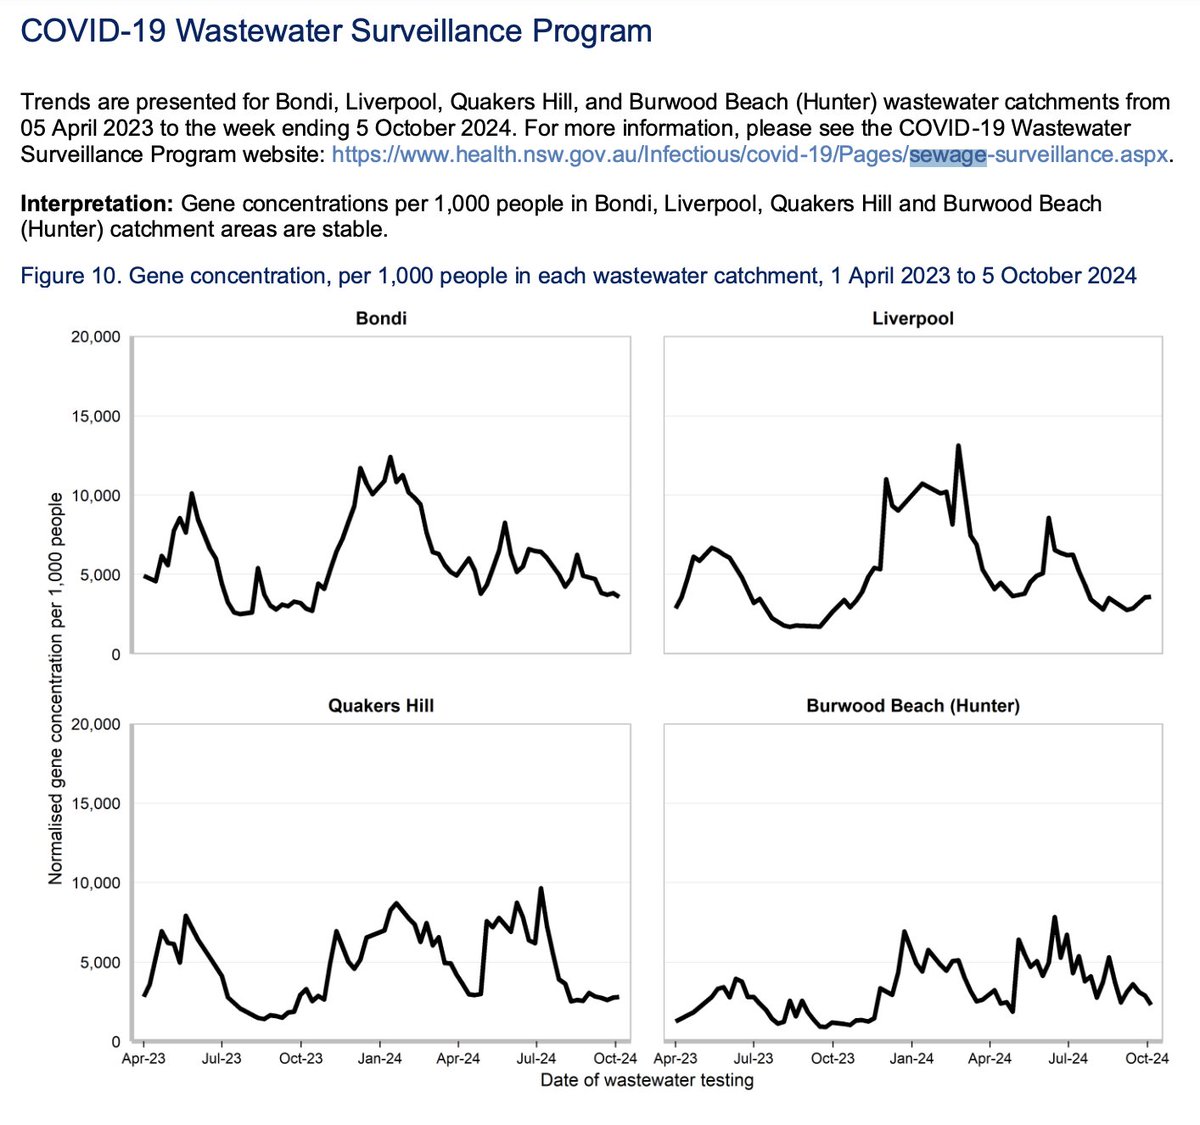
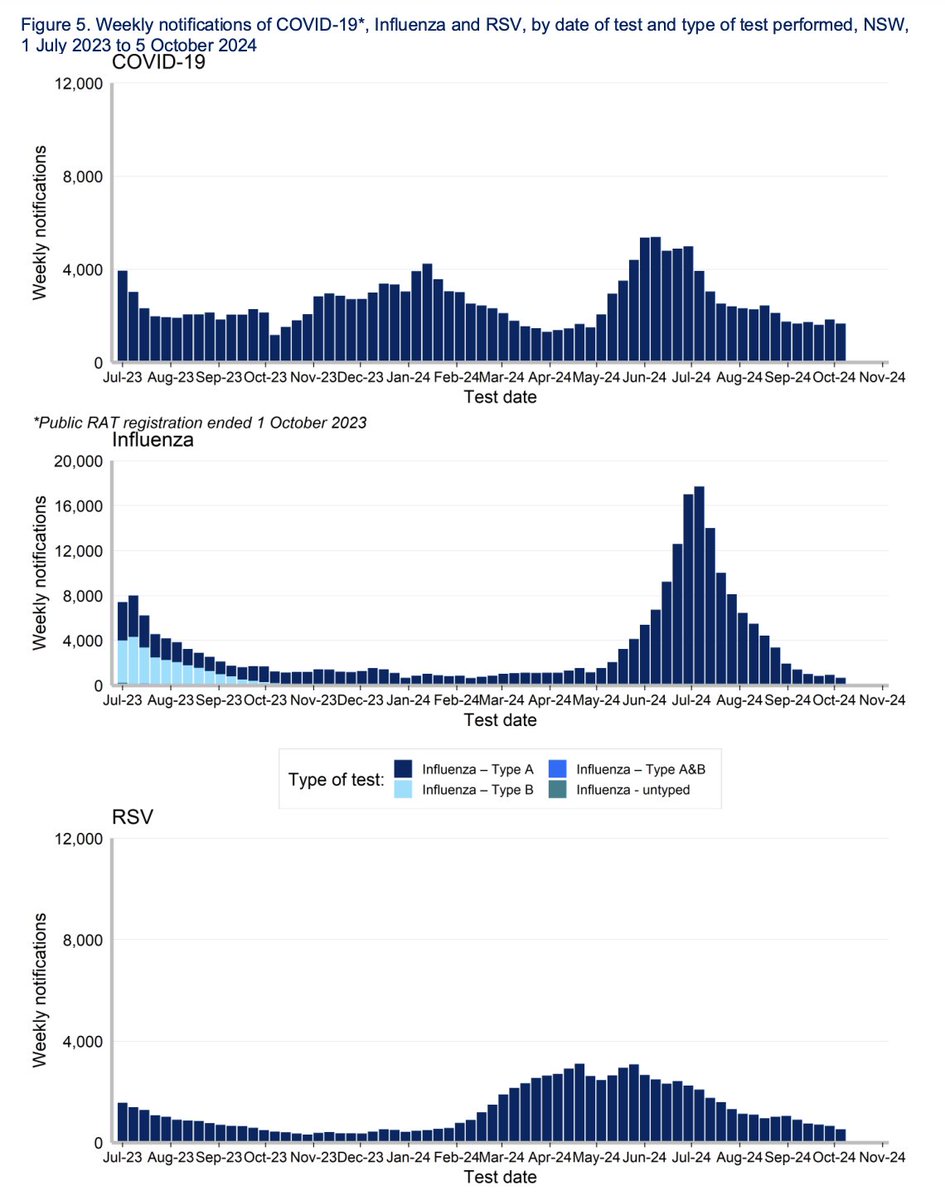
42-6/ OTOH, down under in Australia, their COVID hospitalizations are lower than ever. Not much wastewater testing happening in AUS, but in the greater Sydney area, WW numbers remain relatively low. NSW respiratory notifications show same pattern for COVID.
42-7/ As for other respiratory viruses in the US, I'll start with hCoVs because a reader asked: "Will SARS-CoV-2 become as common as OC43?" If we look at Biofire's (proprietary) Syndromic Trends, SARS2 has always been the big kahuna of coronaviruses. OC43 on the rise though…
42-8/ The big question is whether SARS2 will become as harmless as hCOV cold viruses. @arijitchakrav thinks it won't. I was going to link to his thread where he argues it won't, but he blocked me for calm mongering. But I'd say if current trends continue, it will eventually.
42-9/ Flu season seems to be delayed in the US. But the flat line in the WHO positivity numbers is weird. However, Biofire shows that the incidence of flu viruses is still very low—but is that the start of a slight uptick in A H3 influenzas?
42-10/ And since I'm on Biofire, Rhinoviruses seem to have peaked. Hmmm. But if the (loose) inverse correlation between RVs and SARS2 holds, we might see an uptick in SARS2 sooner than later.
And RSV rates are starting to rise...
42-11/ That's all for this update. I've got a few interesting papers that I need to read in the hopper (including a big masking metastudy). I'll report back on them in my Epi Week 44 update. Oh, and get your COVID booster! And your flu shot, too (if you haven't already done so).
@threadreaderapp unroll
• • •
Missing some Tweet in this thread? You can try to
force a refresh
40-1/ COVID update for epidemiological weeks 37-40 of 2024. Note: I skipped my last biweekly update for personal reasons. This will summarize the past month of COVID activity—plus some updates on H5N1 and some other pathogens of concern.
So, back to the COVID data mines...
40-2/ The KP.3.x wave is receding. Biobot released their update for September (I guess they're only publishing monthly updates now). Their data indicates that the SARS2 wastewater activity is still high but falling. However...
40-3/ ...if we look at the three largest cities in the US (NY, LA, and Chicago), the viral CpmL concentrations are almost back to usual interwave levels. O/c Biobot utilizes sewersheds from all over the US, and we've seen that COVID waves don't peak synchronously across counties.
36-1/ COVID update for epidemiological weeks 35-36 of 2024.
Biobot hasn't released a new report in 4 wks. I'll use the CDC wastewater chart even though I think it runs "hot" compared to Biobot. With the exception of the Midwest the KP wave peaked the 1st or 2nd week of Aug.
36-2/ ED visits seem to have peaked as well—although the 5-17 age cohort is lagging other age groups—probably due to the opening of schools across the US. But crude death rate rose to .3/100K the 3rd week of August. They may be dropping now (or not yet).
36-3/ Age-adjusted deaths look a little better at .2/100K, but IMHO a death is a death. When referring to US death rates, from here on out I will only use the crude death rate. Age-adjustment is useful for comparing how we do against other countries w/ different demographics.
34-1/ COVID update for epidemiological weeks 33-34 of 2024.
Were the Paris Olympics a superspreader event? Lots of claims that it was—but I can't find any data to support this. As of week 33 France's Sentinelles network shows Paris region's cases falling for last 8 weeks.
34-2/ O/c, Sentinelle tracks aggregated ARI numbers—COVID isn't broken out of the stats—but if COVID cases had increased due to the Olympics, they weren't high enough to impact the overall ARI numbers. Worth noting that the summer KP.x wave seems to have minimally affected FR.
34-3/ And was the DNC in Chicago a superspreader event? Several DNC attendees tweeted pics of positive COVID tests and they set off a meme stampede that the DNC was a superspreader event. I'm still waiting for the Chicago wastewater numbers from last week. But...
32-1/ COVID update for epidemiological weeks 31-32 of 2024.
Both Biobot and CDC wastewater numbers indicate the current wave is still on the rise, but looking at some cities it seems to have passed its peak (next slide)...
32-2/ For instance, NYC's (Manhattan's) wave started late, showed a sharp upward trend, and now it's dropping off quickly. Boston's wave started earlier, and was less pronounced, but it's dropping off...
32-3/ LA's wastewater numbers seem to be rising still, but SF and San Jose (Santa Clara Co) seem to be on the downhill side of this wave. And the current wave seems to have mostly bypassed Oakland and Berkeley. Go figure. Or maybe it hasn't hit them yet?
30-1/ COVID update for epidemiological weeks 29-30 of 2024.
COVID wastewater numbers are still rising at a steady rate. CDC's wastewater chart shows more significant rise than Biobot, but (as I said before) I don't really trust the CDC's methodology and lack of transparency.
30-2/ The current wave is manifesting itself unevenly across different sewersheds. For instance, San Jose shows the current wave as big as the last one, but 40 miles up the road, Oakland doesn't show much of wave at all...
30-3/ NYC (Manhattan) has seen a strong surge in the past 4 weeks. While up in Boston, things may have peaked.
51-1/ Summary of COVID trends as of epidemiological weeks 50 & 51.
Wastewater numbers continue to rise. Biobot and CDC agree (but I suspect they're using the same sewersheds for their data). OTOH, before we freak out, we should zoom out...
51-2/ This wave is shaping up to surpass, the BQ.1 wave at the end of last year. But despite JN.1's immune evasiveness (at least in vitro) and ACE2 binding scores (at least in vitro) which are lightyears beyond Omicron, it's not another Omicron. Zooming out...
52-3/ But the wastewater levels are higher than the ww levels during the Delta wave of 2021! However, if we take the CDC hospitalization rates divided by CpmL concentrations for each peak, we see that the current wave (as of 2 wks ago) is ~1/4 as virulent as Delta. Go T cells!