Emil Kirkegaard Profile picture
Oct 26, 2024 10 tweets 5 min read Read on X
On average, it takes about 90% of Americans to agree on some policy for it to have 50% chance to get enacted. Image
Economic elites get their way a bit more often. Graphically, it is underwhelming. Image
But this comparison is misleading. Why? People in the 10th 50th 90th centile usually agree, so their opinions are highly correlated. To detect their individual effects, one must regress them together. It looks like this. Holding elite opinion constant, opinions of 10th and 50th centile simply don't matter.Image
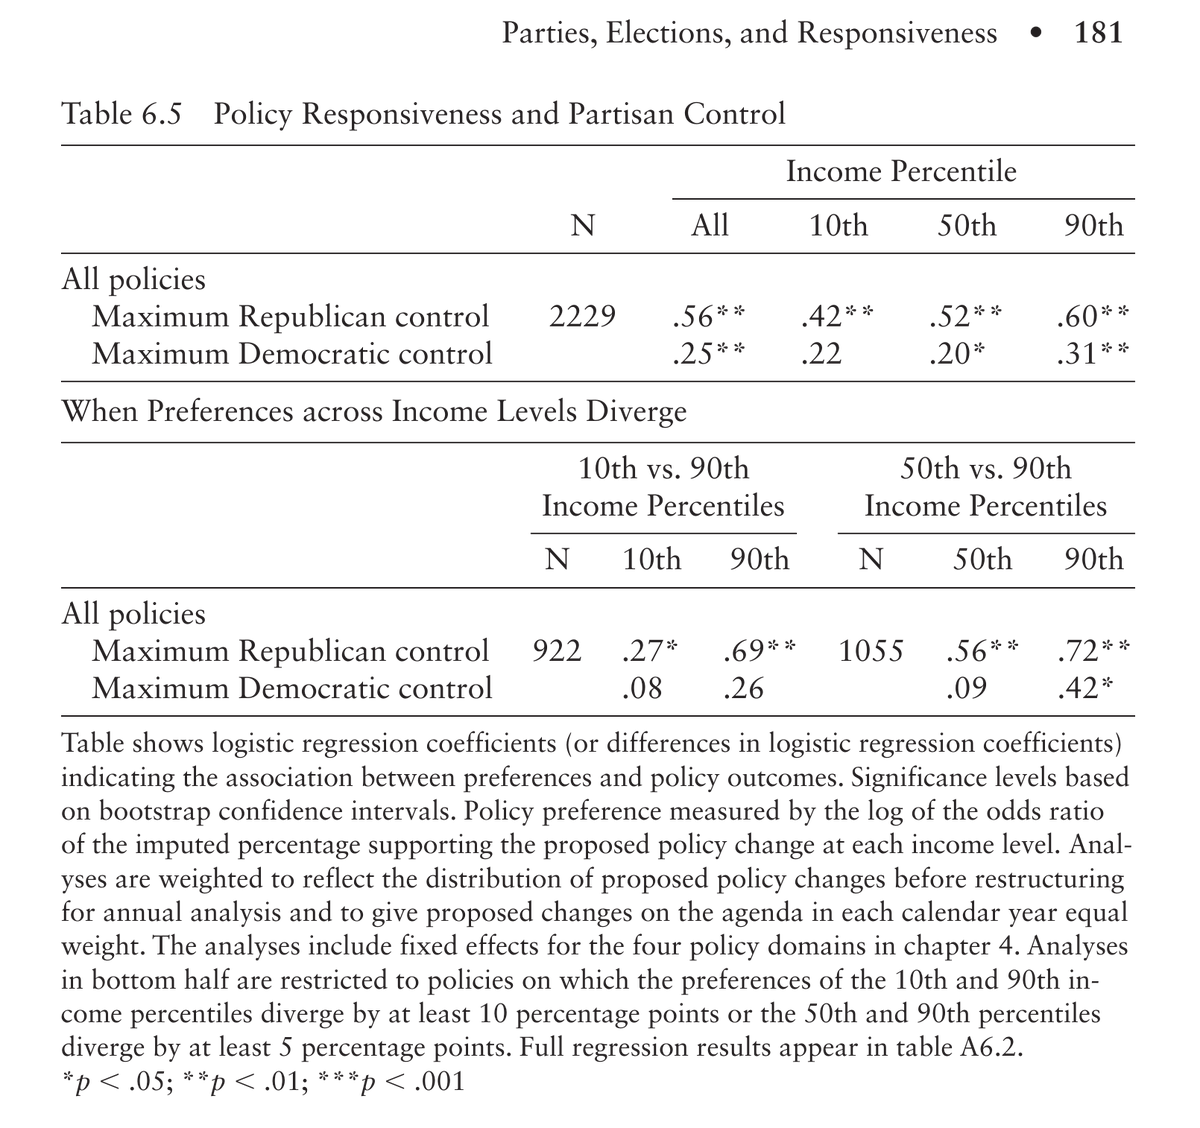
It looks about the same if we look at more granular divisions. The higher your income, the more your opinion matters to the government. Essentially, it's democracy in spirit, but when income classes disagree, elites almost always win with regards to policy.

These kinds of results suggest that for conservatives to win, they must win over elites. Trump is an elite, Thiel is an elite, Musk the elitest, Bezos Zuckerberg to follow?Image
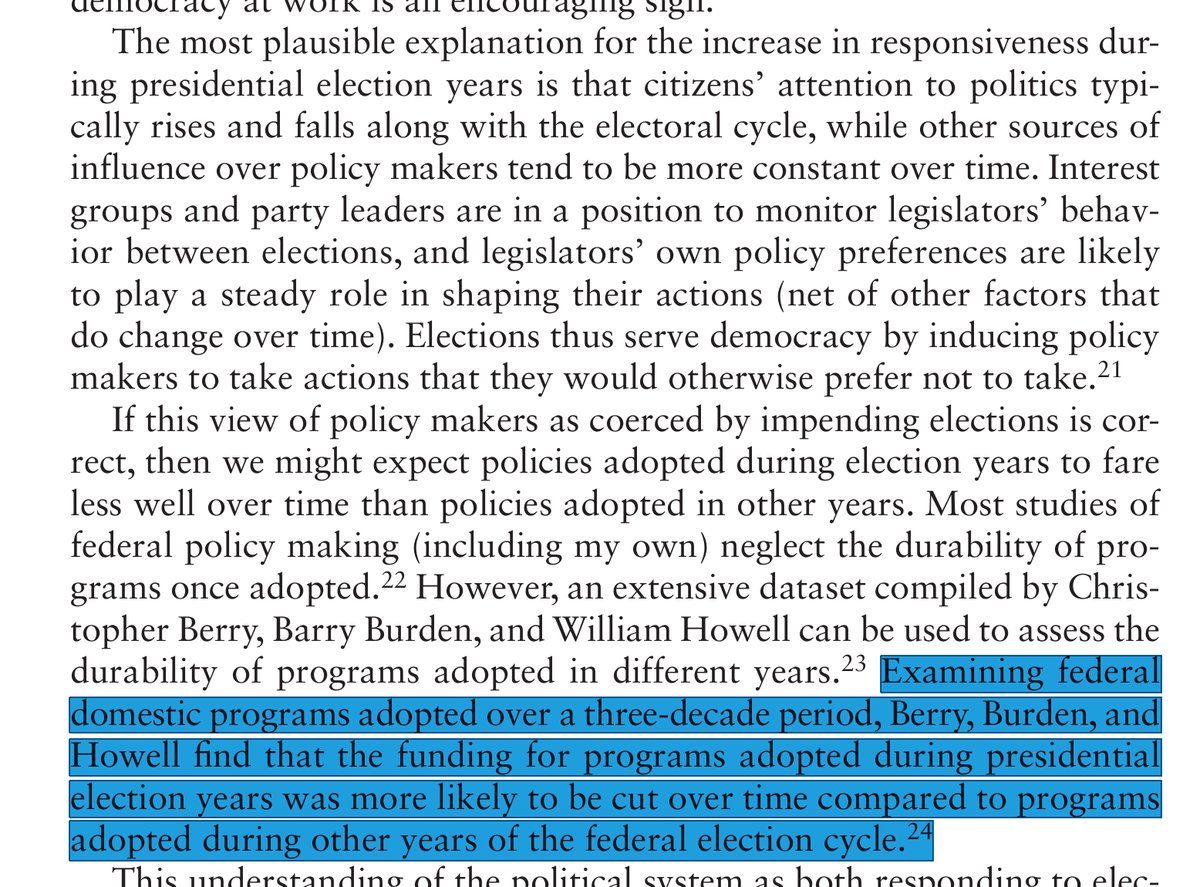
Politicians implement policies more in line with the public's preference during election years when they need the support. Makes sense.

However, they then repeal these policies later on. Image
Image
Image
It appears the Republicans are more democratic in that their policies are more aligned with the public. Image
Image
Democratic party identification appears to be mainly about pandering to some social group, Republican party identification is more about politics.

This finding is not surprising given current 'identity politics' events. Image
Did better survey data make politicians more likely to implement popular policies? It seems the answer is yes, but looking in details, it seems the result is just that G W Bush was unusually democratic. Even the 50th centile income has influence on policies on his watch. Image
Image
Image
Image
Another way to look at this is to think of parties or administrations as maximizing their own goals. When they only have a narrow power edge in congress, they need more support. When they have a solid majority, they don't have to care. In fact, it appears that way too. Image
It's curious how in modern history, the civil rights movement and legislation is viewed as a great win. However, it was actually implemented against the public and even the affluent's will. Johnson admin. could do this because they had a solid majority, and didn't care about the public.Image

• • •

Missing some Tweet in this thread? You can try to force a refresh
 

Keep Current with Emil Kirkegaard

Emil Kirkegaard Profile picture

Stay in touch and get notified when new unrolls are available from this author!

Read all threads

This Thread may be Removed Anytime!

PDF

Twitter may remove this content at anytime! Save it as PDF for later use!

Try unrolling a thread yourself!

how to unroll video
  1. Follow @ThreadReaderApp to mention us!

  2. From a Twitter thread mention us with a keyword "unroll"
@threadreaderapp unroll

Practice here first or read more on our help page!

More from @KirkegaardEmil

May 7
% of population that identifies as White is pretty decent predictor for how well things are going in Brazilian municipalities and their IQ. Image
Image
Race proportions by municipality Image
Image
Image
Image
Maps of socioeconomic status and IQ Image
Image
Image
Read 7 tweets
May 5
Using public data on first names, one can figure out how fast the population replacement is happening in France despite the ban on informative statistics. Selected results. Image
As elsewhere, the foreign born are clustered in cities. Image
Foreign born is a decent proxy for where the Muslims and Africans are having children. Image
Read 10 tweets
Apr 27
In economics of economic growth, it is often seen that countries have catch-up growth, called the advantage of backwardness. We can see this in OECD using GDPpcppp numbers. Image
However, looking at the world at large for the same period (2000-present), the picture is not so clear. R2 dropped from 52% to 9%. Looking at the plot, most of the dots that didn't grow as expected are Africans. It's another example of OECD fallacy, one can get substantially wrong ideas about how the world works by only looking at a subset of mostly European, above average countries.Image
We can see the role of national intelligence here. A simple way is just splitting the data into some groups. Higher IQ countries show much stronger convergence, and the low IQ countries grow quite slowly. This is essentially the story of how Asian tigers had strong economic growth starting poor, including China.Image
Read 4 tweets
Apr 27
Who does hate speech law protect? Well, in Denmark the prosecutor's office has an overview, a summary of every case since 2001 or so. The targets of the utterances that led to guilty verdicts are shown below.

Thus, only 1 case of 142 protected Danes, and it was kinda incidental because the guy was insulting Danes and Jews combined, apparently because he was angry about Gaza getting rekt by Israel.

I expect results would be similar for other western countries. These laws are pernicious, only protect minorities, despite ostensibly being neutrally formulated. You can basically smear Danes in Denmark as much as you want as long as you don't do it because they are gay.Image
Case summaries. Many of them are quite funny.

vidensbasen.anklagemyndigheden.dk/h/6dfa19d8-18c…
The above counts done by AI, but I did it by hand as well and my results were materially the same.
Read 5 tweets
Mar 30
Our new meta-analysis of American race gaps in IQ/intelligence is out! The main results didn't change that much, with 2 exceptions: Image
First, there appears to be reverse publication bias for Black IQs, smaller studies find _larger_ values. This is a prediction from leftism bias model, since social scientists hack in the preferred direction, which is usually positive, but sometimes negative. Adjusting for this gives a Black IQ estimate 82 instead of 85.Image
Image
The formal meta-analysis models did not find any changes over time, but if one looks at the plot, there is some trend, p > 5%. Image
Read 5 tweets
Dec 10, 2025
Happy to release our newest and largest admixture project. 🧵 Thread with the main findings. Image
First, we compiled data from 100s of sources to estimate genetic ancestry for over 400 units in the Americas. These are countries and subnational divisions of the larger countries, such as US states, Canadian provinces, various Caribbean islands. Results can be seen in these 4 maps.

It was a real pain in the ass to merge the spatial data to produce the maps!Image
Image
Image
Image
Next up, we gathered cognitive ability data from international datasets, and various regional and subnational scholastic tests, and any other source of standardized testing we could find. These were then converted to British international norms (Greenwich mean IQ) as best we could. It gives this map.Image
Image
Read 12 tweets

Did Thread Reader help you today?

Support us! We are indie developers!


This site is made by just two indie developers on a laptop doing marketing, support and development! Read more about the story.

Become a Premium Member ($3/month or $30/year) and get exclusive features!

Become Premium

Don't want to be a Premium member but still want to support us?

Make a small donation by buying us coffee ($5) or help with server cost ($10)

Donate via Paypal

Or Donate anonymously using crypto!

Ethereum

0xfe58350B80634f60Fa6Dc149a72b4DFbc17D341E copy

Bitcoin

3ATGMxNzCUFzxpMCHL5sWSt4DVtS8UqXpi copy

Thank you for your support!

Follow Us!

:(