Here are Excess Deaths for Australia, comparing 2015-2019 against 2020 onwards. Each individual excess death is represented by a single point, spread out across the weeks and years.
🧵
🧵
COVID-19 infections are a direct risk factor for many other issues driving mortality, and also have an indirect impact on health system capacity & functioning, and general population health.
🧵
🧵
With the winding down of testing and reporting for COVID-19, Excess Deaths now give the clearest picture of the ongoing impact of the pandemic.
🧵
🧵
The visual is also available as a vertical scrolling page, which gives a more detailed perspective.
🧵mike-honey.github.io/AUS-excess-dea…
🧵mike-honey.github.io/AUS-excess-dea…
Comparing Excess Deaths to the reported COVID deaths from Australia, there was gap in the early months of 2020, when very few COVID deaths were reported. Testing was extremely limited in that period, so this probably shows a truer picture of the impact of the first wave.
🧵
🧵
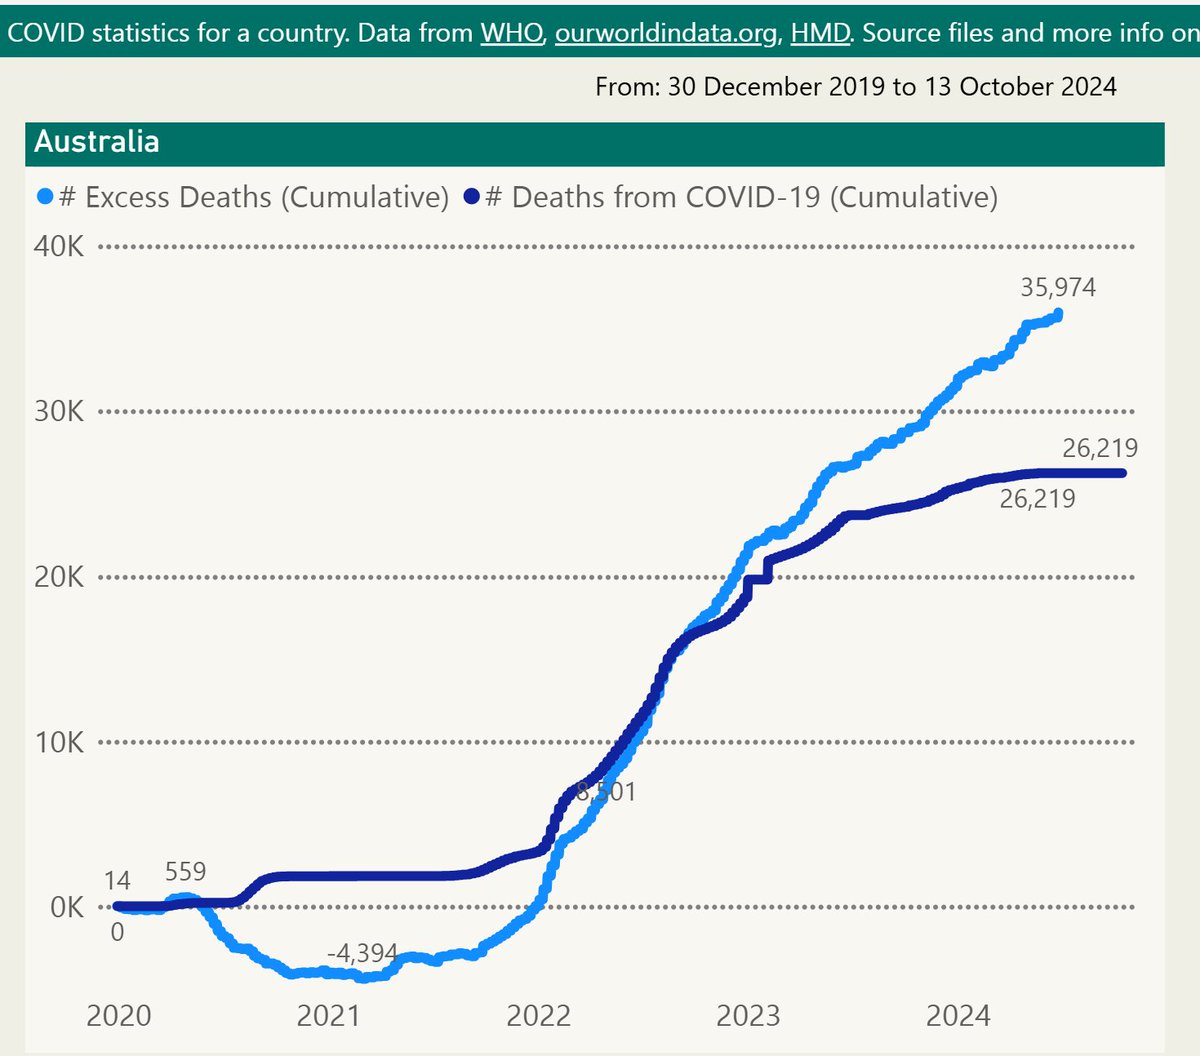
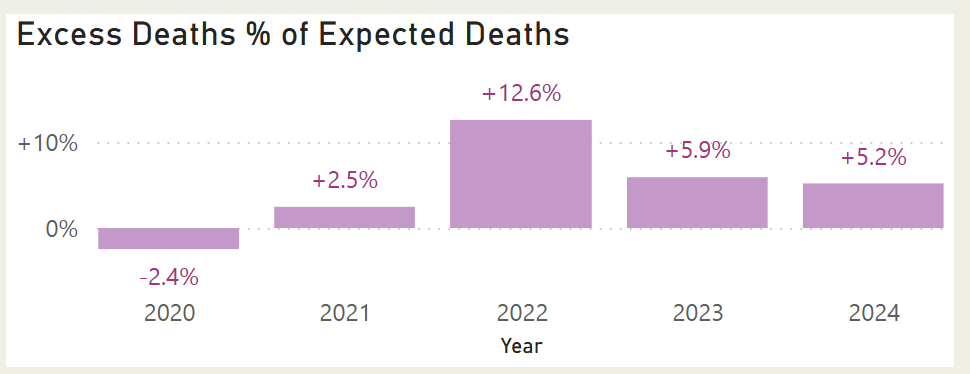
Excess Deaths then famously flipped into negative territory under the protection of the quarantine system during most of 2020 and 2021.
🧵
🧵
Both series accelerated from late 2021 - the "Let It Rip" period. But while reported cases tailed off from mid-2023, Excess Deaths have continued at a similar elevated rate ever since.
🧵
🧵
This contradicts the prevailing government and media narrative, accepted by most in the community; that the pandemic is over and life has returned to normal.
🧵
🧵
Public health leadership surely see the same picture in their data, but in much richer detail.
IMO, it shows the ongoing failure of public health in Australia (as elsewhere) to stand up to the politicians and act in the interests of the public in their care.
🧵
IMO, it shows the ongoing failure of public health in Australia (as elsewhere) to stand up to the politicians and act in the interests of the public in their care.
🧵
The HMD dataset covers several countries - mostly high income/OECD member states. I will try to work through a similar analysis for each one, over the coming weeks/months.
It's a difficult topic, but one I prefer to face realistically.
🧵
It's a difficult topic, but one I prefer to face realistically.
🧵
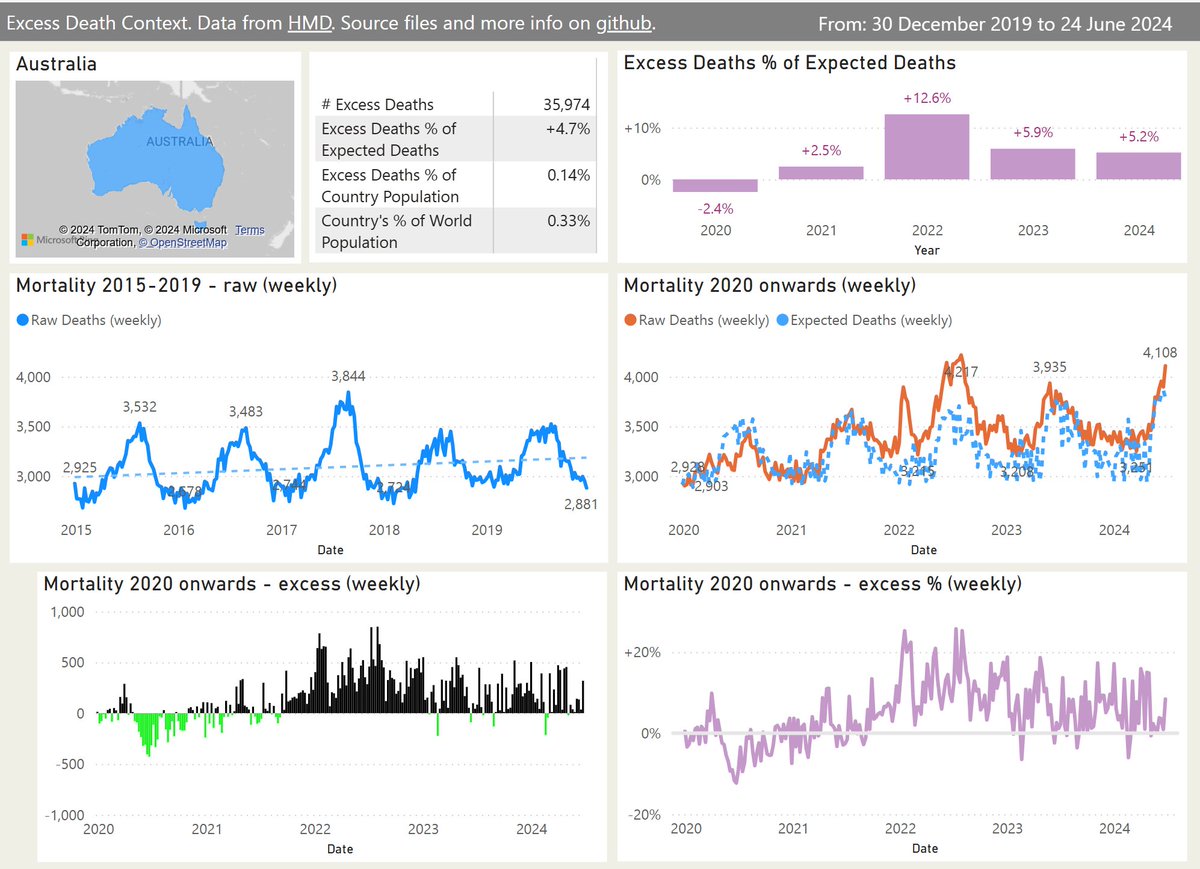
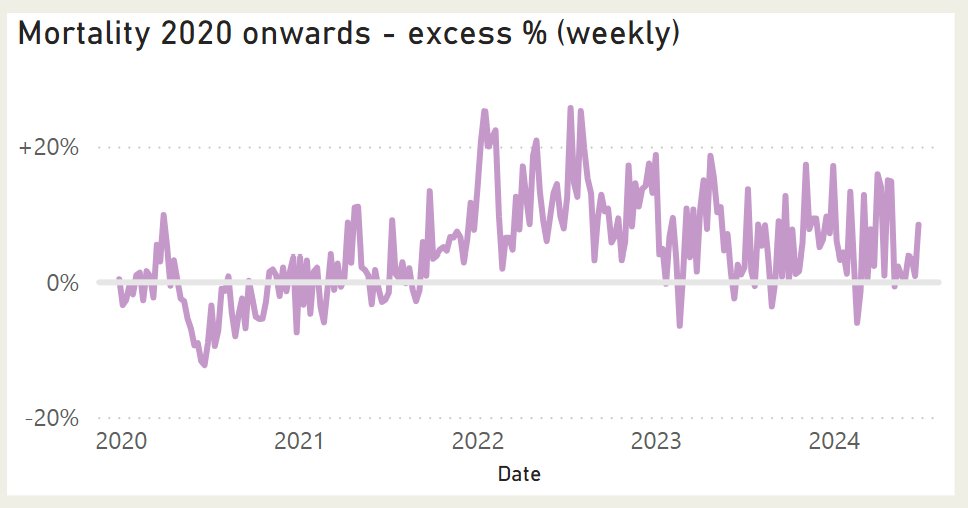
On this "context" page, I've added charts to explain the trends and calculations. For Australia since 2020, the excess deaths are +4.7% higher than the expected deaths.
🧵
🧵
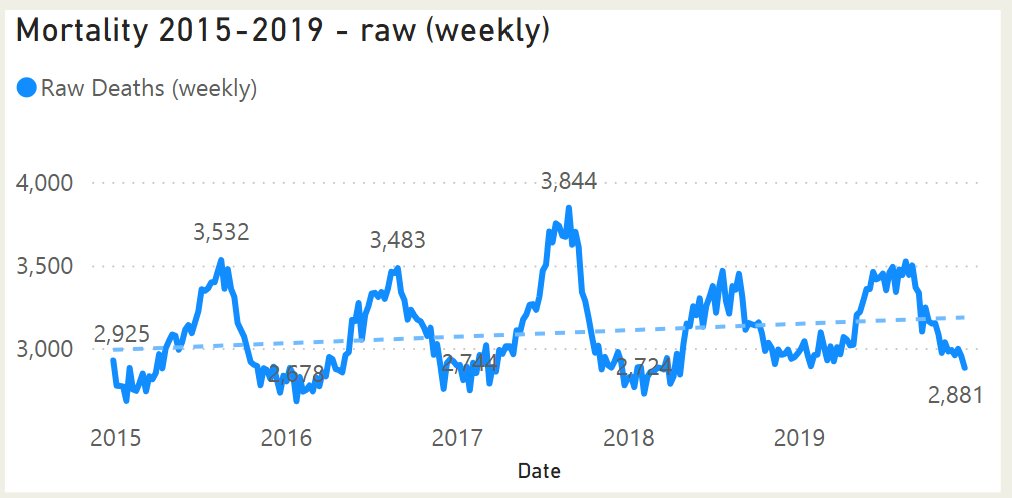
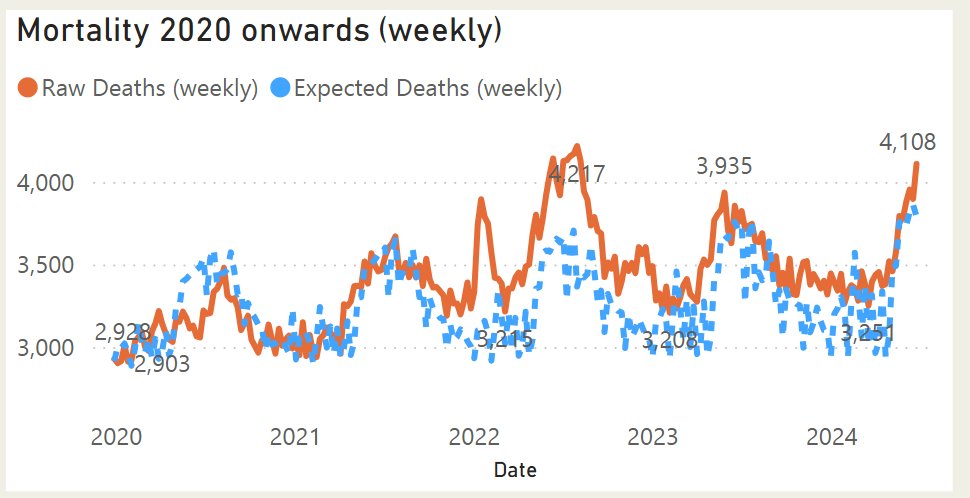
Here's the historical trend of weekly deaths for Australia: 2015 - 2019. The typical pattern was a winter wave and summer lulls.
🧵
🧵
I derive the weekly growth for 2015-2019 and project the counts for 2020 onwards using the growth (or decline). This is standardised by the Age Groups available in the HMD data, to reflect the demographic mix more accurately.
🧵
🧵
The result is considered "Expected Deaths". It is shown here against the actual deaths reported for 2020 onwards.
🧵
🧵
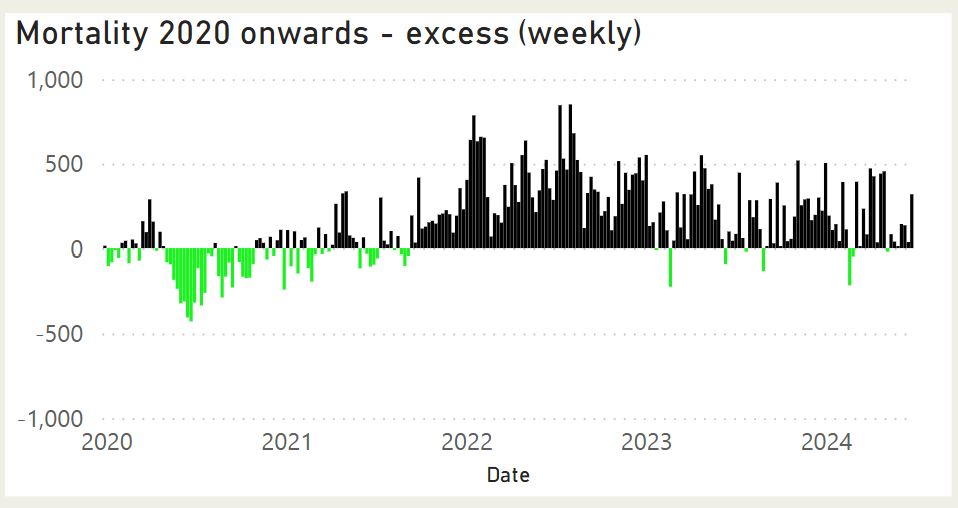
I then subtract "Expected Deaths" from the actual/raw deaths, for 2020 onwards, to get "Excess Deaths".
🧵
🧵
This gives similar results to the analysis of "Excess mortality" presented by OWID:
🧵ourworldindata.org/excess-mortali…
🧵ourworldindata.org/excess-mortali…
Of course Excess Deaths could occur for any reason. But the usual variations from the trend are tiny.
🧵
🧵
If you want to point at any other driving cause besides COVID, to be credible it will need to:
- Be new in 2020, pause until late 2021 then resume
- Result in historically massive increases
- Be timed perfectly in sync with the waves and lulls of COVID, for the last 4-5 years.
🧵
- Be new in 2020, pause until late 2021 then resume
- Result in historically massive increases
- Be timed perfectly in sync with the waves and lulls of COVID, for the last 4-5 years.
🧵
Audio credit:
Djúpalónssandur beach waves.wav by tim.kahn -- -- License: Attribution NonCommercial 4.0
🧵freesound.org/s/349133/
Djúpalónssandur beach waves.wav by tim.kahn -- -- License: Attribution NonCommercial 4.0
🧵freesound.org/s/349133/
On a personal note, I will be imagining several people I knew as dots on the first chart.
I hope this also helps someone out there process their grief.
🧵
I hope this also helps someone out there process their grief.
🧵
Interactive World covid stats dataviz, code, acknowledgements and more info here:
🧵 endsgithub.com/Mike-Honey/cov…
🧵 endsgithub.com/Mike-Honey/cov…
• • •
Missing some Tweet in this thread? You can try to
force a refresh