If you think the pandemic's over, you're badly wrong.
This is the staff absence rate for the seventh largest employer in the world.
See the consistency of the absence rate leading up to the pandemic...
Look at how it changed in 2020.
And see where it's going *now*.
This is the staff absence rate for the seventh largest employer in the world.
See the consistency of the absence rate leading up to the pandemic...
Look at how it changed in 2020.
And see where it's going *now*.

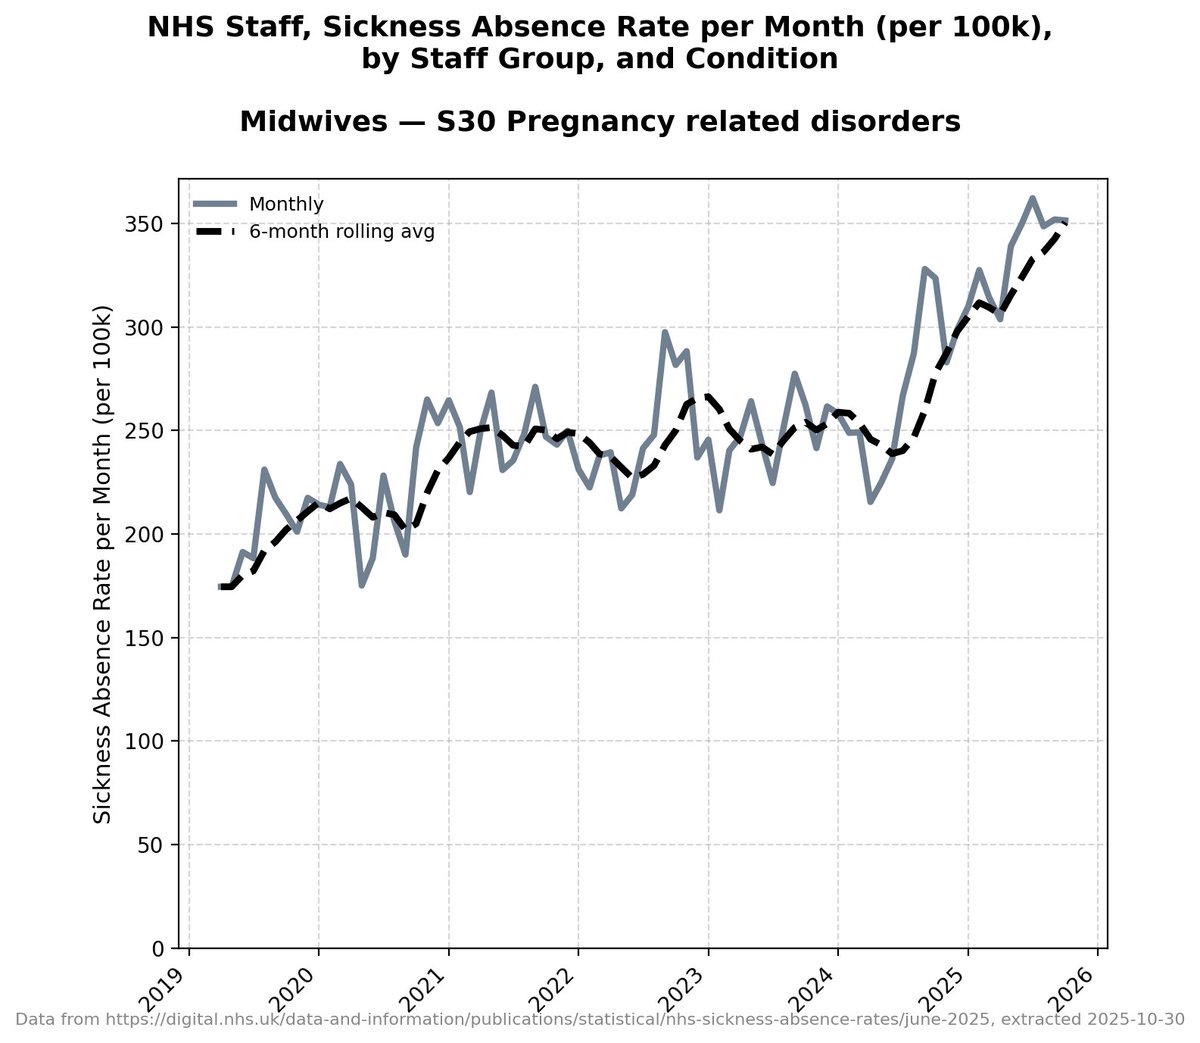
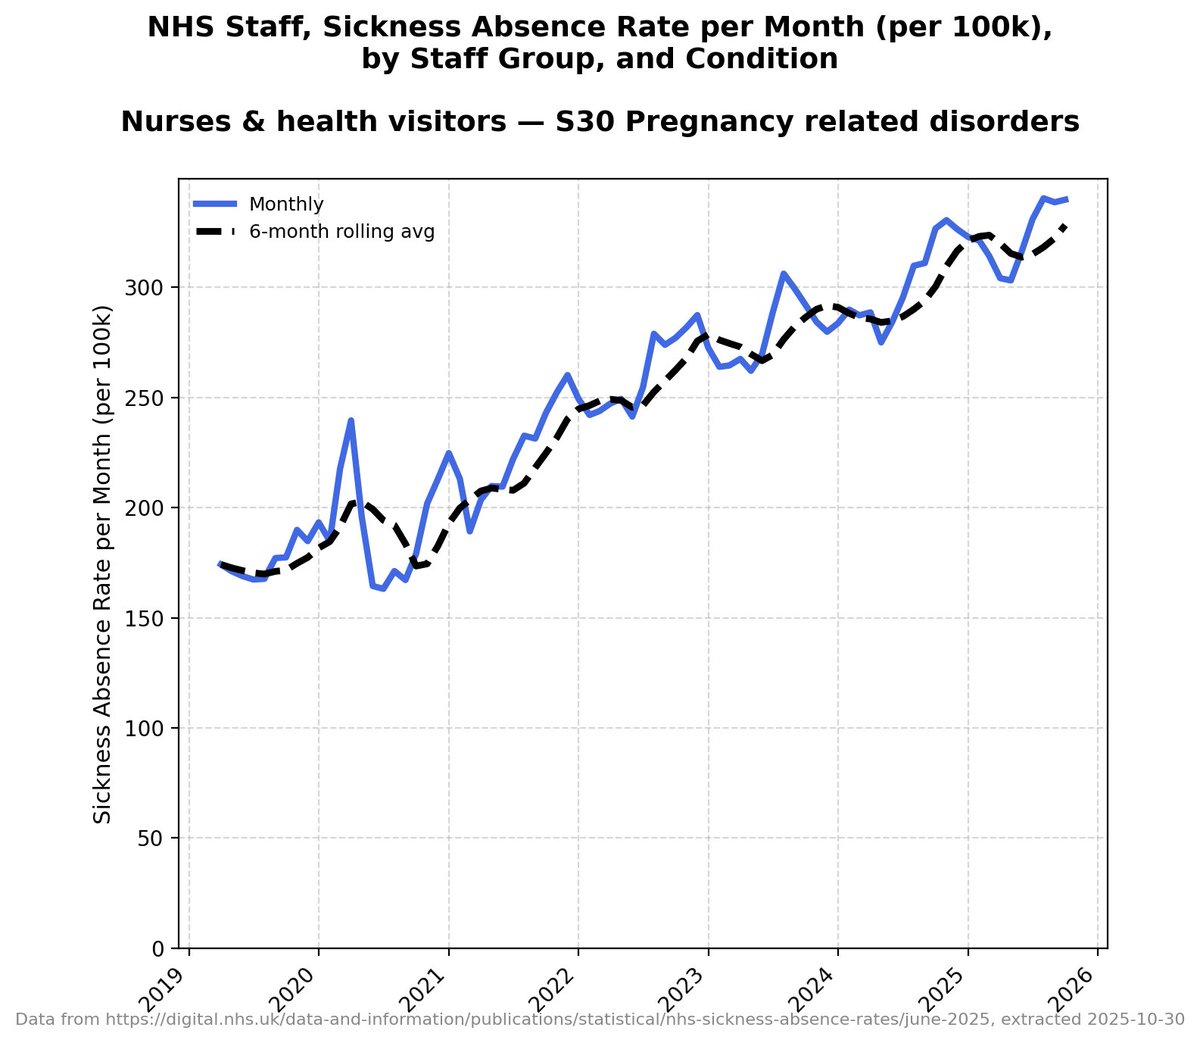
When you break it down by month. You get this.

Pre-covid, this variation is your classic northern hemisphere seasonal infection cycle.
It's annual.
Peak in January most of the time, sometimes a month earlier, sometimes a month later.
Trough in May most of the time, sometimes a month earlier or later.
It's annual.
Peak in January most of the time, sometimes a month earlier, sometimes a month later.
Trough in May most of the time, sometimes a month earlier or later.

Since then... chaos.
Peaks of sickness absence in April, January, March, July, December, and when's the next one going to peak?
And troughs in March, August, May, September...
You know what these all correlate with?
WAVES AND TROUGHS OF FECKING COVID INFECTIONS.
Peaks of sickness absence in April, January, March, July, December, and when's the next one going to peak?
And troughs in March, August, May, September...
You know what these all correlate with?
WAVES AND TROUGHS OF FECKING COVID INFECTIONS.

And meanwhile, the troughs never drop as low as before.
In fact, the BEST absence rate of the last two years is worse than the worst of three of the 8 years leading up to the pandemic...
In fact, the BEST absence rate of the last two years is worse than the worst of three of the 8 years leading up to the pandemic...

But the most recent trough?
It's worse than SEVEN of the EIGHT *peaks* pre-pandemic.
It's worse than SEVEN of the EIGHT *peaks* pre-pandemic.

You want to fix the NHS, @wesstreeting?
Fix Covid, you mewling dewflap.
Fix Covid, you mewling dewflap.
Oh yeah.
And these graphs don't include the staff who left employment because they were disabled by Covid.
And these graphs don't include the staff who left employment because they were disabled by Covid.
And it doesn't include the staff who were killed by Covid.
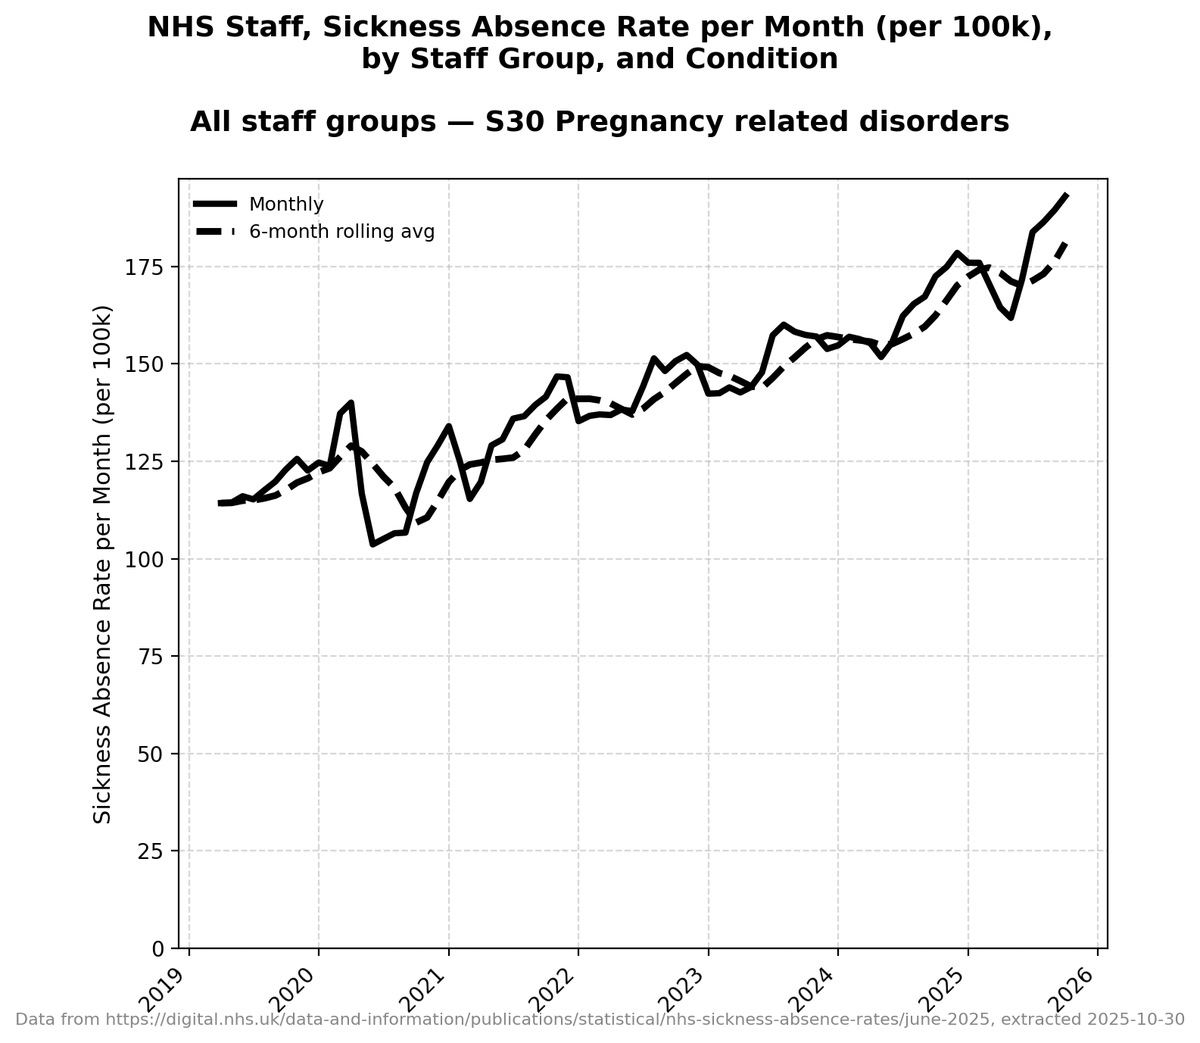
note: all of this data is from the NHS.
Just do a search for 'nhs sickness absence report'.
It's all there.
Just do a search for 'nhs sickness absence report'.
It's all there.
Oh yeah.
And there are people stupid enough to call this bit 'the pandemic'.
😂
And there are people stupid enough to call this bit 'the pandemic'.
😂

oh yeah too:
and the best point of the 12 month rolling sick rate in the last three years is TWENTY PERCENT WORSE THAN THE TREND BEFORE THE PANDEMIC.
and the best point of the 12 month rolling sick rate in the last three years is TWENTY PERCENT WORSE THAN THE TREND BEFORE THE PANDEMIC.

Why?
BECAUSE WE ARE *DURING COVID NOW*.
BECAUSE WE ARE *DURING COVID NOW*.
Oh yeah three... ambulance staff...
Ambulance staff did peak at SIXTY PERCENT worse sickness absence rates in summer (SUMMER) 2022.
They're currently at TWENTY FIVE PERCENT WORSE than the pre-pandemic trend.
Ambulance staff did peak at SIXTY PERCENT worse sickness absence rates in summer (SUMMER) 2022.
They're currently at TWENTY FIVE PERCENT WORSE than the pre-pandemic trend.

Again, that doesn't include the paramedics disabled by catching Covid.
Or the ones it killed.
• • •
Missing some Tweet in this thread? You can try to
force a refresh