Contrary to a popular mainstream view, China's trade surplus has likely been overstated by hundreds of billions per year dating back more than a dozen years.
This 🧵 is a direct rebuttal against claims that the recent changes in BoP methodology are leading to systematic understatement of its trade and current account surplus.
Instead, I show how the change in methodology has addressed prior distortions.
@IMFNews @Brad_Setser
This 🧵 is a direct rebuttal against claims that the recent changes in BoP methodology are leading to systematic understatement of its trade and current account surplus.
Instead, I show how the change in methodology has addressed prior distortions.
@IMFNews @Brad_Setser
To understand why, we need to go back to the the 19th century during the first globalization boom.
This was a time when physical trade flows largely matched funds & value flow, as products produced entirely in one region were traded for those produced entirely in others.
This was a time when physical trade flows largely matched funds & value flow, as products produced entirely in one region were traded for those produced entirely in others.

Fast forward to present day: Trade has gotten significantly more complex.
Lower friction costs of trade made it possible to separate/outsource different segments of the mfg. value chain.
Int'l tax laws incentived firms to shift profits, which distorts customs data.
Lower friction costs of trade made it possible to separate/outsource different segments of the mfg. value chain.
Int'l tax laws incentived firms to shift profits, which distorts customs data.

This is especially true for China, which became the world's factory floor — with the implication that China is the final destination for most of the world's manufactured consumer goods by global brands before they are shipped all around the world.

Rising mfg. complexity & profit-shifting increasingly untether measured physical trade flows from underlying value/fund flows.
The iPhone is one of the best illustrative studies.
This diagram shows how China Customs measures it using physical trade flows.
The iPhone is one of the best illustrative studies.
This diagram shows how China Customs measures it using physical trade flows.

But if we examine actual fund flows — which is the ultimate objective in measuring trade — China switches from being counted as a large net exporter ($31.2B) of iPhones to a larger importer ($21.6B).
This is a $52.8B swing/distortion for a single product from one company.
This is a $52.8B swing/distortion for a single product from one company.

Ultimately the direct funds flow approach is more accurate than the physical flows approach.
After all, China Customs' measurement of physical trade flows had merely been used as a proxy for the underlying fund flows & value transfers.
After all, China Customs' measurement of physical trade flows had merely been used as a proxy for the underlying fund flows & value transfers.

We can further break down the physical vs. fund flows distortions into two key categories.
First, is the overstatement of exports using physical vs. fund flows.
This is driven by the difference b/n customs valuation and actual payments to the contract manufacturer.
First, is the overstatement of exports using physical vs. fund flows.
This is driven by the difference b/n customs valuation and actual payments to the contract manufacturer.
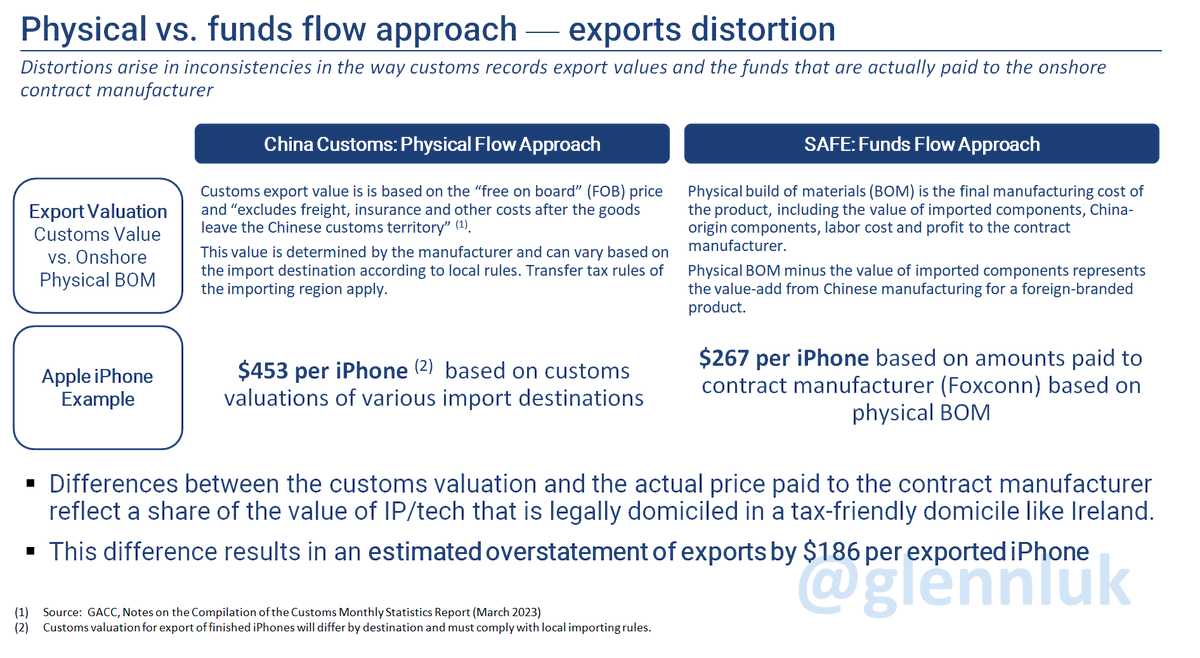
While there is some debate on the exact magnitude of the difference between customs value and payments to the contract manufacturer — as it will vary by industry and product — we know that it can only be distorted in one direction (i.e. overstatement).
Customs value cannot go below amounts paid to the contract manufacturer, but it can be much higher.
This was confirmed recently when analyzing differences in custom valuations between the U.S., Japan and Ireland for the iPhone.
This was confirmed recently when analyzing differences in custom valuations between the U.S., Japan and Ireland for the iPhone.
https://x.com/GlennLuk/status/1849907992612962596
Secondly, there is another key distortion on the measurement of imports between physical and funds flows approaches.
This time it is an understatement — which leads to further overstatement of the surplus.
This time it is an understatement — which leads to further overstatement of the surplus.

As mentioned earlier, combined these distortions add up to an estimated $52.8B just for the iPhone.
And these distortions are not Apple-specific or limited to bonded zones.
They are features of most relationships between foreign brands and Chinese contract factories.
And these distortions are not Apple-specific or limited to bonded zones.
They are features of most relationships between foreign brands and Chinese contract factories.

For example, we see the same phenomenon with global footwear brands like Nike and Adidas that manufacture shoes in China for customers both outside and within China.
Within branded footwear, I calculate a net overstatement of $27.5B.
Less than the iPhone, but still material.
Within branded footwear, I calculate a net overstatement of $27.5B.
Less than the iPhone, but still material.
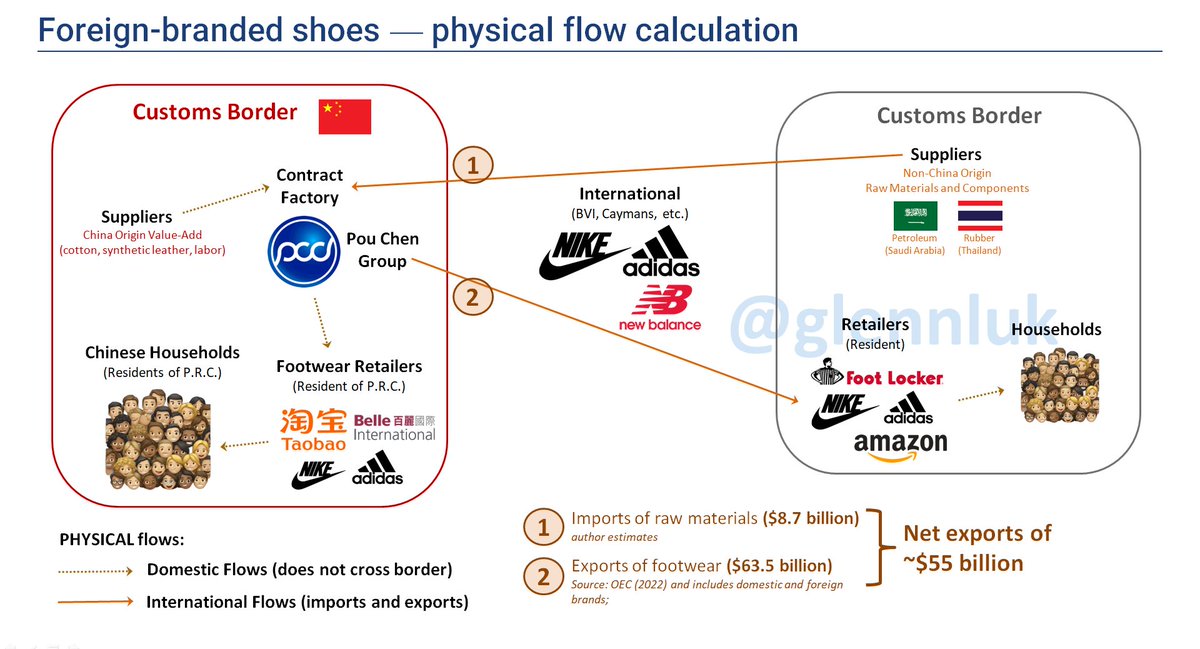

Indeed, we can generally apply this analysis across all sectors where foreign brands contract manufacturing to Chinese factories.

The scope of this net overstatement is large.
I estimate distortions equal to 3.2-4.7% of exports (as measured by China Customs) and 1.1-1.6% of imports, amounting to a combined $142 to 212 billion in '22 — and even this may be quite conservative.
I estimate distortions equal to 3.2-4.7% of exports (as measured by China Customs) and 1.1-1.6% of imports, amounting to a combined $142 to 212 billion in '22 — and even this may be quite conservative.

Keeping all of this context in mind, the change in methodology in 2021-22 from using China Customs physical flows data to underlying funds flow data kept by SAFE (e.g. FX transactions and reported financials) was most likely to correct for these known distortions.

Correcting these known, observable distortions is a far more plausible explanation than speculative claims that the methodological changes were made as a way to understate or otherwise hide its trade surplus.

Indeed, as I discussed in my initial thread on the topics a few weeks ago, there are no signs of a the "hidden capital flight" that would be a necessary balancing implication of a current account surplus that is understated by half a trillion dollars.
https://x.com/GlennLuk/status/1844086467938902195
Instead, this corrects longstanding physical vs. fund flow distortions that have been steadily rising from:
(i) ↗️ exports
(ii) ↗️ use of Chinese contract mfgs, and
(iii)↗️ sophistication of int'l tax optimization strategies via profit shifting to tax havens like Ireland
(i) ↗️ exports
(ii) ↗️ use of Chinese contract mfgs, and
(iii)↗️ sophistication of int'l tax optimization strategies via profit shifting to tax havens like Ireland
Indeed, if we apply general assumptions on distortion levels to BoP figures dating back to 2012, we can see how they adjust E&O in a way that is still consistent with known "hidden capital flight" surges like 2015-18 and 2021-22.

Further analysis will be helpful to further refine these assumptions but the general conclusion here is that it is far more likely that Chinese trade surpluses have been overstated rather than understated over the past dozen years.
Responses to Brad to follow:
https://twitter.com/Brad_Setser/status/1851065752108810391
1. U.S. customs price shows material diff b/n reported customs valuation ($400/iPhone) + iPhone BOM ($270/iPhone), creating the distortion.
The chart below actually confirms the idea raised in CF40 report that Chine’s reported customs exports match trading partners’ import data.
The chart below actually confirms the idea raised in CF40 report that Chine’s reported customs exports match trading partners’ import data.
https://twitter.com/Brad_Setser/status/1851066725246058849
I go into detail in this prior thread to calculate the estimated difference between customs valuations & average iPhone BOM.
Brad keeps citing BOMs for high-end iPhones but the avg. iPhone is $885/retail, suggesting a significantly lower avg. BOM vs. high-end models.
Brad keeps citing BOMs for high-end iPhones but the avg. iPhone is $885/retail, suggesting a significantly lower avg. BOM vs. high-end models.
https://twitter.com/GlennLuk/status/1849907992612962596
Ireland’s much lower customs import price for iPhones strong indication of what is paid to contract manufacturers.
Ireland is a special case because IP is legally domiciled there for international sales.
(U.S. is also special because IP is developed in Cupertino)
Ireland is a special case because IP is legally domiciled there for international sales.
(U.S. is also special because IP is developed in Cupertino)
https://twitter.com/GlennLuk/status/1849908005187334285
2. I do not see the basis for the assertion that customs distortions only arise out of bonded zones.
China and IMF refer to “factoryless” manufacturing, which is much larger than trade our of bonded zones.
China and IMF refer to “factoryless” manufacturing, which is much larger than trade our of bonded zones.
https://twitter.com/Brad_Setser/status/1851068777212907830
I specifically addressed this in my thread here using the example of branded footwear.
Thus Apple and bonded zones cannot represent an “upper bound” on possible export distortions.
Thus Apple and bonded zones cannot represent an “upper bound” on possible export distortions.
https://twitter.com/GlennLuk/status/1851055980353663128
3. I also addressed the import understatement issue in my thread.
https://twitter.com/Brad_Setser/status/1851070258653642876
The specific critique is with Brad’s proposed adjustments.
I agree it would be accounted for in the old methodology as a separate services, royalty or profit line item.
I agree it would be accounted for in the old methodology as a separate services, royalty or profit line item.
https://twitter.com/GlennLuk/status/1851055987622395963
But in Brad’s adjustment, he compares the Customs surplus (which does not include this adjustment) with the new BoP surplus methodology based on fund flows (which does).
This is not apples to apples.
This is not apples to apples.
Thus, adding the full gap between Customs data and (post-adjustment) BoP Surplus double-counts this import understatement adjustment.
My position is that the new methodology properly accounts for the export overstatement and this import understatement.
My position is that the new methodology properly accounts for the export overstatement and this import understatement.
4. If there are valid reasons, such as the rise of these identified distortions, then making the move to the new methodology that ends up reduces E&O should provide comfort, not arouse suspicion.
https://twitter.com/Brad_Setser/status/1851071204683133235
E&O could be a function of distorted official measures (such as the customs exports overstatement) or it could be a sign of hidden capital flight.
What doesn’t pass the sanity check are logical implications of Brad’s position that China’s CA surplus should be adjusted by $500B.
What doesn’t pass the sanity check are logical implications of Brad’s position that China’s CA surplus should be adjusted by $500B.
I discussed why here. There’s just no smoke / evidence that there is hidden capital flight anywhere close to the $500B that would be required to balance out the proposed adjustment.
I’m happy to change my position if evidence can be found of this, but none has been offered.
I’m happy to change my position if evidence can be found of this, but none has been offered.
https://twitter.com/GlennLuk/status/1844086467938902195
I have compiled customs data from OEC for 2022 for some of the larger European countries to fill in some of the remaining gaps.
Est. customs value for iPhone is significantly higher than U.S. (as expected) but also higher than Japan.
Est. customs value for iPhone is significantly higher than U.S. (as expected) but also higher than Japan.

This raises the $/unit customs average to $457. I have used this data to update the previous slide: it now covers >90% of exported iPhones from China.
I've tweaked some of the assumptions (BOP as a % of retail, iPhone/Android price ratio) to be even more conservative.
I've tweaked some of the assumptions (BOP as a % of retail, iPhone/Android price ratio) to be even more conservative.

Updated export overstatement of $27B representing ~32% of the customs export value.
Compares to 10-15% on foreign brand exports, which are ~1/3rd of total exports. This is appropriately conservative, as an iPhone has relatively high intangible content.
Compares to 10-15% on foreign brand exports, which are ~1/3rd of total exports. This is appropriately conservative, as an iPhone has relatively high intangible content.
https://x.com/GlennLuk/status/1851055985248342162
This '21 paper examines the "factoryless" mfg. and distortion effect on "trade vs. income flows".
Based on five US "factoryless" cos (Apple, Nike, Qualcomm, Cisco, AMD), researchers found $70B (~36%) of trade distortion on $190B in int'l revenue.
ideas.repec.org/p/ngi/dpaper/2…
Based on five US "factoryless" cos (Apple, Nike, Qualcomm, Cisco, AMD), researchers found $70B (~36%) of trade distortion on $190B in int'l revenue.
ideas.repec.org/p/ngi/dpaper/2…


This is consistent with the up-to-date analysis I have done on the Apple iPhone, providing a nice sanity check.
https://x.com/GlennLuk/status/1851301832599224679
This distortion is generally applicable to all "factoryless manufacturing" where a foreign company works with a Chinese contract manufacturer.
This includes most of the $1.1T in exports that include a "foreign-funded" exporter (e.g. Foxconn, Pou Chen)
This includes most of the $1.1T in exports that include a "foreign-funded" exporter (e.g. Foxconn, Pou Chen)
https://x.com/GlennLuk/status/1851055985248342162
In other words, it is not just "bonded zones", which are a subset of "factoryless manufacturing" for products like the iPhone where there are large number of finished components that need to be handled logistically.
https://x.com/GlennLuk/status/1851132012112793793
To calculate the range of potential distortions, I use 10-15% of this $1.1T in exports by foreign-funded entities.
This is actually quite conservative based on the Apple and Nike examples, where intangible asset (e.g. brand, tech) make up the majority of the value.
This is actually quite conservative based on the Apple and Nike examples, where intangible asset (e.g. brand, tech) make up the majority of the value.
The value recorded by China Customs for exports is typically based on the Transaction Value method and determined by the importing firm, not by China Customs or the contract manufacturer.
bdo.com/insights/tax/t…
bdo.com/insights/tax/t…
As noted here, intangible value like IP and royalty license should be included in this valuation.
The customs valuation is relevant for the importer because that is the value on which potential duties and VAT are calculated by the importing country.
The customs valuation is relevant for the importer because that is the value on which potential duties and VAT are calculated by the importing country.


The Transaction Value (TxV) method is the dominant form to estimate customs valuation, used in “90-95%” of transactions.
It’s discrepancies between TxV — determined by the importer — recorded by China Customs and the price paid to the CM that create export overstatement.
It’s discrepancies between TxV — determined by the importer — recorded by China Customs and the price paid to the CM that create export overstatement.
https://twitter.com/GlennLuk/status/1851055982530466087
• • •
Missing some Tweet in this thread? You can try to
force a refresh